Sales Analysis: How to Turn CRM Data Into Revenue Decisions
84% of sales reps missed quota last year. Not because they couldn't sell - because their organizations couldn't tell them where to focus. Meanwhile, 73% of sales orgs can't extract insights from their data fast enough to influence deal outcomes. The gap isn't dashboards or BI tools. It's that teams skip rigorous analysis, feed bad data into confident conclusions, and wonder why the forecast was wrong again.
What You Need (Quick Version)
Every useful analysis rests on three prerequisites:
- Clean data. If 20% of your CRM contacts have invalid emails or stale job titles, every metric you calculate is fiction.
- The right metrics. Not all of them - the five or six that actually connect to revenue decisions for your business.
- A decision framework. Analysis without a "so what do we do?" step is just reporting.
Your highest-ROI starting project? A data quality audit. The tool stack that covers 90% of use cases: your CRM, a spreadsheet or BI layer, and a data enrichment platform to keep everything fresh (see data enrichment services).
What Is Sales Analysis?
Sales analysis is the process of examining pipeline, revenue, activity, and conversion data to find patterns that inform decisions. It's not the same as sales intelligence - gathering raw data about prospects and markets - or sales analytics, which is the broader discipline of tools and processes that make analysis repeatable. Intelligence feeds the data, analysis extracts the insight, analytics scales the whole thing.
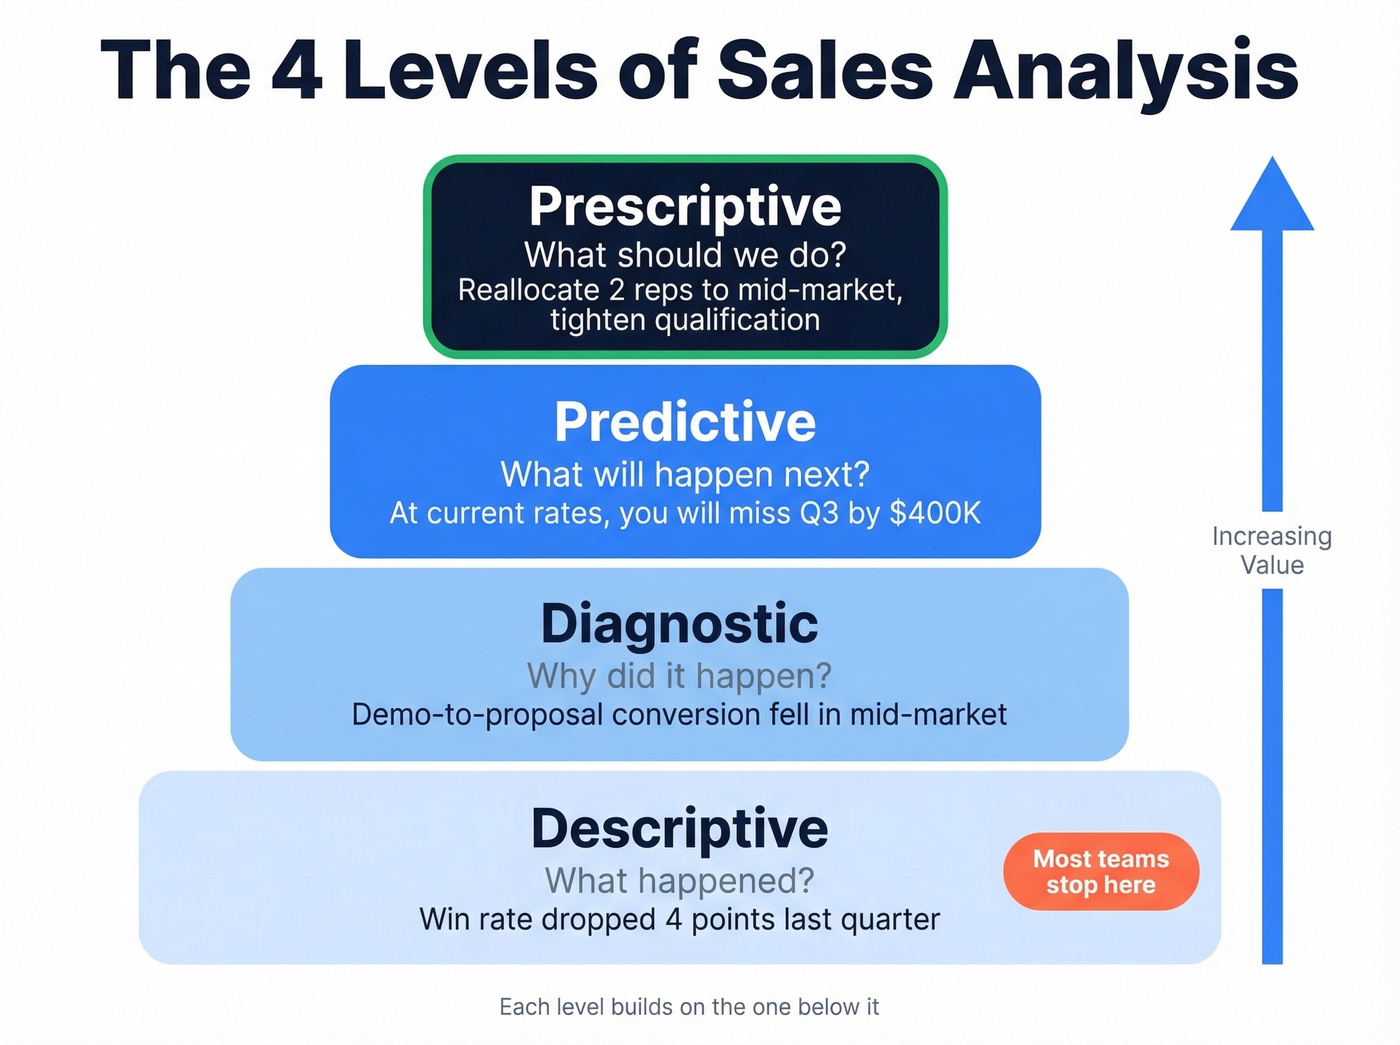
There are four types, and they build on each other. Descriptive answers "what happened" - your win rate dropped 4 points last quarter. Diagnostic answers "why" - demo-to-proposal conversion fell in the mid-market segment. This is where you diagnose past deals to understand exactly which stage broke and what caused the loss.
Predictive answers "what's likely next" - at current rates, you'll miss Q3 by $400K. Prescriptive answers "what should we do" - reallocate two reps to mid-market and tighten qualification criteria. Most orgs never get past descriptive. That's the problem.
Why It Matters - The Numbers
Let's walk through a real funnel to make this concrete.
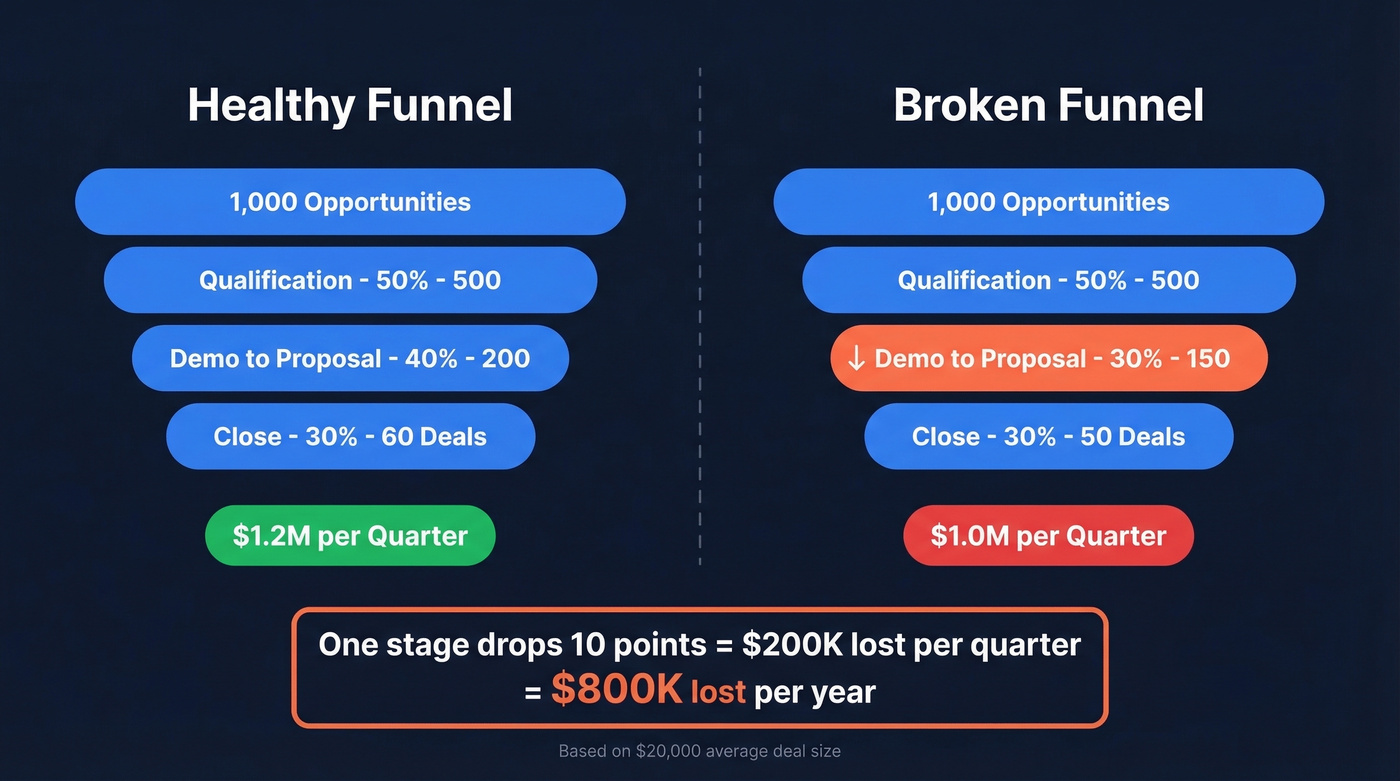
Say you run 1,000 opportunities per quarter through a four-stage pipeline: qualification, demo, proposal, close. Stage conversions are 50%, 40%, and 30% respectively. That gives you a 6% overall win rate, 60 closed deals, and - at a $20,000 average deal size - $1.2M per quarter.
Now imagine your demo-to-proposal conversion drops from 40% to 30%. Just one stage. Your overall win rate falls to 5%, you close 50 deals instead of 60, and quarterly revenue drops to $1.0M. That's a $200K/quarter loss - $800K/year - from a single-stage degradation that nobody caught because the pipeline dashboard only showed top-line numbers.
We've watched this exact scenario play out at multiple companies. Sales cycles have lengthened 32% since 2021, and over half of revenue leaders missed a forecast at least twice in the past year. The teams that catch these shifts early are the ones doing real performance analysis, not just reporting.
Here's the thing: most teams don't have an analytics problem. They have a data quality problem dressed up as an analytics problem. Fix the inputs before you buy another dashboard tool.
The 5-Step Process
1. Collect Your Data Sources
Start by mapping every place sales data lives. That's your CRM - where deals, stages, and close dates live - your outreach tool tracking emails sent, replies, and meetings booked, your marketing platform for lead source and campaign attribution, and your finance system for actual revenue, refunds, and churn. You don't need to centralize everything on day one. Just know where it all is and what each source is good for.
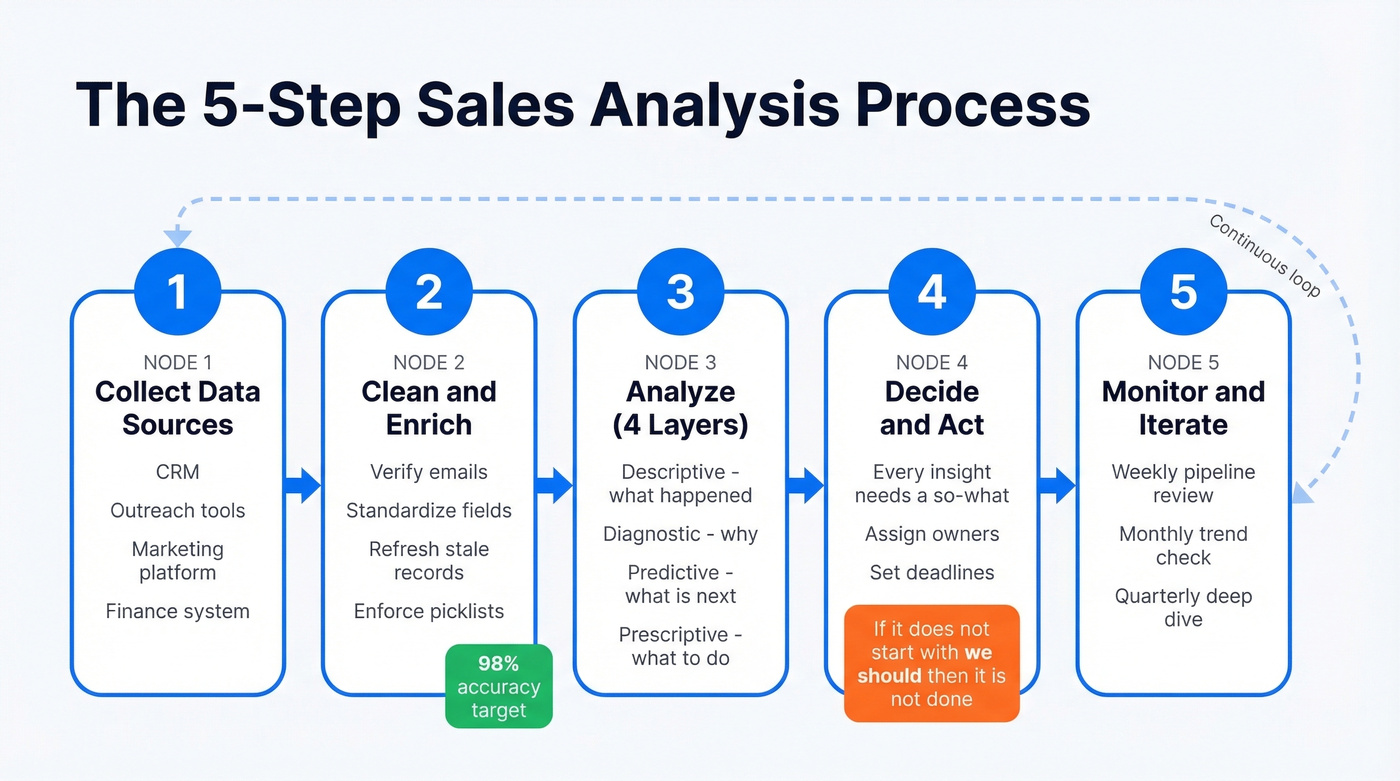
2. Clean and Enrich First
Invalid emails inflate your conversion rates and corrupt pipeline value. Run your contact database through an enrichment tool before you analyze anything (use a proper email checker as part of the process).
Prospeo handles this well - verifying emails in real time and enriching records with 50+ data points at 98% email accuracy, with all records refreshed on a 7-day cycle. That means the data you're analyzing actually reflects reality, not a six-month-old snapshot.
Beyond contact data, standardize your CRM fields. If reps enter "lost - no budget" and "closed lost: budget" and "no $$$" for the same outcome, your loss-reason analysis is useless. Set picklist values. Enforce them.
3. Run Descriptive to Prescriptive
Start descriptive: what happened last quarter? Win rates, conversion by stage, average deal size, cycle length, revenue by segment. Then go diagnostic: where did the funnel break? Which rep, territory, or segment underperformed - and why? Layer in predictive when you have enough historical data. Finally, prescriptive: what specific actions should we take?
A practical tip from Close's sales analysis framework: five metrics with clear "so what" statements beat twenty metrics with no context.
4. Turn Insights Into Decisions
Every analysis should end with a decision. "Win rate dropped 4 points" isn't an insight - it's an observation. "Win rate dropped 4 points because mid-market demo-to-proposal conversion fell, likely due to the new pricing page confusing prospects - recommendation: revert to the old pricing layout and A/B test" - that's an insight.
A complete analysis report covers actual vs. projected sales, product demand signals, and customer segment performance. If your analysis doesn't produce a sentence that starts with "we should," it's not done yet.
5. Monitor and Iterate
Set up weekly cadences for pipeline and activity metrics, monthly reviews for performance trends, and quarterly deep dives for strategic questions like win/loss patterns, churn drivers, and territory optimization (tie this to pipeline health so you can spot issues early). In our experience, the teams that treat analysis as a continuous loop - not a one-off report - are the ones that consistently hit forecast.
You just read that a single-stage conversion drop can cost $800K/year - but only if you catch it with clean data. Prospeo enriches your CRM with 50+ data points per contact at 98% email accuracy, refreshed every 7 days. That means every metric you calculate reflects reality, not a six-month-old snapshot.
Stop analyzing fiction. Start with data you can trust.
Key Metrics and Benchmarks
Here's the benchmark table that every other guide skips. These are directional averages - your numbers will vary by industry, deal size, and sales motion. But they give you a baseline to measure against.
| Metric | Formula | Benchmark | What It Tells You |
|---|---|---|---|
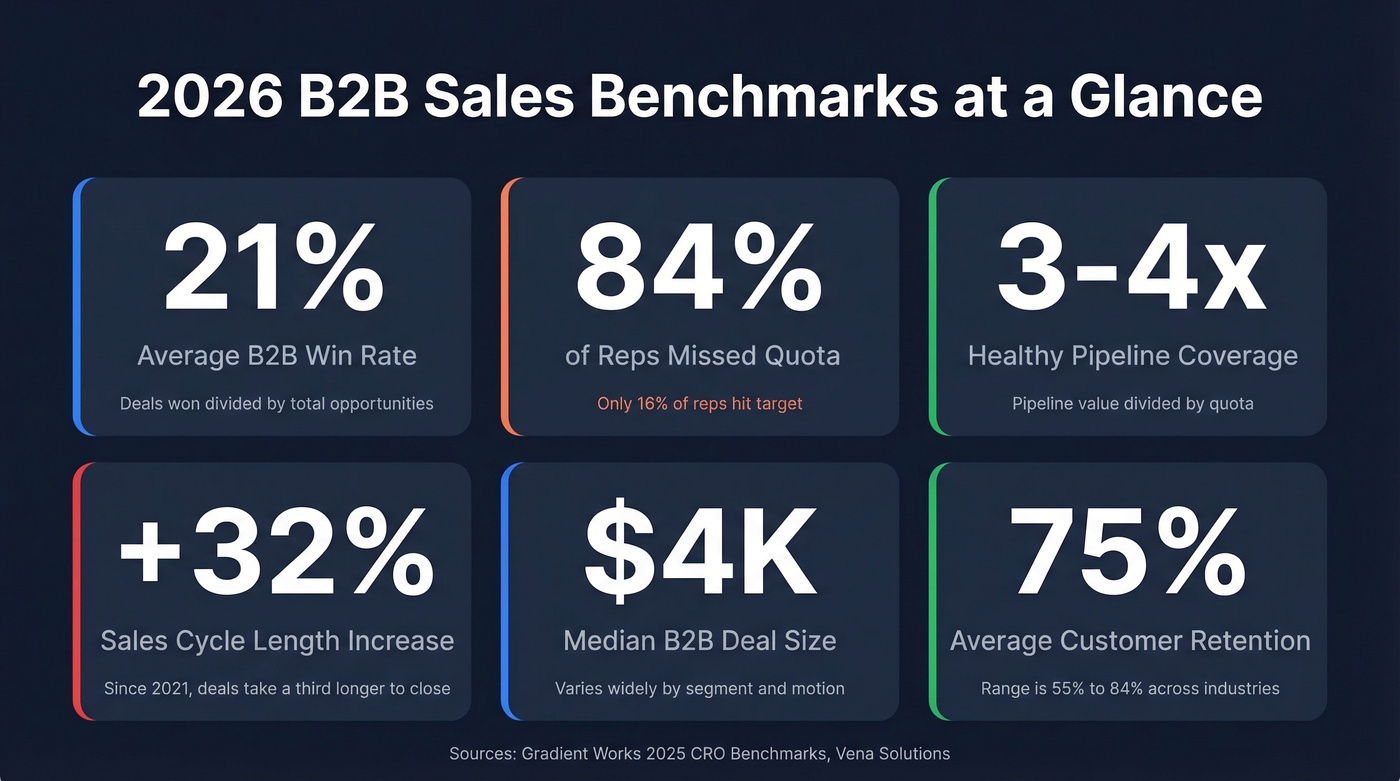
| Win rate | Deals won / total opps | 21% avg B2B | Quality + effectiveness |
| Conversion rate | Stage exits / stage entries | 30-50% early, 20-40% late | Where the funnel leaks |
| Sales velocity | (Opps x win rate x deal size) / cycle length | Track QoQ; 10%+ gain = strong | Revenue generation speed |
| Avg deal size | Total revenue / deals closed | ~$4K median B2B | Market positioning signal |
| Pipeline coverage | Pipeline value / quota | 3-4x healthy | Forecast confidence |
| Quota attainment | Actual revenue / quota | 16% hit (84% miss) | Rep + territory health |
| Sales cycle length | Avg days from opp creation to close | Up 32% since 2021 | Process efficiency |
| Customer retention | Customers retained / total | 75% avg (55-84%) | Post-sale health |
| Revenue per rep | Total revenue / headcount | $500K-$1M+ ARR for B2B SaaS | Capacity planning input |
The win rate and quota attainment numbers deserve your attention first. If your team's win rate sits well below 21%, the problem is almost always upstream - lead quality or qualification criteria (tighten this with an ideal customer profile). Low quota attainment, on the other hand, is more often a quota-setting issue than a rep performance issue, though few leaders want to hear that.
Worked Example - Reading a Dataset
Let's walk through a simple dataset the way you'd actually analyze it on a Monday morning.
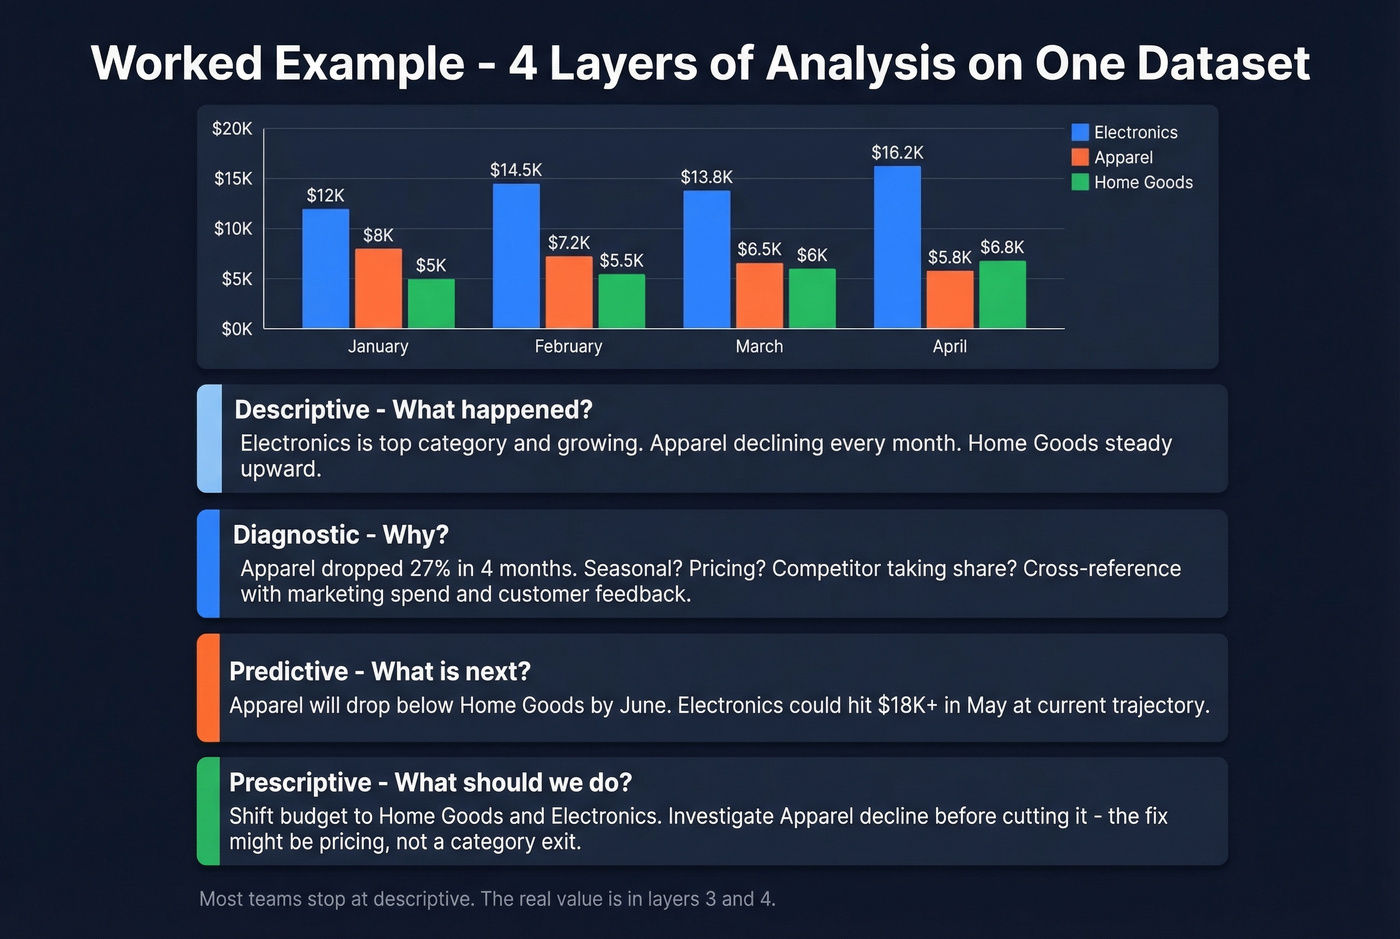
| Category | January | February | March | April |
|---|---|---|---|---|
| Electronics | $12,000 | $14,500 | $13,800 | $16,200 |
| Apparel | $8,000 | $7,200 | $6,500 | $5,800 |
| Home Goods | $5,000 | $5,500 | $6,000 | $6,800 |
Descriptive: Electronics is your top category and growing. Apparel is declining month-over-month. Home Goods shows steady upward momentum.
Diagnostic: Apparel dropped ~27% over four months. Is it seasonal? A pricing issue? A competitor taking share? Cross-reference with marketing spend, competitive intel, and customer feedback (formalize this with a competitive intelligence strategy).
Predictive: If Apparel continues declining at this rate, it'll drop below Home Goods by June. Electronics, extrapolated linearly, could hit $18K+ in May.
Prescriptive: Shift marketing budget from Apparel to Home Goods and Electronics. Investigate Apparel's decline before cutting it entirely - the fix might be a pricing adjustment, not a category exit.
Four layers of analysis from one simple table. We've seen nearly every team stop at descriptive and wonder why their strategy doesn't improve.
Projects That Move Revenue
Scorecards, Dashboards, and Lead Scoring
Your first two projects should be a rep scorecard and a weekly pipeline dashboard. The scorecard tracks activity metrics alongside outcome metrics per rep - calls and emails on one axis, opps created and revenue on the other. The pipeline dashboard shows stage-by-stage value, velocity, and aging.
You can build both in Google Sheets or use your CRM's native reporting. HubSpot offers free templates that give you a solid starting architecture. Once those are running, add lead priority scoring - tagging leads as high, medium, or low based on conversion likelihood from your historical data (see lead scoring). This alone can lift rep productivity by focusing effort where it matters.
Win/Loss, Churn, and Segmentation
Move to win/loss analysis to understand why deals close or don't, churn analysis to identify which customers leave and what they share in common (use a structured churn analysis approach), and customer segmentation. When you diagnose past deals systematically - reviewing objections, competitor mentions, and timeline stalls - you build a playbook that prevents the same losses from recurring.
For segmentation, combine cohort analysis with RFM scoring - Recency, Frequency, Monetary value - to categorize accounts as VIPs, loyal, at-risk, or lost. Each segment requires a different retention play. Don't overlook pricing and product mix analysis either; understanding which bundles drive the highest margins often reveals quick revenue wins that were sitting in the data the whole time.
Skip the more advanced techniques like time series decomposition and Bollinger Band-style deviation analysis unless you have a dedicated analyst on staff. They're powerful, but they require someone who can maintain and interpret the models - otherwise they just become expensive noise.
Tools and What They Cost
CRM-Native Analytics
Salesforce starts at $25/user/mo and scales into deeply customizable dashboards at higher tiers (see Salesforce pricing). HubSpot offers a free CRM with basic reporting - paid plans with advanced/custom reporting typically start around $90-$150+/user/mo depending on seats and edition. Pipedrive starts at $14/user/mo and is the most intuitive option for small teams that need pipeline visibility without a dedicated admin.
BI and Revenue Intelligence
Tableau starts at $15/user/mo for complex visualizations. Power BI is free for individual use, $10/user/mo for Pro, and integrates tightly with Microsoft shops. Looker Studio is free and surprisingly capable for basic dashboards. Zoho Analytics starts at $24/mo for teams already in the Zoho ecosystem.
For revenue intelligence - conversation analytics, deal scoring, forecast modeling - Gong typically runs ~$100-200/user/mo, and Clari is custom-priced, typically $50K-150K+/year for mid-market and up. Unless you're running 20+ reps and have the deal volume to justify it, these are overkill. Start with your CRM's built-in reporting and a spreadsheet.
B2B Data and Enrichment
Your analysis is only as good as the data feeding it. Prospeo enriches CRM records with 50+ data points per contact at a 92% API match rate, and 83% of leads come back with contact data. It integrates natively with Salesforce, HubSpot, and major outreach tools like Lemlist, Instantly, and Clay. The free tier gives you 75 emails plus 100 Chrome extension credits per month, with paid plans running ~$0.01/email after that.
| Category | Tool | Starting Price |
|---|---|---|
| CRM | Salesforce | $25/user/mo |
| CRM | HubSpot | Free-$150+/user/mo |
| CRM | Pipedrive | $14/user/mo |
| BI | Tableau | $15/user/mo |
| BI | Power BI | Free-$10/user/mo |
| BI | Looker Studio | Free |
| Revenue Intel | Gong | ~$100-200/user/mo |
| Revenue Intel | Clari | ~$50K-150K+/yr |
| B2B Data | Prospeo | Free-~$0.01/email |
84% of reps missed quota because their orgs couldn't tell them where to focus. The fix starts upstream: clean contact data that doesn't inflate conversion rates or corrupt pipeline value. Prospeo's 5-step verification and 7-day refresh cycle keep your analysis grounded - at $0.01 per email.
Every sales analysis is wrong until the inputs are right.
Mistakes That Corrupt Your Analysis
Over 70% of small businesses still track sales using spreadsheets or notebooks. That's not inherently wrong - but it creates specific failure modes:
- Unclear goals. Define what decision the analysis should inform before you pull any data.
- Inconsistent data entry. Standardize picklist values and enforce them. "Lost - budget" and "no budget" aren't the same field.
- Not tracking individual reps. Team averages hide your best and worst performers. Break everything down by person.
- Ignoring returns and refunds. Revenue that comes back isn't revenue. Net it out or your growth numbers are inflated.
- Choosing the wrong tool. A $50K/year BI platform doesn't help if nobody on the team can build a report. Match tool complexity to team capability.
- No data quality process. If you aren't verifying and refreshing CRM data on a regular cycle, every metric drifts further from reality over time.
- Neglecting closing data. If you only track top-of-funnel activity and ignore what happens at the close - discount depth, negotiation rounds, contract terms - you miss the insights that directly impact margin and deal quality (use a consistent sales process optimization approach to capture it).
A common pattern on r/analytics: teams build a basic dashboard, declare victory, and never do the diagnostic or prescriptive work that actually moves revenue. Don't be that team.
FAQ
What's the difference between sales analysis and sales analytics?
Sales analysis is the act of examining data to find specific insights - a point-in-time exercise. Sales analytics is the broader discipline of tools, methods, and repeatable processes that make analysis scalable across the organization. You do analysis; you build analytics.
How often should I run one?
Weekly for pipeline and activity metrics, monthly for performance trends, quarterly for strategic reviews like win/loss and churn. If your sales cycle is under 30 days, lean toward more frequent cadences. Longer enterprise cycles can stretch to monthly pipeline reviews.
What's the fastest way to improve accuracy?
Clean your data first - everything else is downstream. Verify and refresh CRM contacts on a regular cycle so the stale-record problem that quietly corrupts every metric you calculate doesn't compound quarter after quarter.
How do I use closing data to improve win rates?
Track discount percentage, stakeholder count, days between proposal and signature, and final-stage objections across every closed deal. Patterns emerge - like which discount thresholds correlate with faster closes or which objection types signal a stalling deal. That intelligence feeds directly into rep coaching and pricing strategy.