Sales Enablement Objectives That Actually Move Revenue
You built the battlecards. You recorded the walkthrough videos. You shipped the messaging guide. And half the time, you've got no idea if sales even opened any of it - a frustration echoed constantly across enablement communities on Reddit.
Here's the number that should bother you: 60-70% of marketing content goes unused because reps can't find it. Companies are pouring money into enablement initiatives - the market hits $8.79B by 2029 - but most of that spend gets measured by outputs (decks created, sessions delivered) instead of outcomes (deals won, ramp shortened). Getting your sales enablement objectives right is the difference between a cost center and a revenue engine.
TL;DR: Most enablement fails because teams set output objectives ("create 20 battlecards") instead of outcome objectives ("increase competitive win rate by 15%"). Start with three: reduce ramp time, increase content adoption, improve win rate. Everything else is a distraction until those move.
Three Goals That Actually Matter
Clari frames enablement around three primary objectives, and it's the cleanest framework we've found:
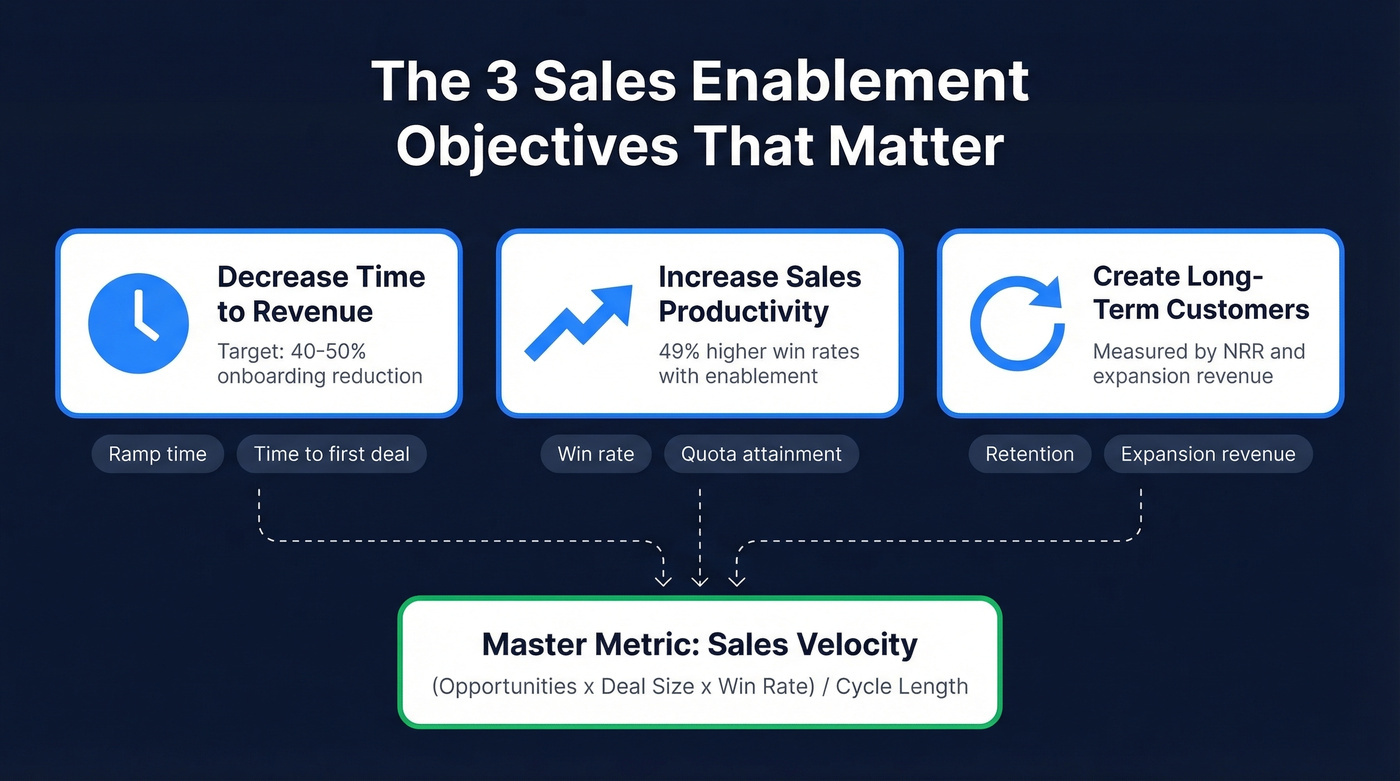
- Decrease time to revenue - target onboarding time reduction of 40-50% for new hires (pair this with a clear 30-60-90 day plan so ramp is measurable)
- Increase sales productivity - teams with an enablement strategy see 49% higher win rates on forecasted deals (this is where sales training and reinforcement actually show up in numbers)
- Create long-term customers - measured through expansion revenue, NRR, and retention tied to sales-led onboarding (tie this to renewal rate tracking)
Every other enablement objective ladders up to one of these three. If it doesn't, question whether it belongs on your roadmap at all.
What Teams Actually Measure
The Sales Enablement Landscape Report breaks down which metrics teams track. The distribution is revealing:
| Metric | % of Teams Tracking |
|---|---|
| Content adoption | 50% |
| Quota attainment | 43.1% |
| Win rate | 42.2% |
| Revenue generated | 37.9% |
| Sales cycle length | 33.6% |
| Sales velocity | 27.5% |
Half of teams track content adoption, but only 27.5% track sales velocity. That's a problem. Sales velocity is one of the clearest metrics for pipeline momentum because it bakes win rate, deal size, and cycle length into a single number. An A Gartner observation highlighted in the Landscape Report recap is that enablement teams often prioritize objectives they can't directly control (like pipeline size) over ones they can influence - skills, ramp, behavior change. That's backwards, and it's one of the most common reasons enablement initiatives underperform.
If you want a tighter way to operationalize this, borrow from sales operations metrics and keep enablement reporting aligned to the same definitions.
OKR Templates for Enablement
Use Google's 0.0-1.0 scoring scale. The sweet spot is 0.6-0.7. If you're consistently hitting 1.0, your OKRs aren't ambitious enough.
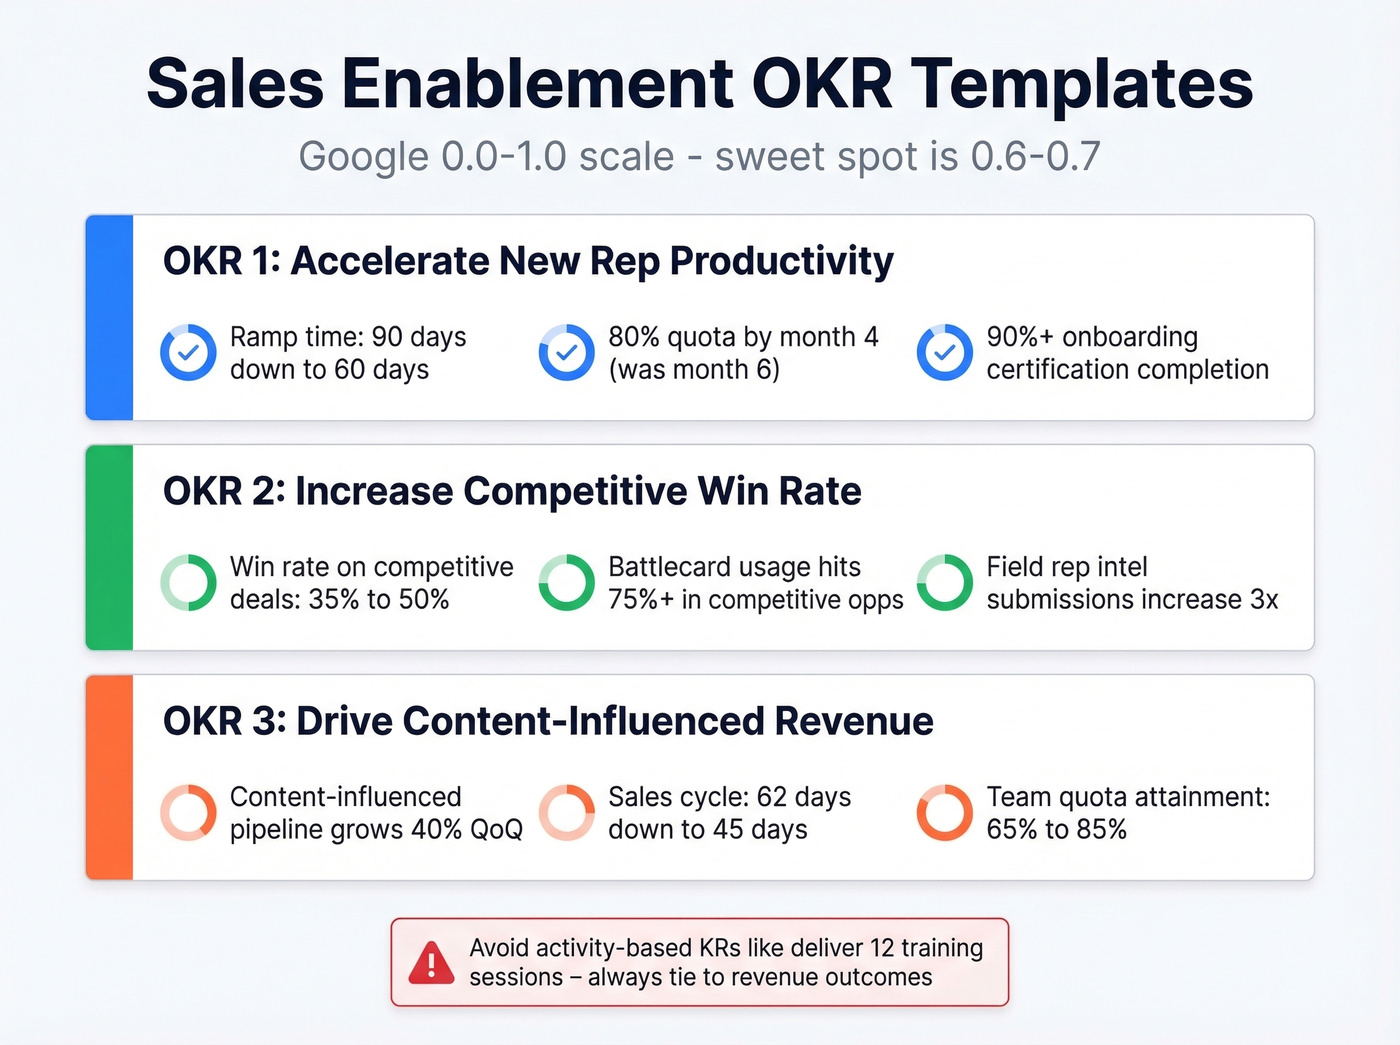
Objective 1: Accelerate new rep productivity
- KR1: Reduce average ramp time from 90 days to 60 days
- KR2: New reps hit 80% of quota by month 4 (up from month 6)
- KR3: 90%+ completion rate on onboarding certification
Objective 2: Increase competitive win rate
- KR1: Win rate on competitive deals from 35% to 50%
- KR2: Battlecard usage in competitive opportunities reaches 75%+
- KR3: Competitive intel submissions from field reps increase 3x (formalize this with a lightweight competitive intelligence strategy)
Objective 3: Drive content-influenced revenue
- KR1: Content-influenced pipeline grows 40% QoQ
- KR2: Sales cycle length decreases from 62 to 45 days
- KR3: Team quota attainment from 65% to 85%
The fastest way to kill OKRs is writing activity-based key results ("deliver 12 training sessions") instead of outcome-based ones. Align every key result to one of your broader enablement targets so progress is always tied to revenue.
If your OKRs depend on CRM fields being clean, prioritize sales process optimization before you blame enablement for "not moving numbers."
Ramp time and win rates don't improve when reps waste hours hunting for contact data. Prospeo gives your team 300M+ verified profiles with 98% email accuracy, so new hires start real conversations from week one - not month three.
Cut ramp time by giving every rep accurate buyer data from day one.
Objectives by Company Stage
Startup (pre-PMF): Enablement is someone spending 25% of their time on it - usually a solutions engineer or founding AE. The objective is simple: make sure every rep articulates the value prop consistently. Define your ICP, build discovery questions, create a first-call deck. That's it. Don't overcomplicate this stage.
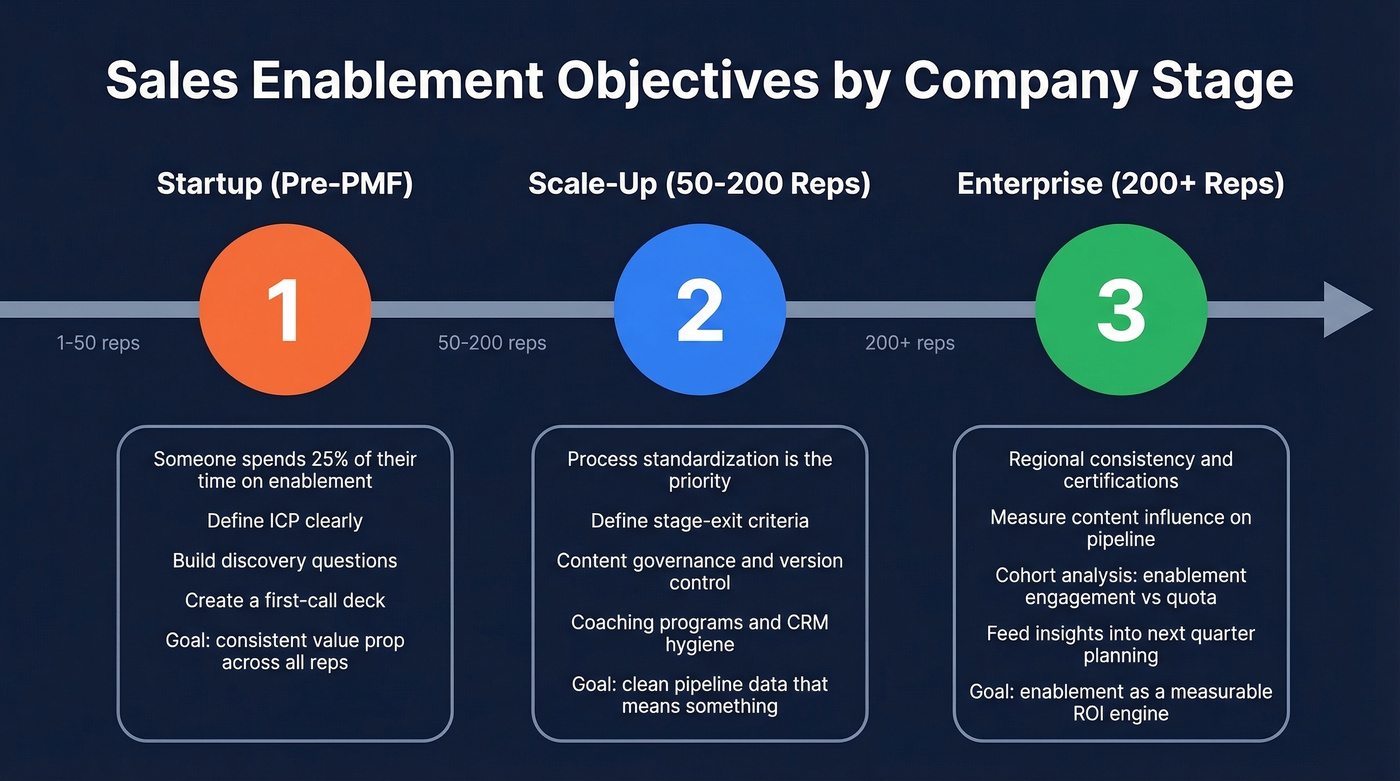
Scale-up (50-200 reps): Process standardization becomes the priority. We've seen scale-ups with 400 deals sitting in MQL for 300+ days because nobody defined stage-exit criteria. Content governance, coaching programs, and CRM hygiene are your enablement targets now. Skip this work and you'll spend the next two quarters untangling pipeline data that means nothing (use a simple pipeline health scorecard to keep teams honest).
Enterprise (200+ reps): Objectives shift to regional consistency, certification programs, and measuring content influence on pipeline. You're running cohort analyses on enablement engagement vs. quota attainment, and the insights from those cohorts should feed directly into next quarter's planning. If they don't, you're just producing reports nobody reads.
The 3-Level Measurement Framework
Most teams measure enablement at only one level. You need all three.
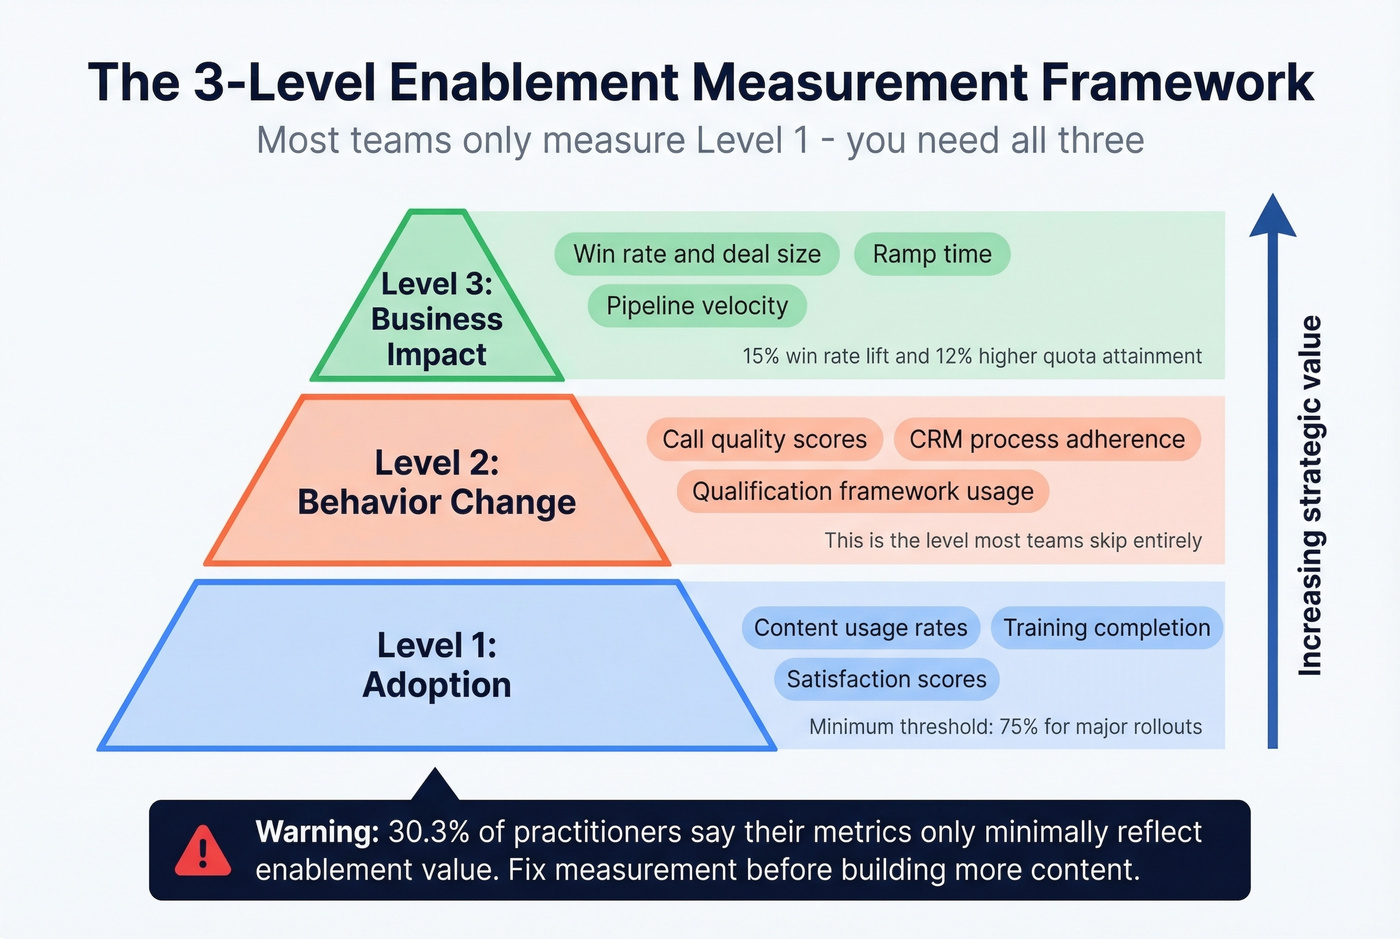
Level 1: Adoption. Content usage rates, training completion, satisfaction scores. For big rollouts like a new methodology, 75% adoption is the minimum threshold - you haven't cleared the bar until most of the team is actually using the thing.
Level 2: Behavior Change. Call quality scores, process adherence in CRM, qualification framework usage. This is where enablement proves it's changing how reps sell, not just what they know. And it's the level most teams skip entirely.
Level 3: Business Impact. Win rate, deal size, ramp time, pipeline velocity. Organizations that treat enablement as an ROI engine see 15% lift in win rates and 12% higher quota attainment. The master metric is sales velocity: (opportunities x avg deal size x win rate) / avg sales cycle length.
Let's be honest - most enablement teams should stop building new content and spend a full quarter just measuring what they already have. You can't optimize what you don't track, and right now 30.3% of practitioners admit their metrics only minimally reflect enablement's actual value. Fix the measurement layer first.
One company spent nearly $500K on a sales methodology rollout and generated $200K in revenue at 35% margin - $430K in the hole for year one. If you aren't measuring at all three levels, you won't know whether the investment is working until it's too late.
Mistakes That Kill Enablement Initiatives
Output-focused objectives. "Create 20 battlecards" should become "increase competitive win rate by 15%." Every objective needs a revenue-linked outcome (and your sales battle cards need usage tracking, not just a PDF in Drive).
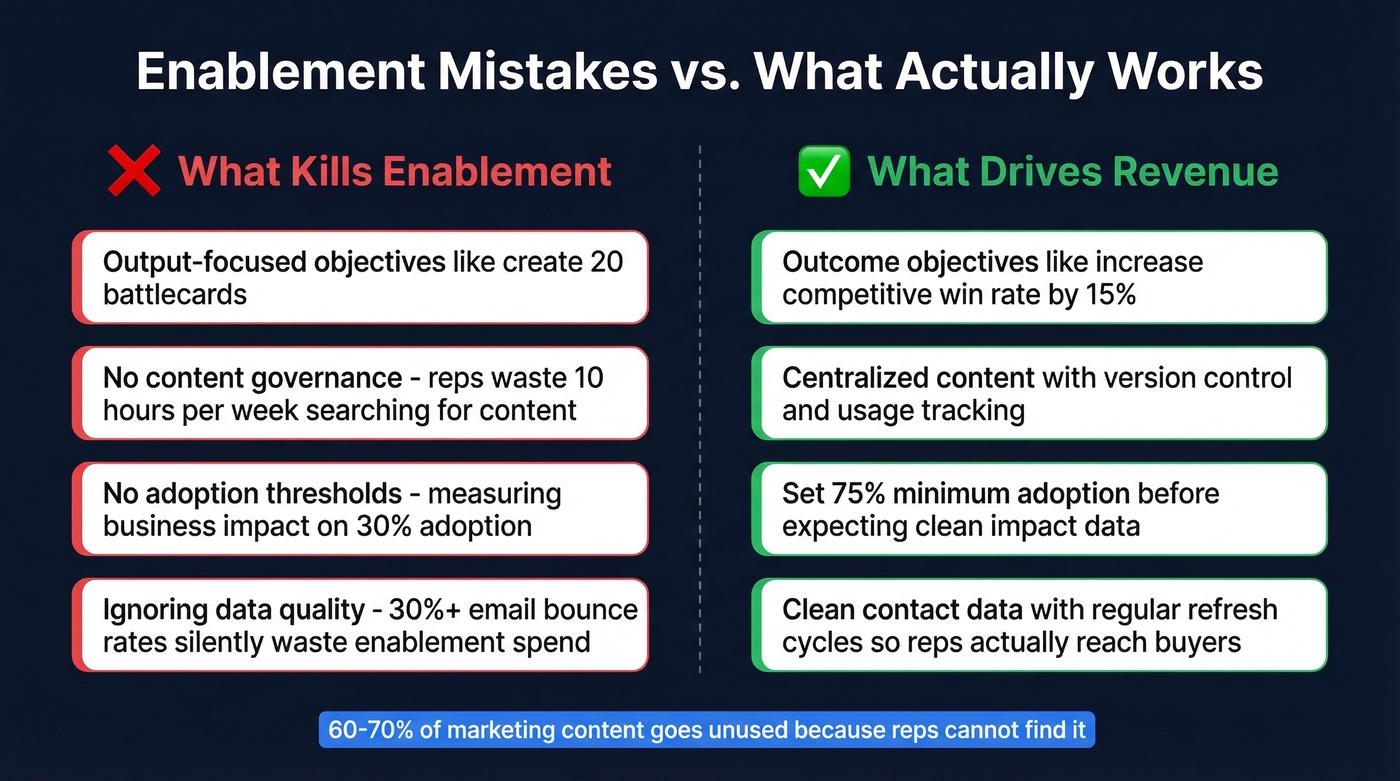
No content governance. Reps waste 10 hours per week searching for content. Centralize with version control and usage tracking.
No adoption thresholds. For major rollouts, set a minimum 75% adoption rate before you expect clean business-impact readouts. Below that, you're measuring noise.
Ignoring the data underneath. Here's the thing: your reps can nail the discovery call, use the right battlecard, and follow the process perfectly - but if 30%+ of their emails bounce, every enablement dollar is partially wasted. In our experience, data quality is the invisible foundation that either amplifies or undermines everything enablement builds. Prospeo's 98% email accuracy and 7-day data refresh cycle keep reps selling instead of chasing dead leads. GreyScout cut rep ramp time from 8-10 weeks to 4 weeks after switching - partly because new reps weren't burning their first month on bad contact data (if bounce is a recurring issue, start with email bounce rate diagnostics).
You're tracking sales velocity, but bad contact data is silently killing it. Bounced emails stretch cycles, wrong numbers tank connect rates, and stale data wastes the enablement content you worked so hard to build. Prospeo refreshes every 7 days - not 6 weeks - so your pipeline moves at the speed your OKRs demand.
Stop letting outdated data undermine your enablement investment.
FAQ
What are the three core enablement goals?
Decrease time to revenue, increase sales productivity, and create long-term customers. Every other enablement objective - ramp time, win rate, content adoption - ladders up to one of these three. Clari's framework is the cleanest way to organize your roadmap around them.
How do you measure enablement success?
Track three levels: adoption (content usage, training completion), behavior change (call quality, CRM adherence), and business impact (win rate, ramp time, deal size). Sales velocity is the master metric - it captures pipeline momentum in a single number by combining opportunities, deal size, win rate, and cycle length.
What KPIs should enablement track first?
Content adoption rate, new rep ramp time, and win rate. These three are directly influenceable by enablement and tie cleanly to revenue. Avoid starting with metrics you can't control, like total pipeline size. Once those stabilize, layer in sales velocity and content-influenced pipeline.
How does bad contact data undermine enablement ROI?
Even perfect enablement programs lose impact when reps hit 30%+ bounce rates - every bounced email wastes the training, content, and process investment behind it. Clean data keeps outbound sequences hitting real inboxes, so your enablement spend actually converts to pipeline instead of deliverability problems.