Sales KPIs and Performance Management: The Practitioner's Operating Manual
84% of sales reps missed quota last year. Average quota attainment across B2B sits at roughly 43%. Those numbers don't describe an effort problem - they describe a measurement and management failure. The wrong metrics tracked the wrong way, with no system for acting on any of them. Teams are tracking 25 KPIs in a dashboard nobody opens, running quarterly reviews that amount to a postmortem on deals already lost, and wondering why the number keeps slipping.
Stop adding KPIs. Start managing the five you have.
The Short Version
- 5 core KPIs: quota attainment (distribution analysis, not just the average), pipeline coverage ratio, win rate, sales cycle length, activity-to-opportunity conversion
- Build a scorecard per role - SDRs and AEs don't share metrics
- Review weekly, not monthly
- Align comp to the same five metrics - if it's not on the scorecard, it shouldn't drive commission
- Fix your data quality before optimizing anything else - every downstream metric is fiction if your contact data is wrong
Fewer KPIs managed well beats 30 KPIs tracked passively. Every time.
What Is Sales Performance Management?
Sales performance management isn't a dashboard. It's not a KPI list. It's the operating system that connects goal-setting, quota and territory management, incentive design, coaching, and real-time analytics into a single integrated system.
Think of it this way: KPIs are the instruments on the cockpit panel. SPM is the flight plan, the autopilot logic, the crew training, and the maintenance schedule. You can have perfect instruments and still crash if nobody's flying the plane.
Most "sales KPI" articles stop at the instrument panel - 20 metrics and zero system for acting on them. Companies with structured SPM frameworks outperform peers by up to 20% in revenue growth. That gap doesn't come from tracking more numbers. It comes from building the system around them.
The KPIs That Actually Drive Revenue
Revenue and Pipeline Metrics
Quota attainment is the headline metric, but the headline lies. If your team averages 85% attainment but the median is 62%, you've got two reps carrying the org and eight treading water. Always look at the distribution - median vs. mean, quartile breakdown, percentage of reps at or above 100%.
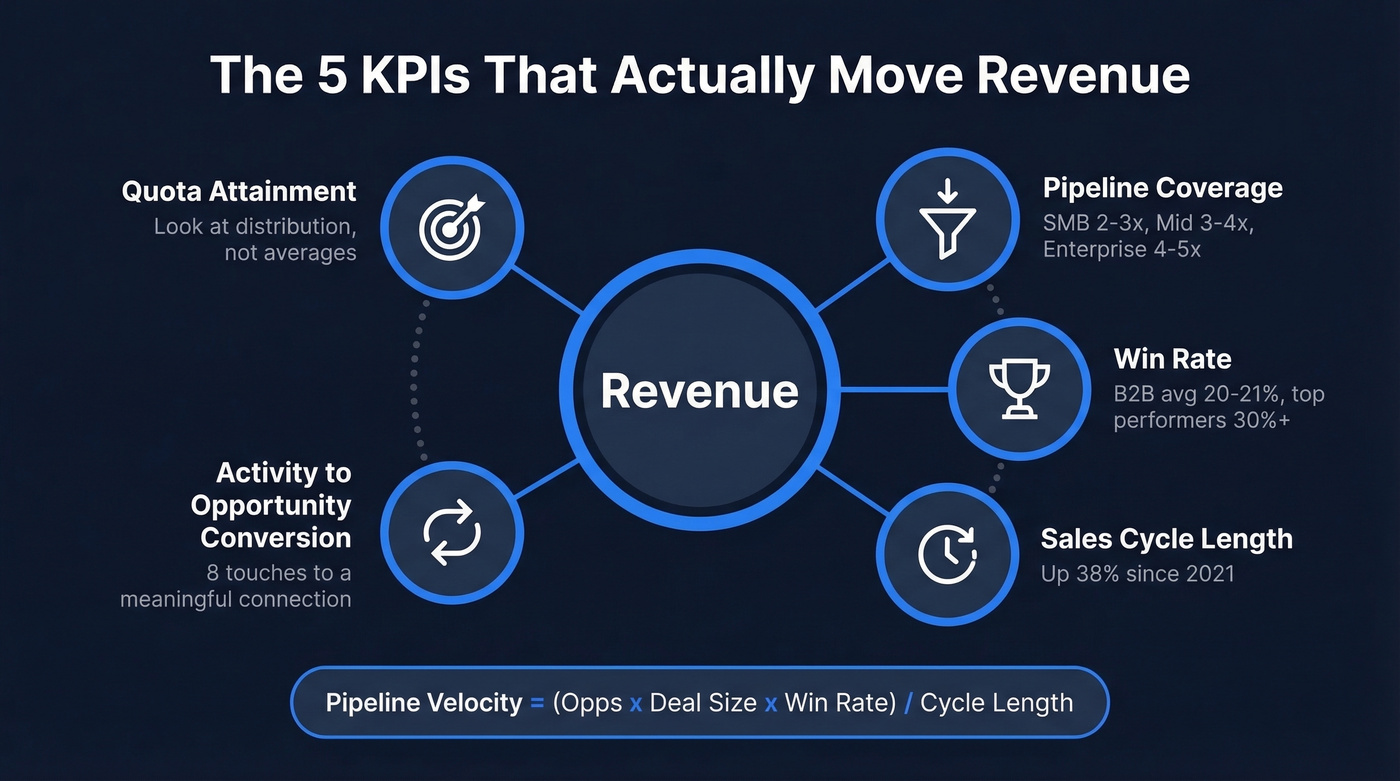
Pipeline coverage needs segmenting. The generic "3-4x" rule is a starting point, not a strategy. SMB deals close faster and need less buffer: 2-3x works. Mid-market teams should target 3-4x. Enterprise, where cycles stretch longer and deals die quietly, often needs 4-5x.
Win rate averages 20-21% in B2B, with top performers hitting 30%+. If yours is below 15%, the problem is pipeline quality and qualification - not closing skills. Adding more leads into a broken funnel just creates more waste (see sales pipeline challenges).
Pipeline velocity ties it together: (Opportunities x Average Deal Size x Win Rate) / Sales Cycle Length. This single formula tells you how fast money moves through your funnel (and how to diagnose pipeline health when it doesn’t).
Activity and Productivity Metrics
Calls made, emails sent, meetings booked, demos delivered. These are the leading indicators that tell you whether pipeline will exist in 60 days. The common heuristic is roughly 8 touches before a meaningful connection.
Reps spend only about a third of their time actually selling. The rest disappears into CRM updates, internal meetings, and admin. Automation saves up to 20% of a rep's time weekly - so activity KPIs should measure productive selling time, not busywork (use a clear list of sales activities examples to standardize what “productive” means).
Here's the thing, though: activity metrics without data quality are vanity metrics. If 35% of your emails bounce and half your phone numbers are disconnected, "500 emails sent" measures waste, not effort (see email bounce rate).
Forecast Accuracy Metrics
WAPE (Weighted Absolute Percentage Error) is the formula that matters:
WAPE = Sum of |Forecast - Actual| / Sum of Actual
Worked example: three regions forecast $500K, $300K, and $200K. Actuals come in at $450K, $350K, and $150K. Absolute errors: $50K + $50K + $50K = $150K. Total actual = $950K. WAPE = $150K / $950K = 15.8%. Forecast accuracy = 84.2%.
Forecast bias reveals whether you're consistently optimistic or conservative: Sum of (Forecast - Actual) / Sum of Actual. Same example: net error = +$50K - $50K + $50K = +$50K. Bias = +5.3% - a slight optimistic lean. Track this quarterly and you'll spot sandbagging or happy-ears patterns before they cost you (and align definitions across sales forecasting solutions).
Customer and Retention Metrics
Churn rate, NPS, LTV:CAC ratio, and net revenue retention complete the diagnostic. Average customer retention runs about 75%, varying from 55% to 84% depending on industry. Net revenue retention above 100% means your existing base is growing without new logos - below 90% and you're filling a leaky bucket. LTV:CAC above 3:1 is healthy; below 2:1 and your unit economics don't work (see churn analysis).
2026 Benchmark Table
Overall B2B quota attainment averages ~43%. Use these segment-level benchmarks as diagnostic thresholds, not targets - your ACV will shift the goalposts.
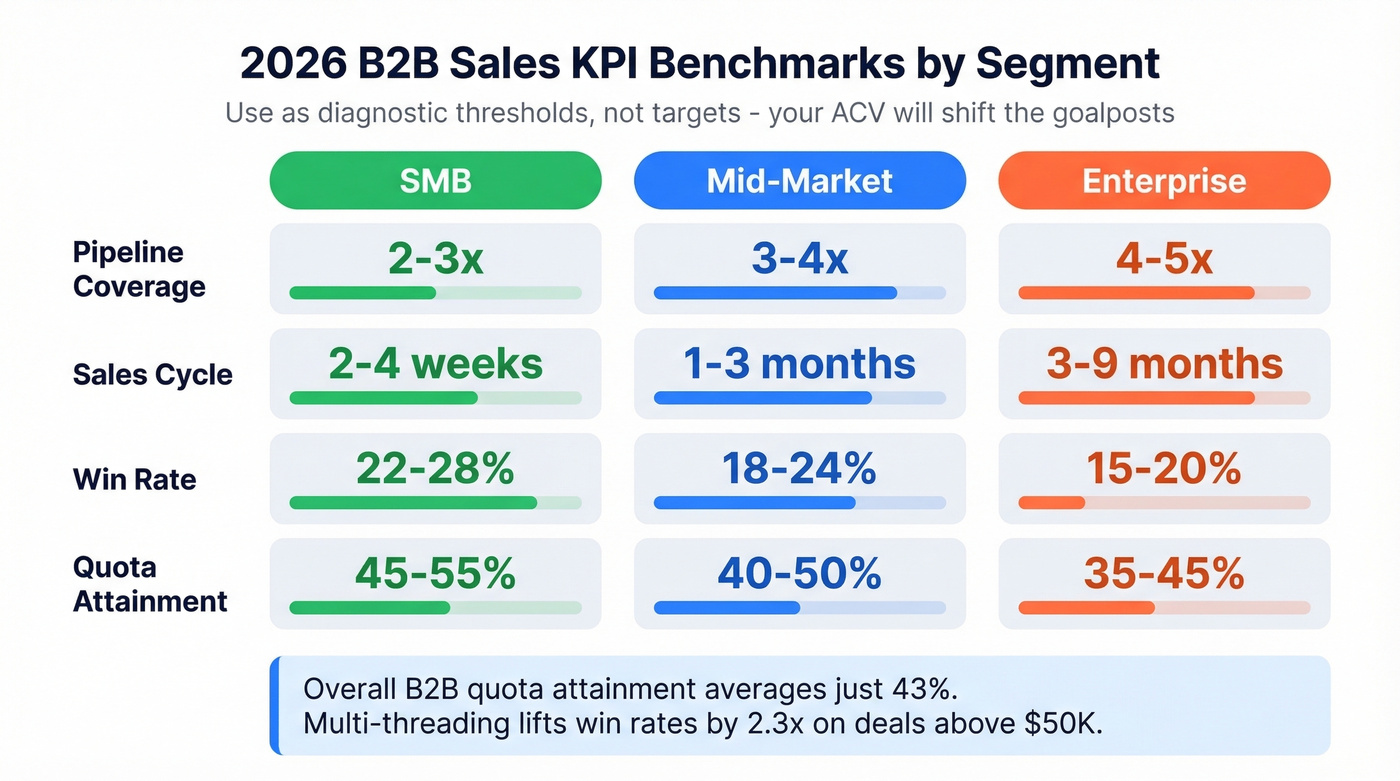
| KPI | SMB | Mid-Market | Enterprise |
|---|---|---|---|
| Pipeline Coverage | 2-3x | 3-4x | 4-5x |
| Sales Cycle | 2-4 weeks | 1-3 months | 3-9 months (6-12+ for $100K+ deals) |
| Win Rate | 22-28% | 18-24% | 15-20% |
| Quota Attainment | ~45-55% | ~40-50% | ~35-45% |
Cross-segment benchmarks worth pinning to your wall:
| Metric | Benchmark |
|---|---|
| Avg B2B Win Rate | 20-21% (top: 30%+) |
| Lead-to-Customer | 2-5% |
| Cycle Elongation | +38% vs 2021 |
| Multi-Thread Lift | ~2x contacts on won vs lost deals |
| Multi-Thread (>$50K) | Win rates 2.3x higher |
The multi-threading data is striking. Analysis across 1.8M opportunities shows closed-won deals have roughly double the buyer contacts of lost deals. On deals above $50K, multi-threading lifts win rates by 2.3x. If you're not tracking stakeholder coverage as a KPI, you're leaving the most actionable signal on the table (this is a core motion in account-based selling best practices).
Role-Based KPI Scorecards
One scorecard doesn't fit all roles. We've seen this firsthand - the moment teams split their metrics by role, coaching conversations get sharper and behavior actually changes.
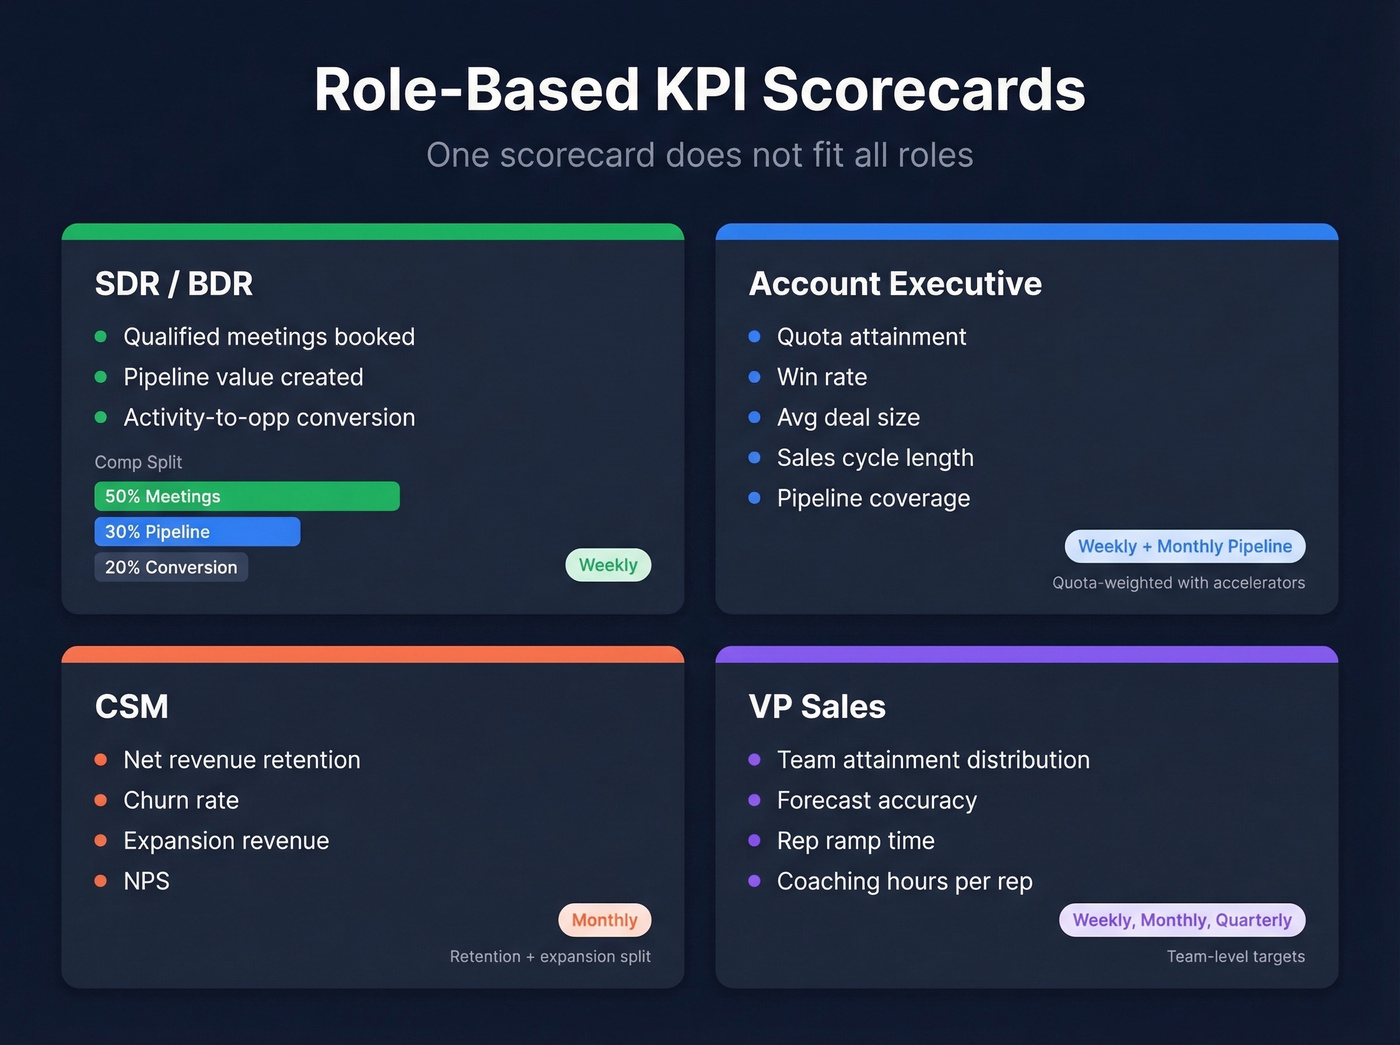
| Role | Primary KPIs | Review Cadence | Comp Weight |
|---|---|---|---|
| SDR/BDR | Qualified meetings, pipeline value created, activity-to-opp conversion | Weekly | 50% meetings, 30% pipeline, 20% conversion |
| AE | Quota attainment, win rate, avg deal size, cycle length, coverage | Weekly + monthly pipeline | Quota-weighted with accelerators |
| CSM | Net revenue retention, churn, expansion revenue, NPS | Monthly | Retention + expansion split |
| VP Sales | Team attainment distribution, forecast accuracy, ramp time, coaching hours | Weekly 1:1s, monthly pipeline, quarterly QBR | Team-level targets |
SDR / BDR
Qualified meetings booked, pipeline value created, and activity-to-opportunity conversion. That's it. Calls and emails are inputs, not outcomes - track them for coaching, but don't comp on them. An SDR booking 15 qualified meetings from 200 calls is outperforming one booking 8 from 400 (and should be supported with modern SDR tools).
Account Executive: The Common Mistake
Most orgs evaluate AEs on quota attainment alone. That's like judging a pilot by whether the plane landed - it ignores everything that happened in the air. The five AE metrics that matter: quota attainment, win rate, average deal size, sales cycle length, and pipeline coverage. Drop any one and you lose visibility into whether the rep is building a sustainable book or riding one whale deal (tie this back to sales process optimization).
Customer Success Manager
CSMs who only track churn are playing defense. Expansion revenue is the offensive metric that separates good CS teams from great ones. A CSM with 95% retention but zero expansion is costing you growth. Net revenue retention, churn rate, expansion revenue, and NPS - all four belong on the scorecard.
Sales Manager / VP Sales
The VP scorecard is the only one where distribution matters more than averages. If team attainment averages 90% but the standard deviation is huge, you have a coaching problem, not a celebration. Track team quota attainment distribution, forecast accuracy, rep ramp time, and coaching hours per rep. Single account ownership boosts ACVs by 40% compared to hunter-farmer models - another reason territory design belongs on the VP scorecard (see sales leadership).
You just read it: activity metrics without data quality are vanity metrics. If a third of your emails bounce and half your dials hit dead numbers, every KPI downstream is noise. Prospeo delivers 98% email accuracy and 125M+ verified mobiles with a 30% pickup rate - refreshed every 7 days, not every 6 weeks.
Stop measuring waste. Start measuring real conversations.
How to Build a Sales Scorecard
A scorecard measures performance against goals over time - it's the coaching tool you bring to weekly 1:1s. A dashboard is a real-time snapshot for quick decisions. You need both, but the scorecard drives behavior change (especially when paired with data-driven selling).
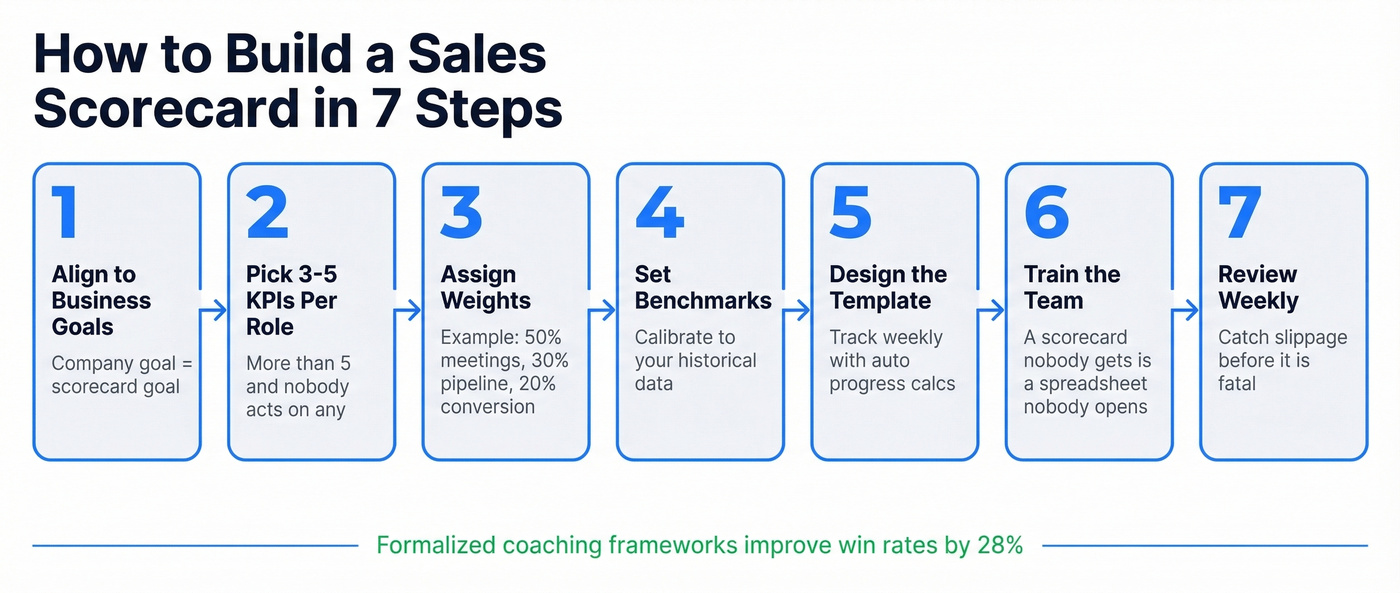
- Align to business goals - if the company goal is net revenue retention, the CSM scorecard better reflect that
- Choose 3-5 KPIs per role - more than five and nobody acts on any of them
- Assign weights - SDR example: 50% qualified meetings, 30% pipeline value, 20% activity-to-opp conversion
- Set benchmarks - use the table above as starting points, calibrate to your historical data
- Design the template - the Sales Enablement Collective's template tracks weekly calls, conversations, presentations, and deals with automatic progress-to-quarterly-target calculations
- Train the team - a scorecard nobody understands is a spreadsheet nobody opens
- Review weekly - quarterly targets with weekly pace-to-target tracking catches slippage before it's fatal
Turning KPIs Into a Management System
Coaching Cadence
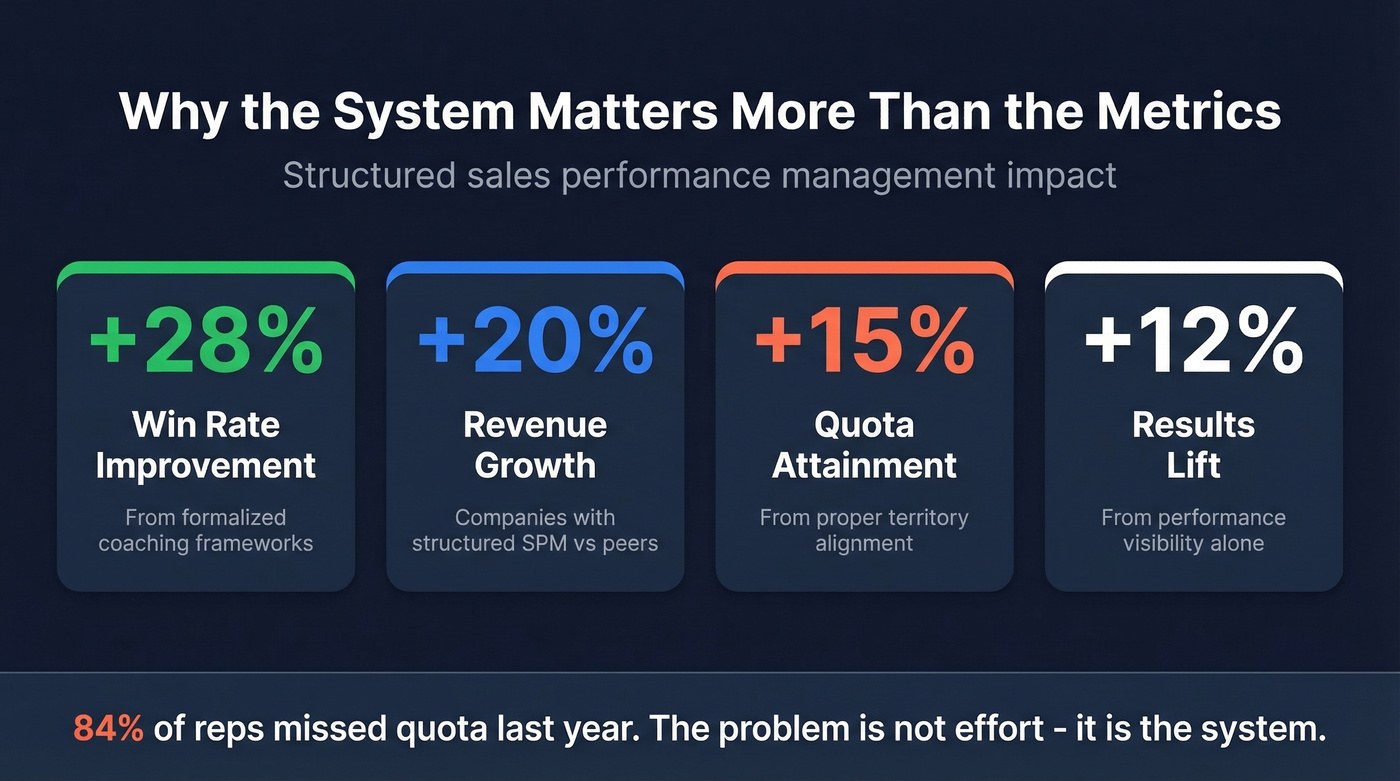
KPIs are useless without a system for acting on them. Formalized coaching frameworks improve win rates by 28%. Performance visibility alone lifts results by up to 12%. Territory alignment drives up to 15% higher quota attainment.
Weekly 1:1s should focus on the scorecard - where's the rep tracking, what deals need help, what skills need development. Monthly pipeline reviews zoom out to coverage and velocity. Quarterly QBRs address territory balance, comp alignment, and strategic shifts. Skip any of these three and you're managing by hope (use a consistent QBR meaning across the org).
Compensation Alignment
If a rep can't calculate their commission on a napkin, the plan is too complex. Simpler comp plans outperform complex ones because sellers actually understand what behavior drives their payout.
The perception data is ugly: 69% of sellers say their targets are inequitable, and 60% say quotas don't reflect territory potential. When the majority of your team believes the game is rigged, no amount of KPI tracking fixes motivation. Balance short-term and long-term metrics, individual and team goals, and make the math transparent.
Continuous Planning Over Annual Cycles
Annual quota-setting is dead. Markets shift quarterly, territories change when reps leave, and the macro environment in 2026 looks nothing like the assumptions made in December. Effective sales goal management means reviewing quotas quarterly, rebalancing territories when the data says to - not when the calendar says to - and treating the plan as a living document.
When KPIs Backfire
In colonial India, the British government offered a bounty for dead cobras. Enterprising locals started breeding cobras for the bounty. When the government canceled the program, breeders released their now-worthless snakes - making the problem worse.
That's the Cobra effect, and it plays out in sales organizations every quarter.
The UK's PPI scandal is the corporate version. Banks set aggressive sales targets for payment protection insurance. Reps hit those targets by mis-selling PPI to customers who didn't need it - one bank's PPI product carried a 98.5% profit margin. The eventual compensation costs exceeded 50 billion pounds. In sales, the same dynamics produce pipeline stuffing, sandbagging, and cherry-picking. Goodhart's Law applies: when a measure becomes a target, it ceases to be a good measure. Prevention requires balanced metrics that can't be gamed in isolation, regular pipeline quality audits, and real-time visibility so gaming gets caught early.
Data Quality: The Hidden KPI Killer
Let's be honest - sales teams often ask us how to set KPIs when they can't even trust their CRM data. The answer starts with data hygiene, not more metrics (start with data enrichment services if your CRM is missing fields).
In our experience, a rep sending 500 emails per week with a 35% bounce rate wastes 175 emails weekly. That compounds into domain reputation damage that tanks deliverability for the entire team. If your contact data is inaccurate, every downstream KPI is compromised. Activity metrics measure waste. Conversion rates are artificially deflated. You're optimizing a system built on fiction.
Prospeo's 98% email accuracy and 7-day refresh cycle - versus the 6-week industry average - solve this at the source. The 5-step verification process handles catch-all domains and strips spam traps before a single email leaves your sequencer. Snyk took their bounce rate from 35-40% down to under 5%, and AE-sourced pipeline jumped 180%.

Multi-threading lifts win rates 2.3x on deals above $50K, but only if you can actually reach every stakeholder. Prospeo's 300M+ profiles with 30+ filters - including department headcount, job changes, and buyer intent - let your AEs map and contact entire buying committees at $0.01 per email.
Build multi-threaded pipeline without burning your domain or your budget.
2026 Trends Reshaping Sales KPIs
The shift from growth-at-any-cost to repeatable, profitable growth is rewriting how teams think about SPM. Efficiency metrics - revenue per rep, CAC payback, net revenue retention - are replacing vanity volume metrics at the board level. By 2026, 65% of B2B sales orgs will outpace gut-instinct peers by using data-driven strategies.
I'll say it plainly: if your average deal size is under $10K, you probably don't need 25 KPIs and an enterprise SPM platform. You need five metrics on a spreadsheet, a weekly review cadence, and clean data. The complexity fetish in sales ops is costing mid-market teams more than it helps them.
AI is moving beyond payout automation into scenario modeling - testing quota allocations, simulating territory designs, and stress-testing incentive structures before they go live. About 40% of sales professionals already use AI alongside SPM tools for compensation decisions. Multi-threading is becoming a trackable, coachable KPI, and the consensus on r/sales is that teams tracking stakeholder coverage per deal are seeing measurably better close rates. Leading teams operate with roughly 3 customer segments versus 2 or fewer for lower performers - segmentation sophistication is becoming a leading indicator of sales maturity.
Skip the enterprise SPM platform if you're under 20 reps. A well-maintained spreadsheet scorecard with weekly reviews will outperform a six-figure tool that nobody configures properly.
FAQ
What are the five most important sales KPIs?
Quota attainment with distribution analysis, pipeline coverage ratio, win rate, sales cycle length, and activity-to-opportunity conversion. These five give you revenue health, pipeline health, efficiency, velocity, and leading-indicator signal - everything a sales leader needs to diagnose and act.
How many KPIs should a sales team track?
Three to five per role, maximum. SDRs need different metrics than AEs, and managers need team-level distribution data rather than individual activity counts. More than five per role and nobody acts on any of them.
What's a good win rate in B2B sales?
Average B2B win rate is 20-21%, with top performers hitting 30%+. Below 15% signals a pipeline quality or qualification problem.
How often should you review sales KPIs?
Activity KPIs weekly, pipeline and conversion metrics monthly, revenue and forecast accuracy quarterly. Weekly scorecard reviews in 1:1s catch slippage before it compounds. Skip the weekly cadence and problems snowball into missed quarters.
How does data quality affect sales performance management?
Bad contact data poisons every downstream metric. A 35% email bounce rate wastes rep time, damages domain reputation, and artificially deflates conversion rates. Fixing data at the source - through verified contact databases with frequent refresh cycles - is the prerequisite for trustworthy KPIs.