The Sales Strategy Template That Actually Gets Used
It's Friday afternoon in December. You've got a blank Google Doc, a Slack message from your VP asking for "the Q1 sales strategy by Monday," and a cursor blinking at you like it's judging your life choices. You don't need another blank doc - you need a sales strategy template with structure, numbers, and pipeline math already baked in.
The consensus on r/sales is telling: the hard part isn't coming up with strategy ideas. It's structuring the document so you know what goes where and the math actually holds up.
The template below is a working framework we've used and refined across dozens of planning cycles. Filled-in numbers, funnel benchmarks, pipeline coverage formulas - adapt it in 30 minutes and move on with your weekend.
What You Need (Quick Version)
- A living document, not a PDF. Use Sheets, Notion, or your CRM - something you'll actually update weekly.
- Filled-in benchmarks for your business type - SMB, mid-market, or enterprise. Jump to benchmarks.
- Pipeline coverage math so your quota targets aren't wishful thinking. See the calculator.
- A 30/60/90 onboarding variant for new reps or new territories. Get the phases.
- A data layer that ensures your activity targets reflect reality, not fantasy contact lists.
What a Sales Strategy Template Actually Is
A sales forecast projects what will happen based on your current pipeline. A strategy template defines the steps, activities, and resources needed to make it happen. The forecast validates whether your plan's math works. You need both. (If you need a deeper breakdown, see sales forecast vs sales goal.)
Aberdeen Research found that 42% of best-in-class companies use structured sales playbooks, compared to just 14% of laggards. The gap isn't talent - it's structure. And here's the thing: static PDFs are a planning antipattern. If your strategy can't be updated in real time, it's not a strategy. It's a wish list with formatting.
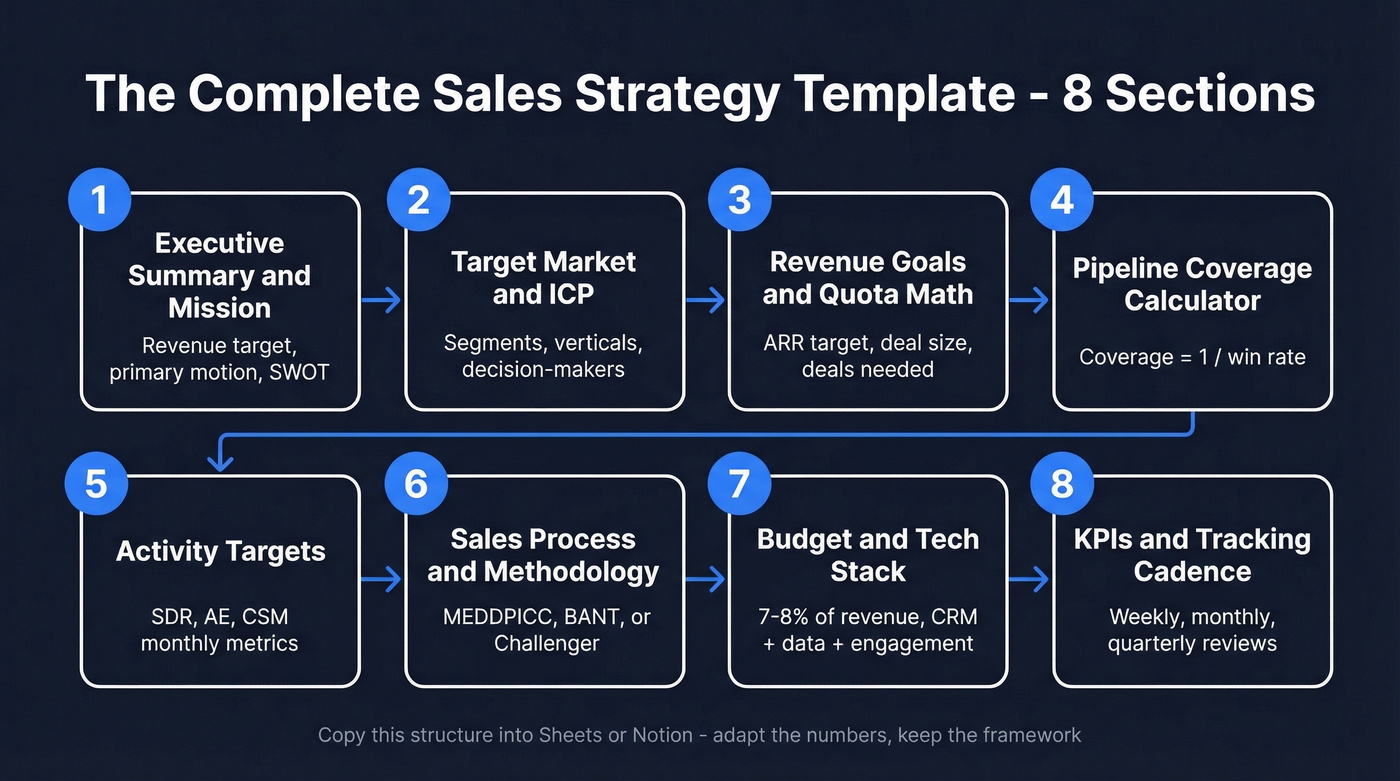
The Complete Template: Eight Sections
Eight sections. Each includes the fields you need and a filled-in example. Copy this structure into your Sheets or Notion workspace and adapt the numbers - the structure stays the same regardless of your segment or deal size.
Executive Summary & Mission
Your one-paragraph anchor. What does your team sell, to whom, and what's the revenue target? Run a SWOT analysis - not just for your business, but for your top 5 accounts. Everything else flows from this.
| Field | Example |
|---|---|
| Mission | Grow new business ARR by 60% in FY2026 |
| Primary motion | Outbound + partner-sourced pipeline |
| Revenue target | $3.2M new ARR |
Target Market & ICP
Define who you're selling to before you define how. SMBs are typically under 100 employees, buying fast with fewer stakeholders. Mid-market runs 100-1,000 employees with $50M-$1B revenue. Enterprise is everything above - longer cycles, bigger committees, more procurement headaches. (If you want a plug-and-play doc for this, use an ideal customer profile template.)
| Field | Example |
|---|---|
| Primary segment | Mid-market SaaS (100-500 employees) |
| Key verticals | FinTech, HealthTech, Cybersecurity |
| Decision-maker titles | VP Sales, CRO, Head of RevOps |
| Disqualifiers | Under 50 employees, no outbound motion |
Revenue Goals & Quota Math
Start with the number, then work backward. If your target is $1M, plan for $1.2M-$1.3M to absorb slippage - that buffer has saved more plans than any fancy framework. Average quota attainment sits at 43% in 2026, which means most reps won't hit 100%. Build that reality into your model or you're lying to yourself on a spreadsheet.
| Field | Example |
|---|---|
| Annual ARR target | $3.2M |
| Avg deal size | $18K |
| Deals needed | 178 |
| Pipeline coverage | 3x ($9.6M) |
Pipeline Coverage Calculator
The formula is simple: coverage = 1 / win rate. Close 25% of qualified opportunities? You need 4x pipeline coverage. (To sanity-check your numbers, compare against sales pipeline benchmarks.)
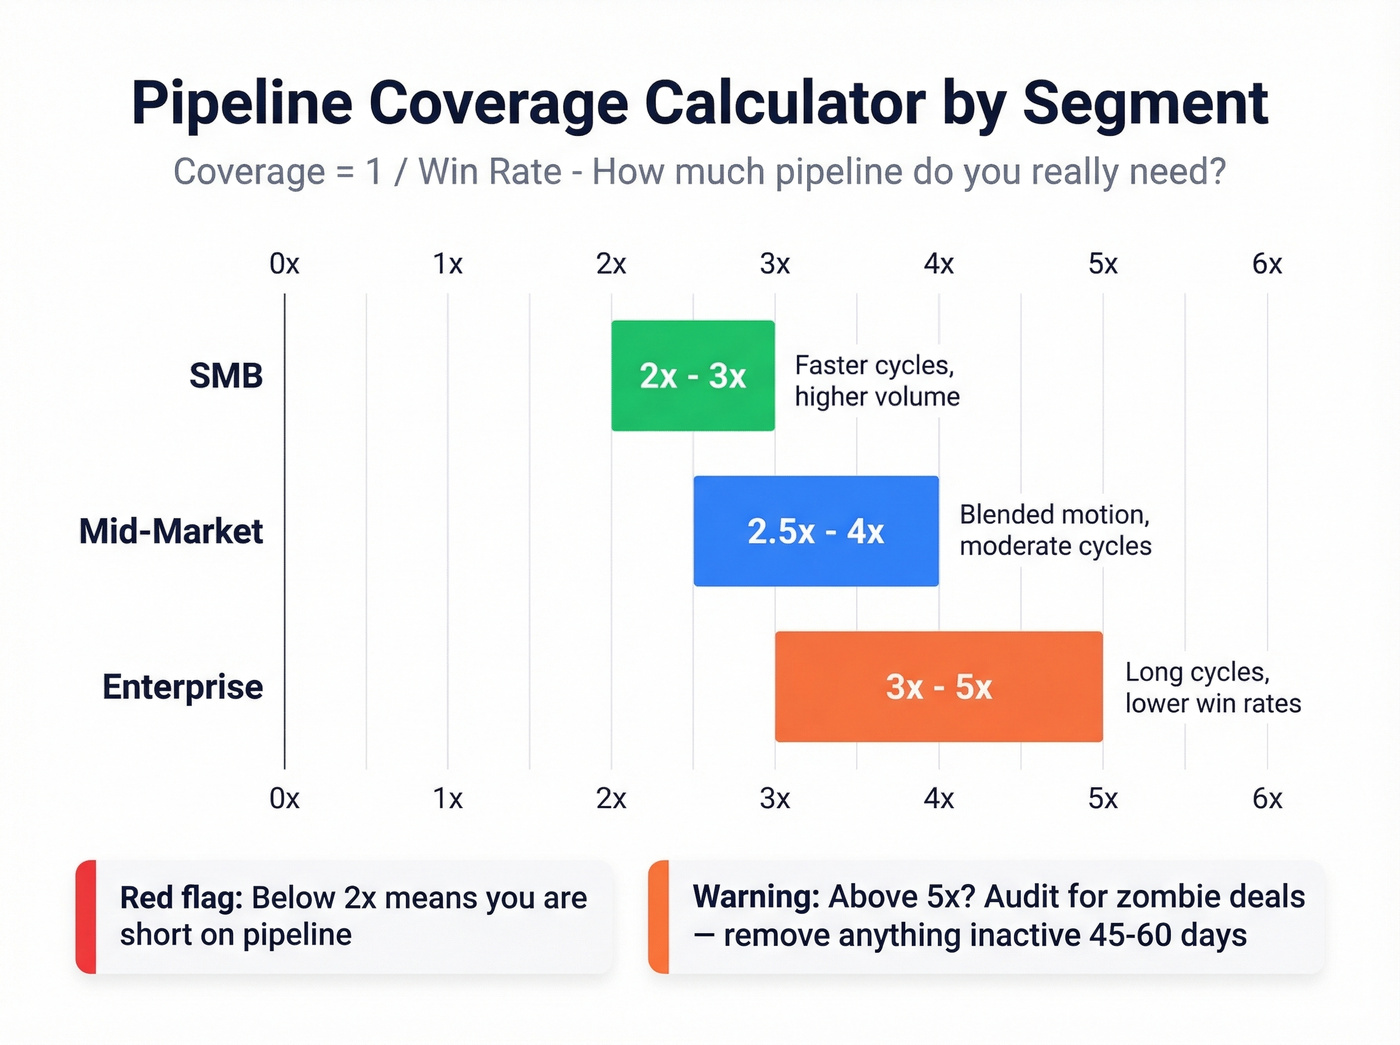
- Enterprise: 3x-5x coverage (longer cycles, lower win rates)
- Mid-market: 2.5x-4x coverage
- SMB: 2x-3x coverage (faster cycles, higher volume)
Anything below 2x is a red flag. Anything above 5x probably means zombie deals are inflating your pipeline - remove anything inactive for 45-60 days and see what's really there. (More on this in pipeline health.)
Activity Targets
This is where most templates fall apart. People set activity numbers without checking whether they're mathematically possible given their conversion rates and available selling time. Cold email reply rates run 1-5%. 80% of deals require 5+ touches, yet 44% of reps give up after one. Multichannel outreach - email, phone, and social - increases response rates by 287% versus single-channel. If you need a starting point, borrow these sales activities examples.
| Role | Monthly target | Key metric |
|---|---|---|
| SDR | 100 qualified leads, 50 discovery calls | 15 meetings booked |
| AE | 5 new accounts closed | 60-day avg cycle |
| CSM | 95% retention | 20% expansion ARR |
Sales Process & Methodology
Pick one methodology and commit. MEDDPICC for enterprise, BANT for transactional, Challenger for complex sales. Map each stage to your CRM pipeline stages so reps know exactly what "Stage 3" means - not "kind of interested, maybe." (If your stages are messy, start with sales process optimization.)
Budget & Tech Stack
Businesses under $5M in revenue should allocate 7-8% of gross revenue to sales and marketing. Most spend 3-4% and wonder why pipeline is thin. Budget $75-250/rep/month for SMB teams, $250-600/rep/month for enterprise. At minimum you need three things: a CRM, a prospecting data tool for verified contacts, and a sales engagement platform. (If you're evaluating options, see examples of a CRM and implementing a sales engagement platform.)
KPIs & Tracking Cadence
Track weekly, review monthly, adjust quarterly. Use a 12-month tracking structure with separate rows for each product line, columns for previous year performance, current goals, and actual outcomes. (For a tighter KPI set, use these sales operations metrics.)
| Cadence | What you review |
|---|---|
| Weekly | Pipeline movement, activity volume |
| Monthly | Win rate, avg deal size, cycle length |
| Quarterly | Strategy adjustments, ICP refinement |
Benchmark Your Funnel Assumptions
Your activity targets are only as good as your conversion assumptions. Here are real funnel benchmarks from First Page Sage:
| Stage | B2B SaaS | Cybersecurity |
|---|---|---|
| Lead to MQL | 39% | 24% |
| MQL to SQL | 38% | 40% |
| SQL to Opp | 42% | 43% |
| SQL to Closed | 37% | 46% |
If your assumptions are wildly different from these, either you've got a genuinely unique business or your data is wrong. Pressure-test it before you build a whole quarter around it.
Here's the variable most teams ignore: reps spend just 28% of their time actually selling. The rest is admin, data entry, and chasing bad contact info. Your activity targets also assume your contact data is accurate - and if your list is bouncing at 35%+, your funnel math is fiction. You're planning around phantom pipeline. In our experience, fixing the data layer alone changes everything downstream, because suddenly the activity numbers you planned for actually produce the conversations you expected. (If bounce is a recurring issue, start with email bounce rate.)

Your funnel math assumes your contact data is accurate. If your list bounces at 35%+, every activity target in your sales strategy template is fiction. Prospeo delivers 98% email accuracy with a 7-day refresh cycle - so the pipeline coverage numbers you planned actually produce real conversations.
Stop building quarterly plans on phantom pipeline.
Customize by Business Type
One template doesn't fit all. The math changes dramatically based on who you're selling to.
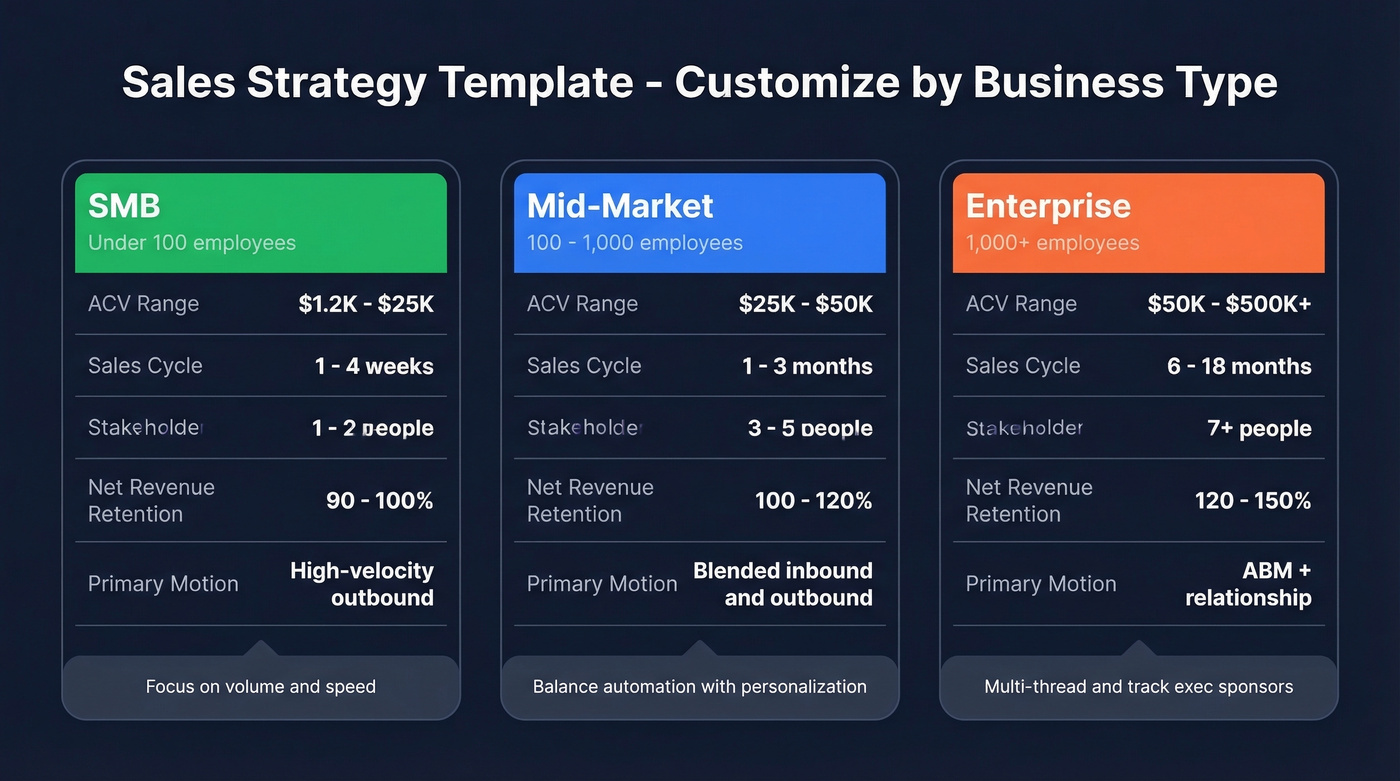
| Dimension | SMB | Mid-Market | Enterprise |
|---|---|---|---|
| ACV range | $1.2K-$25K | $25K-$50K | $50K-$500K+ |
| Sales cycle | 1-4 weeks | 1-3 months | 6-18 months |
| Stakeholders | 1-2 | 3-5 | 7.2 avg |
| Net revenue retention | 90-100% | 100-120% | 120-150% |
| Primary motion | High-velocity outbound | Blended inbound/outbound | ABM + relationship |
Small businesses represent 99.9% of all firms in the US. If you're selling to SMBs, your template should emphasize volume and speed. Enterprise templates need multi-threading strategies, executive sponsor tracking, and procurement timeline fields. Trying to use the same template for both is a strategic mistake that we've watched teams make over and over. (For enterprise-specific motions, see enterprise B2B sales.)
Let's be honest: if your average deal closes under $10K, you don't need a 15-page sales strategy. You need a one-page activity plan, a tight ICP definition, and verified contact data. Overplanning kills SMB velocity faster than underplanning does. Skip the elaborate document and focus on execution speed.
The 30/60/90-Day Sales Plan
Every new rep or new territory needs a ramp plan. Here's a three-phase structure that works. (If you want a full version, use this 30-60-90 day plan for sales reps.)
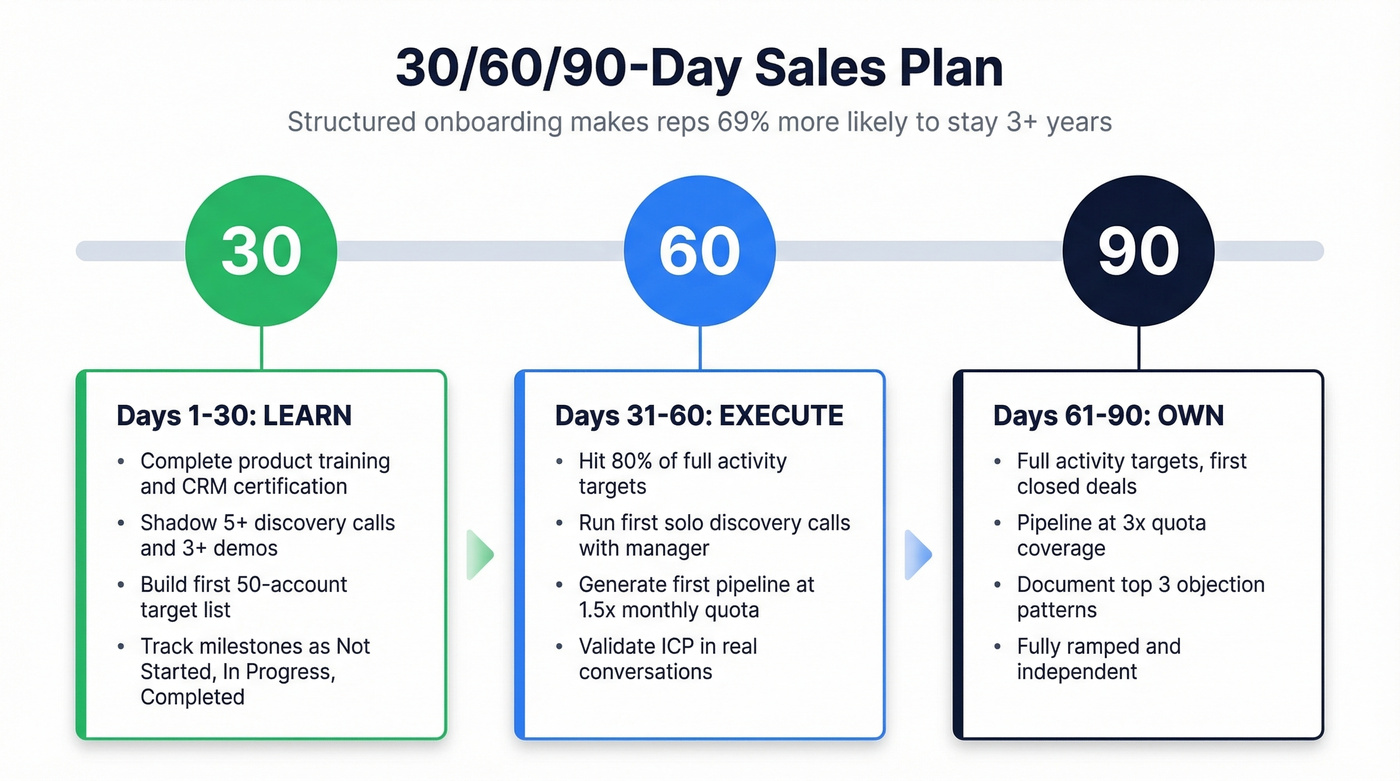
Days 1-30: Learn. Complete product training and CRM certification. Shadow 5+ discovery calls and 3+ demos. Build your first 50-account target list. Track each milestone as Not Started, In Progress, or Completed.
Days 31-60: Execute. Hit 80% of full activity targets. Run first solo discovery calls with manager observation. Generate first pipeline - target 1.5x monthly quota. This is where you find out whether your ICP definition actually holds up in real conversations.
Days 61-90: Own. Full activity targets, first closed deals. Pipeline at 3x quota coverage. Identify and document your top 3 objection patterns so the next hire doesn't start from zero.
This matters more than most leaders realize. Reps who go through structured onboarding are 69% more likely to stay 3+ years. A 30/60/90 template isn't optional - it's retention infrastructure.
Five Mistakes That Kill Sales Plans
1. Planning for 12 months of selling. You don't have 12 months. Between holidays, vacations, and Q4 chaos, you've got about 10 months of real selling time. Plan for $1.2M to hit $1M.
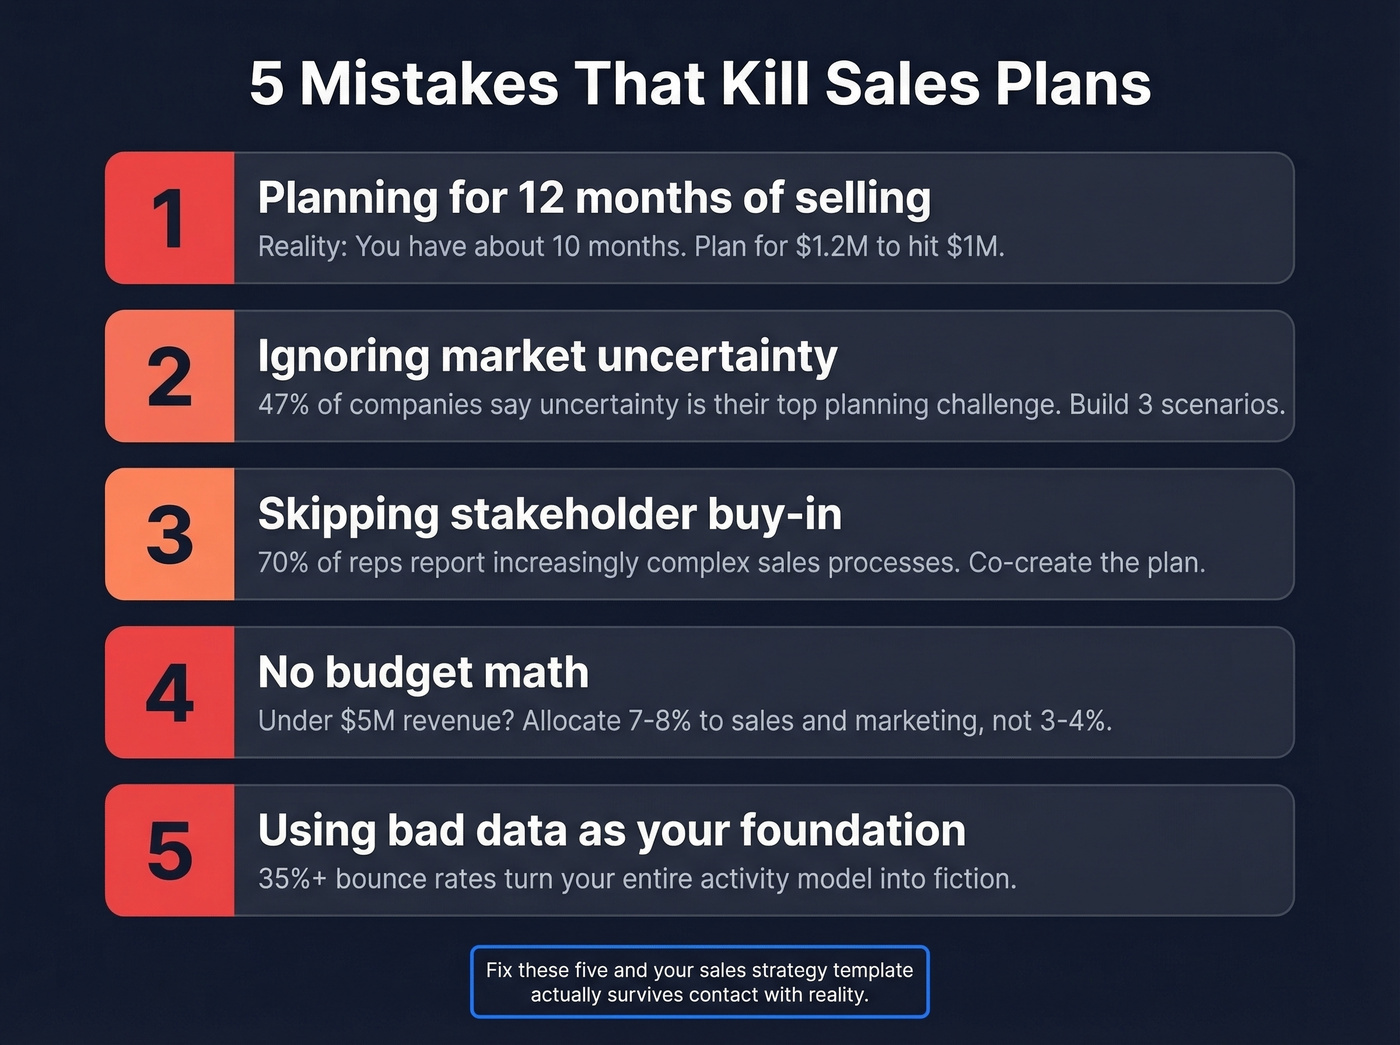
2. Ignoring market uncertainty. 47% of companies say market uncertainty is their top planning challenge. Build scenario plans - best case, base case, worst case - not a single optimistic line that crumbles the moment a deal slips.
3. Skipping stakeholder buy-in. A plan your VP wrote alone and emailed out isn't a plan - it's a memo. Co-create it with the team executing it. 70% of reps report increasingly complex sales processes, and a plan nobody helped build won't survive that complexity.
4. No budget math. If you're under $5M in revenue, allocate 7-8% of gross revenue to sales and marketing. Most companies spend 3-4% and then blame the reps when pipeline is thin. That's not a strategy problem. It's a math problem.
5. Using bad data as your foundation. Your entire activity model - calls, emails, meetings - assumes you can actually reach the people on your list. We've seen teams build beautiful plans on top of contact databases with 35%+ bounce rates. The plan looked great on a slide. The results didn't look great anywhere. Tools like Prospeo verify emails in real time at 98% accuracy with a 7-day refresh cycle, which means the contacts feeding your activity model are actually reachable.
How to Present Your Plan
A scenario we see constantly: you're the top-performing SDR, and your director asks you to present your Q1 strategy to the team. Your instinct is "I'll just keep doing what I've been doing." That's not a presentation - it's a shrug.
Five slides, one key point each:
- Slide 1: Results. Last quarter's numbers. Lead with what happened.
- Slide 2: What worked. Two or three specific plays that drove results.
- Slide 3: What's changing. Market shifts, new segments, process tweaks.
- Slide 4: Targets. Revenue, pipeline, activity numbers with the math behind them.
- Slide 5: Asks. What you need from leadership - budget, headcount, tools, air cover.
Your audience doesn't want a data dump. They want confidence that you've thought this through. 37% of employees want more visibility into company goals - your presentation is a chance to give them exactly that.
Reps spend 28% of their time selling - the rest is admin and chasing bad data. Prospeo gives your team 300M+ verified profiles with 30+ filters for ICP targeting, so the activity targets in your strategy template translate to booked meetings, not bounced emails.
Teams using Prospeo book 35% more meetings than Apollo users.
FAQ
How often should I update my sales strategy?
Review pipeline weekly, check KPIs monthly, and adjust the full strategy quarterly. A plan downloaded as a PDF in January and never touched again is worse than no plan at all. Keep it in Sheets, Notion, or your CRM - somewhere the team actually opens every week.
What's the difference between a sales plan and a sales forecast?
A forecast projects outcomes based on current pipeline and historical conversion rates. A plan defines the steps, activities, and resources needed to hit that forecast. You need both - the forecast is your reality check that tells you whether your plan's math actually works.
What tools do I need to execute a sales plan?
At minimum: a CRM like HubSpot or Salesforce, a prospecting data tool for verified contacts, and a sales engagement platform for sequences. Budget $75-250/rep/month for SMB teams, $250-600/rep/month for enterprise. Three tools used well beat six used poorly.
How much pipeline coverage do I need?
Use the formula: coverage = 1 / win rate. If you close 25% of qualified opportunities, you need 4x coverage. Enterprise teams typically need 3x-5x, mid-market 2.5x-4x, and SMB 2x-3x. Anything below 2x is a red flag regardless of segment.