TAM in Marketing: What It Is & How to Use It (2026)
Four hundred and thirty-one VC-backed startups have shut down since 2023, after raising a combined $17.5B, according to CB Insights: https://www.cbinsights.com/research/startup-failure-reasons-top/. Running out of cash shows up the most (70%), but the more useful signal is product-market fit problems, which appear in 43% of post-mortems.
And product-market fit starts with a question marketing teams hate because it forces hard choices: how big is the market, really?
That's where TAM in marketing comes in. It's also where a lot of teams quietly botch the math, then spend six months "testing channels" in a segment that was never viable.
What you actually need (quick version)
- TAM is the ceiling, not the plan. It's the total revenue if you owned 100% of the market. Great for direction. Bad for campaign planning.
- SAM and SOM are where marketing lives. SAM is where you can play. SOM is what you can win with your current product, budget, and distribution.
- If you can't turn SOM into a list of real accounts, you're not done. A market size that can't become targeting criteria is just a slide.
Let's break this down the way a working marketing team uses it.
What TAM means in marketing
TAM (Total Addressable Market) is the total revenue opportunity available if your product captured 100% market share. It's the whole pie.
Investors use TAM to answer, "Is this market big enough to build a venture-scale company?" Marketers use TAM to answer, "What's the universe we're operating in, and how do we carve it up into segments we can actually reach?" Same number, different job.
One caveat that saves a lot of pain: TAM isn't a forecast. It's context. Treat it like the map, not the GPS.
If you want a clean explanation of the core approaches, this is still one of the better write-ups: https://www.forentrepreneurs.com/calculating-tam/
TAM vs. SAM vs. SOM
Think nesting dolls: each layer narrows from "everyone" to "the accounts we can close."
| Term | Definition | Marketing use | Example (WeWork) |
|---|---|---|---|
| TAM | Total market revenue at 100% share | Vision, board-level sizing | $1.35T |
| SAM | Portion reachable with your product + distribution | Segment and channel strategy | $168B (12.4% of TAM) |
| SOM | Portion you can realistically capture | Pipeline targets and capacity planning | $33.8B (2.6% of TAM) |
The WeWork example is a good illustration of the drop-off from big headline number to usable planning number: https://www.toptal.com/management-consultants/market-sizing/total-addressable-market-example
Here's how we use the layers in practice:
- TAM keeps leadership honest about the long-term ceiling.
- SAM forces marketing to pick segments and channels based on reachability.
- SOM forces sales and marketing to agree on what can be won with current constraints.
If those three numbers aren't connected, teams end up arguing in circles: marketing says "the market's huge," finance says "prove ROI," sales says "these leads are trash," and nobody can point to the same model.
How to calculate TAM (three methods)
There are three common ways to calculate total addressable market. Each has a place. Two of them get abused constantly.
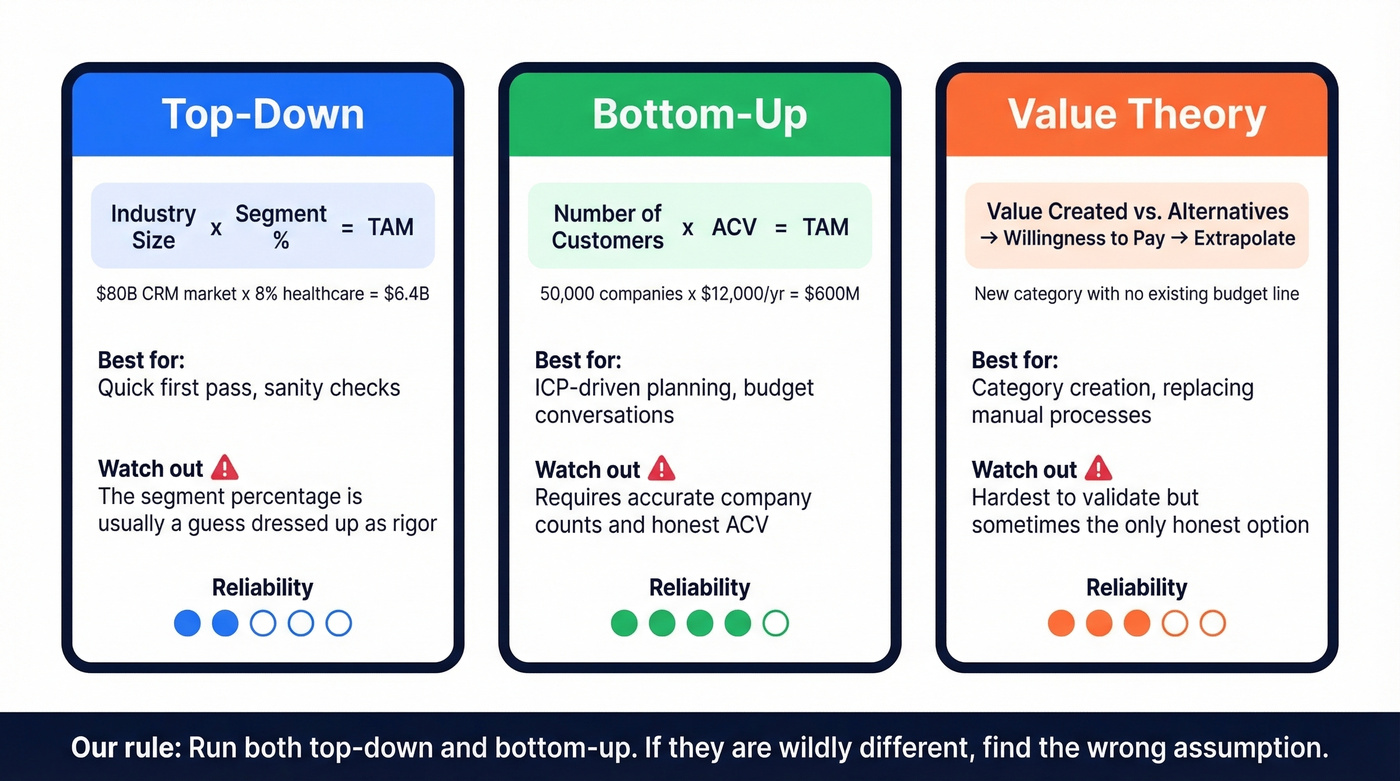
1) Top-down TAM
Formula: Industry size × your segment percentage = TAM
You start with a published market size, then apply a percentage for your segment. Example: if the total CRM market is $80B and you sell CRM only for healthcare, you might estimate healthcare is 8% of that. TAM = $6.4B.
This is fast. It's also the easiest way to lie to yourself, because the "8%" is usually a guess dressed up as rigor.
Use top-down for a first pass, or to sanity-check your bottom-up number. Don't use it as your only method.
2) Bottom-up TAM (the marketer default)
Formula: Number of potential customers × annual contract value (ACV) = TAM
This is the method we see the best marketing teams rely on, because it forces you to define the ICP in operational terms.
Worked example: you sell project management software to mid-market companies (200-2,000 employees) in North America. You estimate 50,000 companies match that profile. Your ACV is $12,000/year.
TAM = 50,000 × $12,000 = $600M.
Real life gets messier, and that's good. You might weight segments instead of treating them as binary. Maybe 200-500 employee companies are a perfect fit, 500-2,000 are a partial fit, and certain industries churn faster. When you build those weights into the model, the output stops being "impressive" and starts being usable for planning, targeting, and budget conversations.
Bottom-up TAM is credible because it makes you show your work.
3) Value theory TAM (for new categories)
Formula: Value created vs. current alternatives → willingness-to-pay → extrapolate across the market
Use this when you're creating a category or replacing a process that doesn't have a clean budget line yet. In those cases, top-down reports won't map to what you're selling, and bottom-up counts can be misleading because the buyer definition is still forming.
This approach is harder, but it's often the only honest option early on.
Our rule: run both top-down and bottom-up. If they're wildly different, don't pick the bigger one. Go find the assumption that's wrong.
You just built a bottom-up TAM using account counts and ACV. Now you need the actual companies and contacts. Prospeo's database has 300M+ profiles with 30+ filters - industry, headcount, revenue, tech stack, funding stage - so your SOM becomes a prospect list, not a slide.
Turn your market sizing into a named account list in minutes.
How marketers turn TAM into action
Most TAM content stops at definitions and formulas. That's the easy part.
The hard part is turning market sizing into decisions: where to spend, who to target, what pipeline is realistic, and which segments you should skip even if the TAM looks huge.
TAM to budget: the model finance will accept
The practical chain looks like this:
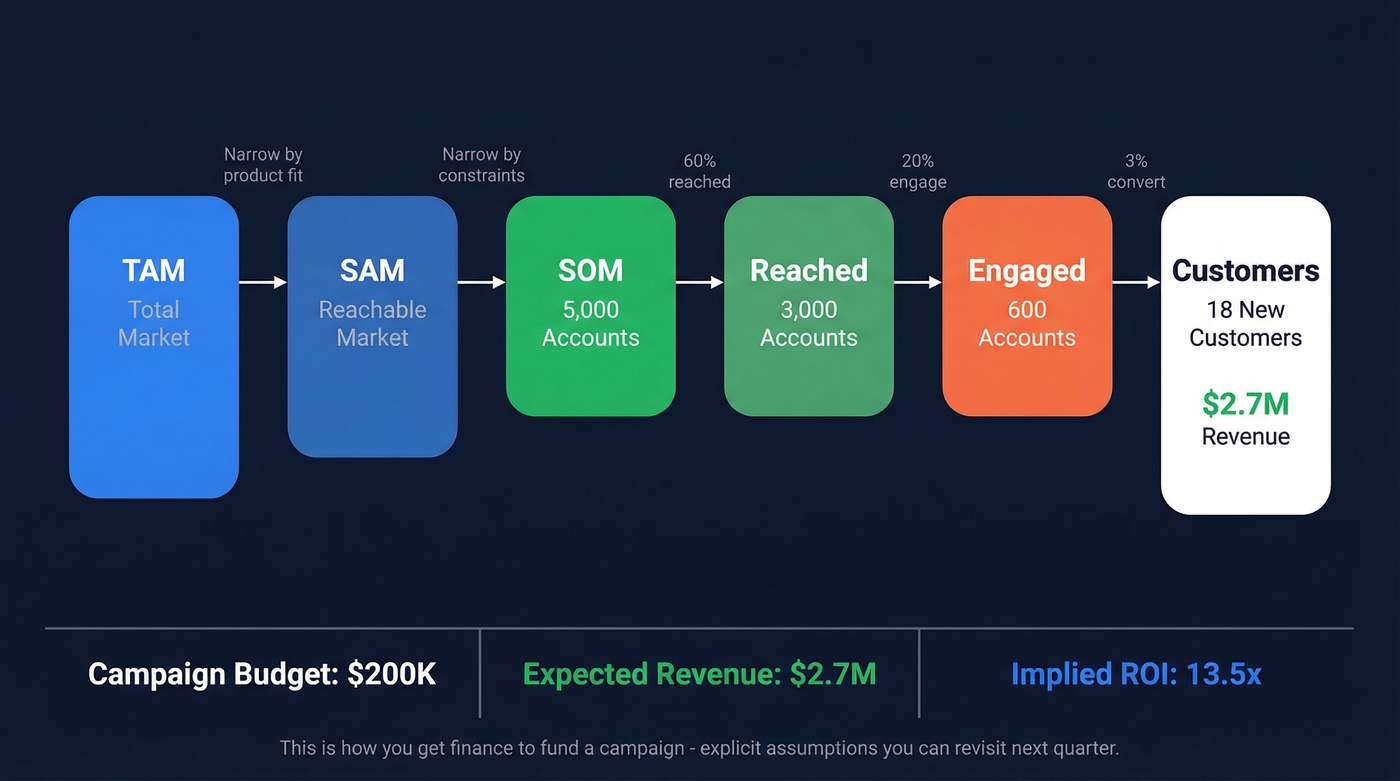
TAM → SAM → SOM → reachable accounts → expected conversion → required spend
If your CMO asks you to justify a $200K campaign, answering with TAM is a rookie move. Finance doesn't fund ceilings. They fund plans.
So you answer with SOM backed by funnel math:
(Accounts reached) × (engagement rate) × (sales conversion rate) × (ARPU) = achievable revenue
Example: your SOM contains 5,000 accounts. You can reach 60% of them in a quarter. Of those reached, 20% engage. Of engaged accounts, 3% become customers. ARPU is $15,000.
Achievable revenue = 5,000 × 0.60 × 0.20 × 0.03 × $15,000 = $2.7M.
Now your $200K campaign isn't "trust us." It's a bet with explicit assumptions you can revisit next quarter. If you need benchmarks for the assumptions, start with sales conversion rate and funnel metrics.
Look, this is where teams get sloppy and it drives us nuts: they inflate TAM, define SAM as "TAM minus some stuff," then pick SOM as a random percentage like 10-30% because it sounds reasonable in a meeting.
On r/ProductMarketing, you can find threads where people describe SOM exactly that way, and the comments are basically, "Yeah, that's what we do too." That's not a model. That's a vibe.
SOM to prospect list: where most teams stall out
SOM is only useful if you can identify the accounts inside it.
If you're building this as an ABM motion, treat SOM as your target account lists input - not an output.
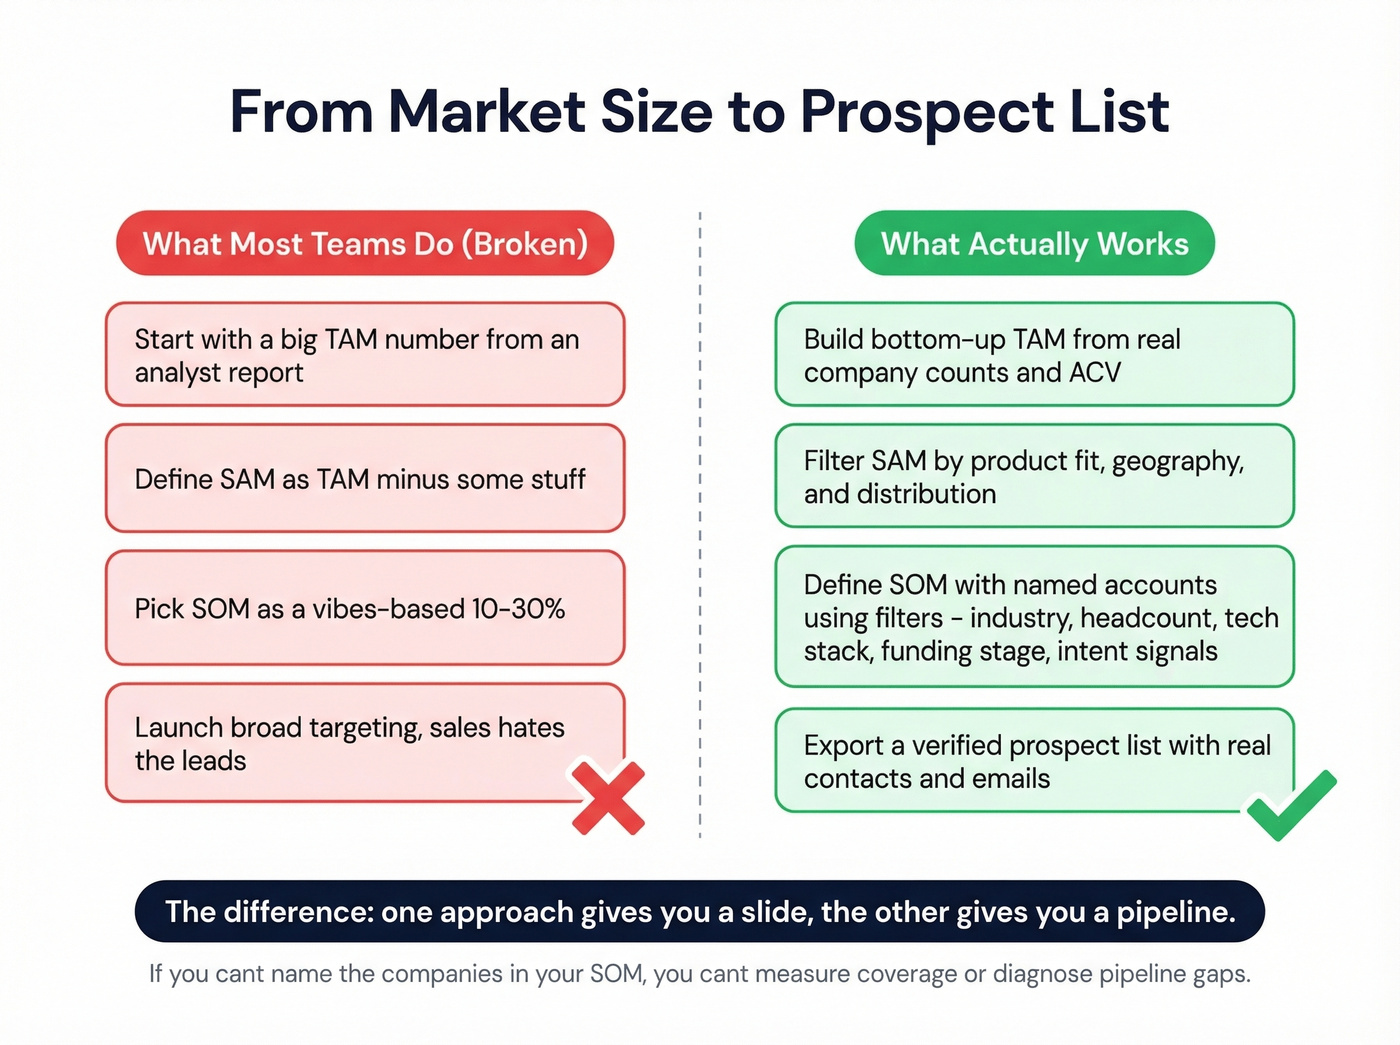
A $50M SOM spread across 2,000 companies is actionable. A $50M SOM that's "somewhere in the mid-market" isn't. If you can't name the companies, you can't target them, you can't measure coverage, and you can't tell whether your pipeline gap is a marketing problem or a market definition problem.
Here's a scenario we've seen in the wild: a B2B SaaS team sized their SOM as "US fintech, 200-2,000 employees." They launched paid search and broad LinkedIn-style targeting, got decent lead volume, and sales hated it. When we forced the SOM into a named-account list, two things popped immediately: (1) half the "fintech" accounts were actually agencies and consultancies misclassified in their data, and (2) the real buyers were concentrated in a few sub-verticals with specific tech stacks. Same budget, totally different plan.
The bridge from market sizing to execution is filtering: industry, headcount, geography, technographics, growth signals, and intent. If you want a practical breakdown of the data types, start with firmographic and technographic data.
This is where tools like Prospeo are genuinely useful in a non-hype way. You can take your SOM criteria and turn it into a list by filtering 300M+ professional profiles with 30+ criteria, including buyer intent across 15,000 topics, technographics, headcount growth, and funding stage. The output isn't a market size number - it's a verified set of accounts and contacts, with 98% email accuracy and data refreshed every 7 days.
Prospecting is where market sizing either becomes real, or dies in a spreadsheet. If you need a tighter workflow, see our lead generation workflow and sales prospecting techniques.

Where to get TAM data (sources that don't waste your time)
Most articles say "use industry reports" and stop there. Here are sources marketers actually use, with links.
| Source | Type | Best for | Cost |
|---|---|---|---|
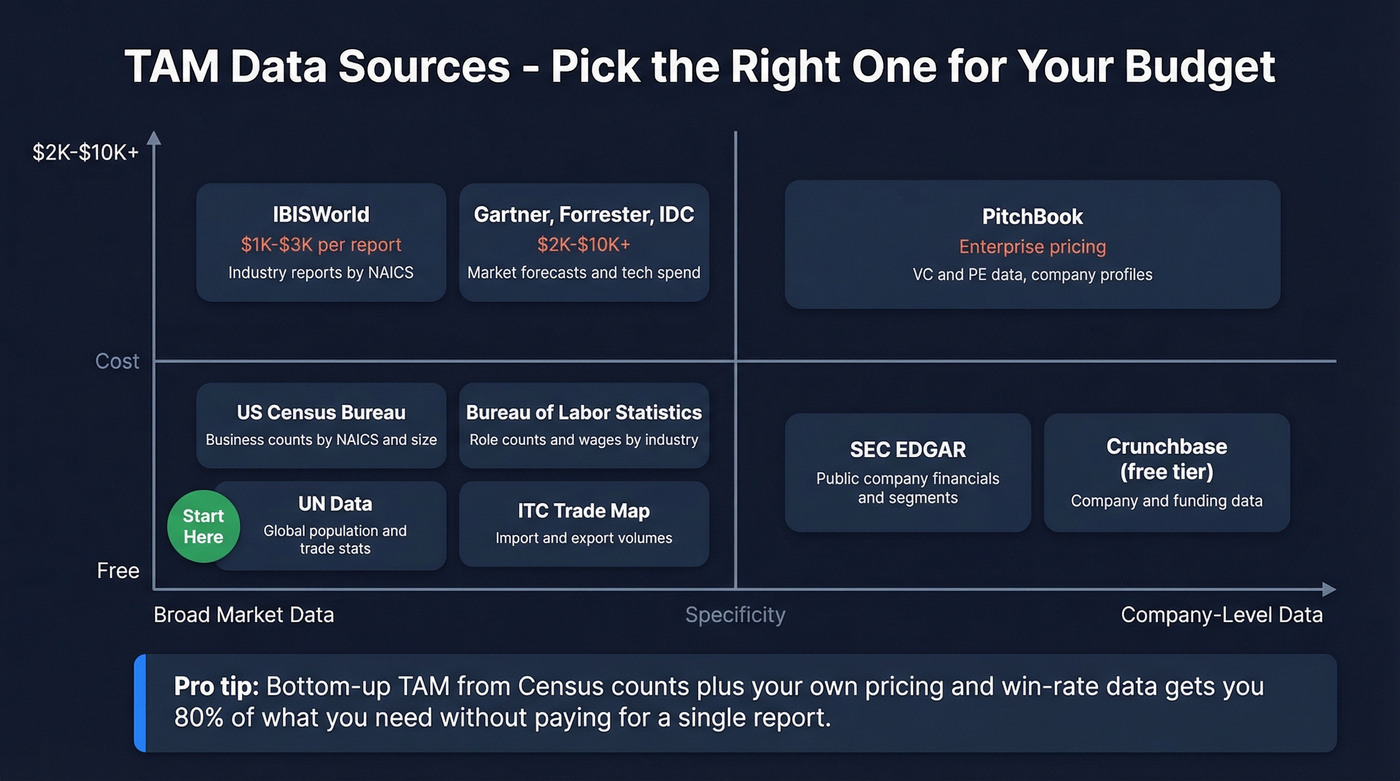
| US Census Bureau: https://www.census.gov/ | Free | Business counts by NAICS, size, geography | Free |
| Bureau of Labor Statistics: https://www.bls.gov/ | Free | Role counts, wages, industry employment | Free |
| SEC EDGAR: https://www.sec.gov/edgar | Free | Public company financials and segment notes | Free |
| UN Data: https://data.un.org/ | Free | Global population, trade, macro indicators | Free |
| ITC Trade Map: https://www.trademap.org/ | Free | Import/export volumes by category | Free |
| Crunchbase | Freemium | Company and funding data | Free tier available; paid plans vary |
| PitchBook | Paid | VC/PE data and company profiles | Enterprise pricing (not public) |
| IBISWorld | Paid | Industry reports by NAICS | Typically $1K-$3K per report |
| Gartner / Forrester / IDC | Paid | Market forecasts and tech spend | Typically $2K-$10K+ per report |
The US Census Bureau is underrated. If your bottom-up TAM starts with "how many companies match our ICP," Census gets you a defensible count without paying for a report.
And if you don't have budget for Gartner-style research, that's fine. Bottom-up TAM built from Census counts plus your own pricing and win-rate data will get you most of what you need to make smart marketing decisions. If you want a cleaner way to document the buyer definition, use an ideal customer profile template.
Markets shift: revisit quarterly
A TAM from a few years ago is often wrong by 2026. Markets expand and contract based on regulation, distribution, pricing pressure, and plain old behavior change.
The canonical example is the Uber TAM debate: https://abovethecrowd.com/2014/07/11/how-to-miss-by-a-mile-an-alternative-look-at-ubers-potential-market-size/. Aswath Damodaran pegged Uber's TAM as the global taxi and car-service market and assumed a capped share. Bill Gurley argued the assumptions were off by orders of magnitude because Uber didn't just steal share, it expanded the market by changing the experience: faster pickup, cashless payment, better reliability. People who didn't take taxis started taking rides.
That's the key lesson for marketers: your TAM isn't fixed if your product changes behavior or your distribution opens new segments. The market can get bigger because you made the offer easier to buy, easier to adopt, or easier to justify.
Most marketing teams treat TAM as a one-time annual planning exercise. That's a mistake. If you're shipping meaningful product improvements, entering new geos, changing pricing, or adding a new channel that reaches a different buyer, last quarter's TAM is already stale.
Common TAM mistakes (and how to avoid them)
Five errors show up over and over.
"We only need 1% of the market." It's a credibility killer. It sounds humble, but it signals you don't have a customer acquisition plan. Replace it with funnel math and capacity assumptions.
Ignoring purchasing power. A founder on r/indianstartups put it bluntly: claiming a country's full population as TAM while ignoring disposable income is "a joke." Addressable means able and willing to pay.
Top-down only. Pulling a number from a report and calling it TAM isn't market sizing. It's borrowing someone else's model and hoping nobody asks questions. Always validate with bottom-up.
SOM as an arbitrary percentage. "We'll capture 15% of SAM" means nothing without channels, conversion rates, and CAC. SOM should come from unit economics, not optimism. If you need to pressure-test the economics, start with cost to acquire customer.
Using stale data. A TAM built on 2020 assumptions in a 2026 plan is fiction. Rebuild the model at least quarterly, even if it's a lightweight refresh.
Is your TAM big enough?
Investors often want to see at least a $1B-$2B TAM, and many prefer $5B-$20B for high-growth outcomes. Antler summarizes that general expectation here: https://www.antler.co/blog/tam-sam-som
But for marketing, raw TAM size isn't the point.
A $500M TAM with a clear path to 10-15% capture is more plan-able than a $100B TAM where you can't explain how you'll reach buyers, what it costs to acquire them, and why you'll win. If your average deal is under $10K, you don't need a $10B TAM to build a great business. You need a SOM that supports your CAC and a targeting model that sales will actually work.
One more blunt rule we use internally: if a segment's SOM can't support the CAC required to win it, it's not a segment. It's a distraction.
Skip this if...
If you're a tiny team still figuring out who the buyer is, don't burn a week trying to perfect TAM to the second decimal place. Do a rough bottom-up estimate, pick a narrow SAM, and spend the time talking to customers and testing positioning. Precision comes after you have signal. For a deeper breakdown of the framework, see our guide to the addressable market.
Your SOM-to-pipeline math only works if you can reach those accounts with verified contact data. Prospeo delivers 98% email accuracy and 125M+ verified mobile numbers, refreshed every 7 days - so your funnel assumptions hold up when campaigns go live.
Bad data breaks the funnel math you just built. Fix it at the source.
FAQ
What does TAM stand for in marketing?
TAM stands for Total Addressable Market - the total revenue opportunity if a product captured 100% market share. In marketing, TAM is mainly used as context for segmentation and planning, not as a forecast.
What's the difference between TAM, SAM, and SOM?
TAM is the entire market. SAM is the portion you can reach with your product and distribution. SOM is what you can realistically capture given competition, budget, and sales capacity. Most marketing decisions happen at the SAM and SOM level.
How do you calculate TAM for a SaaS product?
Use bottom-up: count companies that match your ICP, then multiply by ACV. Example: 50,000 mid-market companies × $12,000 ACV = $600M TAM. Cross-check with a top-down estimate to sanity-check assumptions.
How do you turn TAM into an actionable prospect list?
Define SOM criteria (industry, company size, technographics, intent), then filter a B2B database to produce named accounts and contacts. The key is making the market definition operational: you should be able to point to the exact accounts inside your SOM.
How often should you recalculate TAM?
Quarterly is a good cadence for most teams. Markets move, products evolve, and distribution changes fast enough that an annual-only TAM turns into a stale story instead of a planning tool.