How to Acquire a Customer in 2026 (With Real CAC Data)
"I feel like I'm throwing money away on customer acquisition." That's not a hypothetical - it's a real post on r/smallbusiness. B2B customer acquisition costs rose 40-60% between 2023 and 2025, and the bleeding hasn't stopped. If you're trying to acquire a customer without lighting money on fire, here's the framework that actually works.
The Numbers That Matter
Four data points before we go deep:
- B2B CAC ranges from $86 (ecommerce) to $1,143 (education), with SaaS averaging $239.
- Cheapest channels: Referrals ($150) → SEO ($290) → Paid Social ($230) → Paid Search ($802) → Outbound ($1,980).
- Healthy LTV:CAC ratio: 3:1 minimum. Elite teams hit 4:1+.
- Why it's harder: CAC rose 40-60% from 2023 to 2025, driven by privacy regulations, rising ad costs, and attribution collapse.
What Customer Acquisition Actually Means
Customer acquisition is the full process of turning a stranger into a paying customer - from first touch to closed deal. It covers every dollar you spend on marketing, sales, tools, and headcount to move someone from unaware to paying.
The scope matters because it's easy to confuse acquisition with lead generation. Lead gen fills the top of the funnel. Acquisition includes everything downstream: nurturing, demos, proposals, negotiation, close, and onboarding.
Here's the thing: acquisition is expensive relative to retention. The common rule of thumb says it costs about 5x more to win a new buyer than to keep an existing one. Every dollar you waste on inefficient acquisition is a dollar you could've spent expanding revenue from customers who already trust you.
Why Costs Keep Rising
The 40-60% B2B CAC surge from 2023 to 2025 isn't a single problem - it's a stack of compounding pressures. Ecommerce user acquisition costs have climbed 222% over the past decade according to SimplicityDX, signaling a broader trend across digital channels.
Competition for attention has exploded. Global digital ad spend hit $526B in 2023 and is forecast to reach $936B by 2029 per Dentsu's estimates. More advertisers bidding on the same inventory means higher CPMs, higher CPCs, and higher CAC across every paid channel.
Privacy regulations gutted attribution. Cookie deprecation, iOS tracking restrictions, and GDPR enforcement have made it harder to target the right people and harder to measure what's working. When you can't attribute conversions accurately, you over-invest in channels that look good on paper and under-invest in channels that actually convert.
And buyers got smarter. B2B buyers now complete the majority of their research before talking to sales - they're comparing you to competitors before you even know they exist. Your content, pricing transparency, and reputation do more acquisition work than your SDR team, but most companies haven't shifted budget to reflect that reality.
B2B vs. B2C Funnels
The funnel you're optimizing determines your CAC. Treating B2B and B2C funnels the same is one of the fastest ways to waste money.
| Dimension | B2B | B2C |
|---|---|---|
| Stages | 6 (awareness → purchase) | 4 (awareness → action) |
| Decision-makers | 4-7 stakeholders | 1 person |
| Cycle length | Weeks to months | Minutes to days |
| Primary driver | Trust + ROI proof | Emotion + convenience |
B2B: Multiple Stakeholders, Longer Cycles
The B2B funnel runs through awareness, interest, consideration, intent, evaluation, and purchase, with each stage involving different stakeholders - procurement, technical leads, finance, and the end user all have veto power. That's why B2B cycles stretch for months and why 70% of sales efficiency depends on funnel structure. A poorly structured funnel doesn't just slow deals. It inflates CAC by forcing reps to re-engage stakeholders who dropped off mid-process.
B2C: Speed Wins
B2C collapses to four stages - awareness, interest, desire, action - with one person making the call. The cycle can be minutes. The levers are emotional triggers, social proof, and frictionless checkout. CAC is lower per unit but volume requirements are higher, which means B2C teams live and die by channel efficiency and conversion rate optimization.
Channels Ranked by CAC
Here are the real costs per channel in B2B, based on 2026 benchmark data from Phoenix Strategy Group:
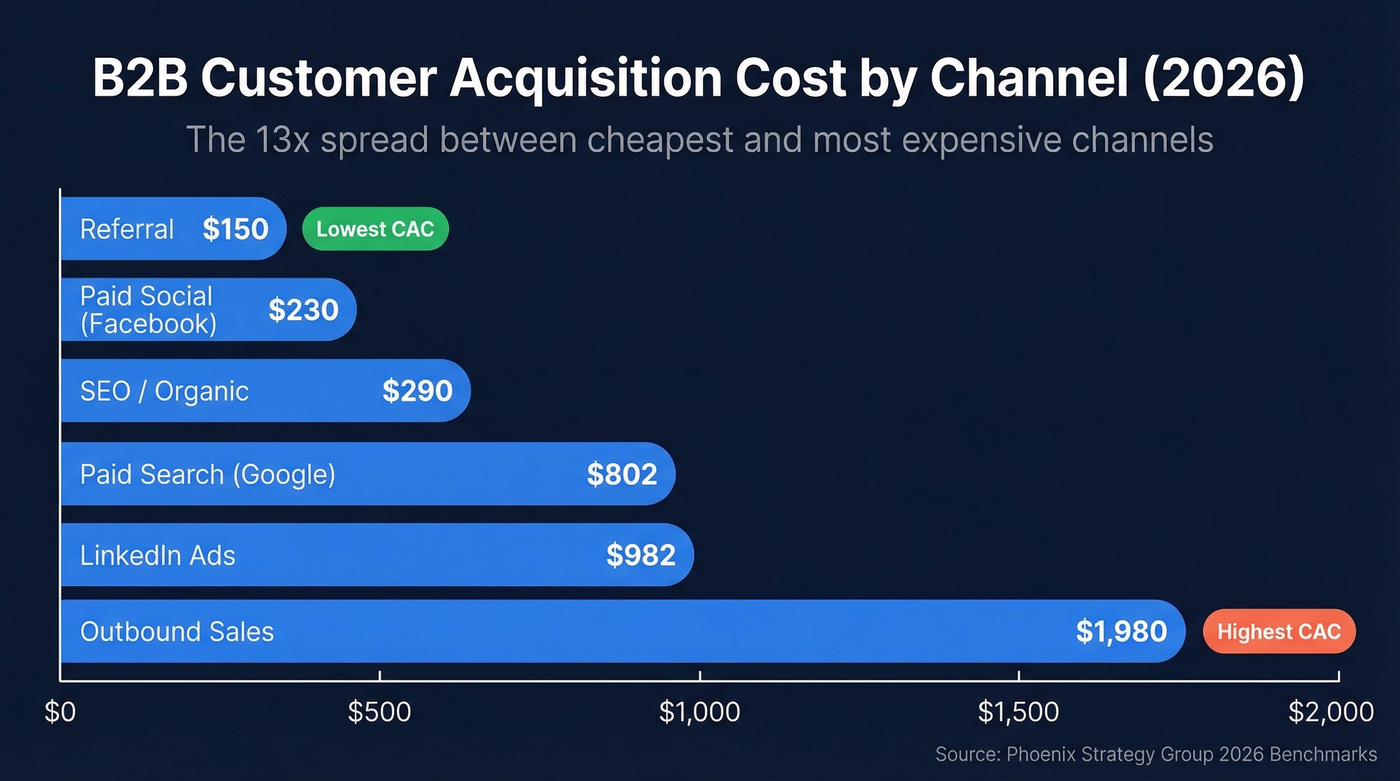
| Channel | B2B CAC | Best For | Time to ROI |
|---|---|---|---|
| Referral | ~$150 | High-trust sales | 1-3 months |
| Paid Social (Facebook) | ~$230 | SMB / mid-market | 1-2 months |
| SEO / Organic | ~$290 | Long-term compounding | 6-12 months |
| Paid Search (Google) | ~$802 | High-intent capture | 1-3 months |
| LinkedIn Ads | ~$982 | Enterprise targeting | 2-4 months |
| Outbound Sales | ~$1,980 | Named accounts / ABM | 3-6 months |
The spread is massive - a 13x difference between referrals and outbound. That explains why so many founders say "paid ads eat budget fast."
Here's our contrarian take: outbound isn't overpriced. It's mispriced. Most of that $1,980 CAC comes from wasted effort - bad contact data, wrong personas, untested messaging. When data quality is high and targeting is tight, outbound CAC drops dramatically. We've seen this firsthand with teams that clean up their data before scaling sends.
If your average contract value is under five figures, you probably don't need outbound at all. Referrals + SEO + targeted paid social will get you to $3M ARR faster and cheaper. Save outbound for enterprise logos that justify the unit economics.
You just saw it: outbound CAC hits $1,980 mostly because of bad contact data and wrong-fit targeting. Prospeo's 300M+ profiles with 30+ filters - intent data, technographics, headcount growth, funding - let you build laser-targeted lists at $0.01/email with 98% accuracy. Teams using Prospeo book 35% more meetings than Apollo users and see bounce rates drop below 4%.
Stop subsidizing bad data. Cut your outbound CAC in half.
Five Steps to Build Your Strategy
Step 1: Define Your ICP
Start with your best 20 customers. What do they have in common? Industry, headcount, tech stack, funding stage, buying trigger. Your ICP isn't a persona doc that lives in a Google Drive folder - it's a set of filters you can actually apply to a database or ad platform. If you need a starting point, use an ICP template and score it.
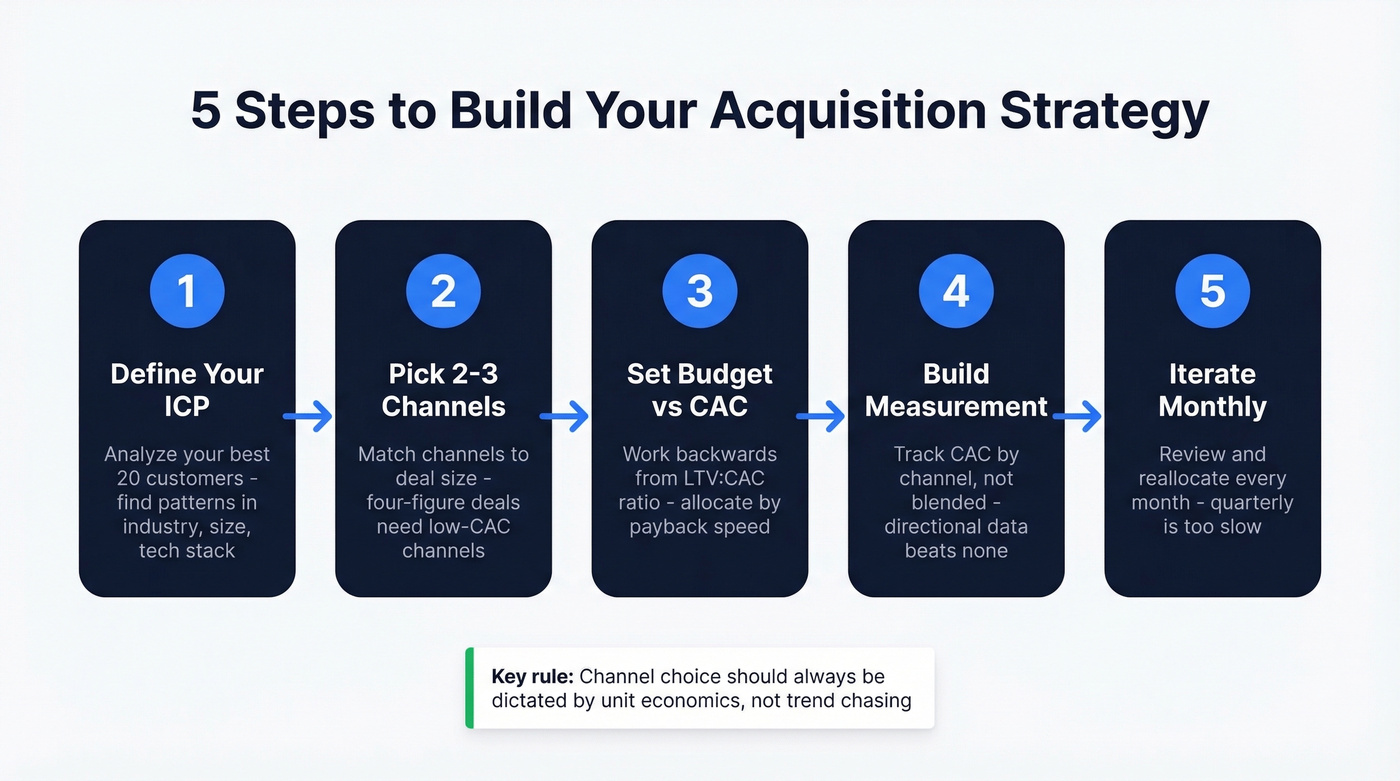
Step 2: Pick 2-3 Channels Based on Economics
Match channels to deal size. If average deals are in the four-figure range, you can't afford $982 LinkedIn CAC - referrals + SEO + targeted paid social is a better stack. For six-figure enterprise deals, outbound and account-based selling make the math work because LTV justifies the spend. The method you choose should always be dictated by unit economics, not trend chasing.
Step 3: Set Budget Against CAC Targets
Work backwards from your target LTV:CAC ratio. If your LTV is $15,000 and you're targeting 3:1, your max CAC is $5,000. Allocate across your chosen channels, weighted toward the ones with the fastest payback.
Step 4: Build Your Measurement Stack
Track CAC by channel, not just blended. Blended CAC hides the channels that are bleeding money. You need attribution at the channel level - even if it's imperfect, directional data beats no data. If you want a clean way to structure this, start with funnel metrics.
Step 5: Iterate Monthly
Quarterly reviews are too slow. CAC shifts month to month as channels saturate, competitors enter, and seasonality hits. Review channel performance monthly, reallocate budget to what's working, and kill what isn't. Skip this if you enjoy watching ad spend evaporate while you wait for a QBR.
Metrics That Actually Matter
CAC Formula (Worked Example)
CAC = Total Sales & Marketing Spend / New Customers Acquired
Include everything: salaries, tools, ad spend, content production, events, and overhead. Excluding headcount is the most common mistake - your SDR team's fully loaded cost is part of every deal whether you like it or not. If you want a deeper breakdown, see our guide to cost to acquire customer.
Worked example: You spend $120K/quarter on marketing ($50K ads, $30K content, $40K tools + headcount) and $80K on sales (2 SDRs + commission). You close 50 new customers. CAC = $200K / 50 = $4,000.
CLV Formula
CLV = Average Purchase Value x Purchase Frequency x Average Customer Lifespan
If your average customer pays $100/month ($1,200/year) and stays 3 years, CLV = $1,200 x 3 = $3,600. Pair this with your CAC to get the ratio that determines whether your acquisition engine is sustainable.
CAC Benchmarks by Industry
Combined CAC benchmarks from First Page Sage, weighted 75% organic / 25% inorganic:
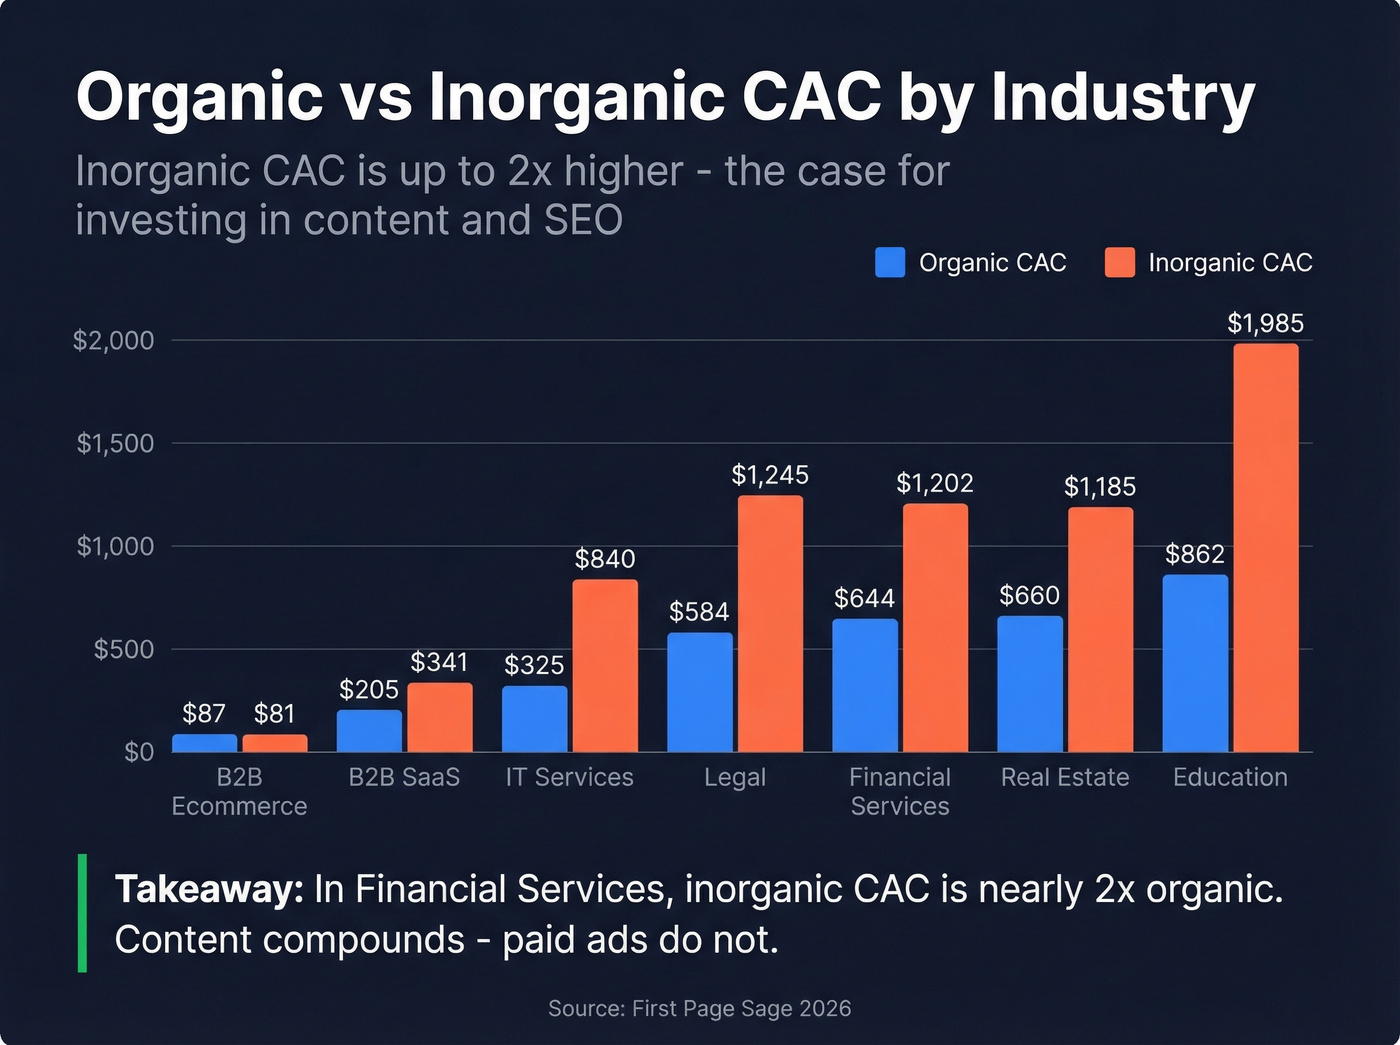
| Industry | Organic CAC | Inorganic CAC | Combined |
|---|---|---|---|
| B2B SaaS | $205 | $341 | $239 |
| Ecommerce (B2B) | $87 | $81 | $86 |
| IT & Managed Services | $325 | $840 | $454 |
| Financial Services | $644 | $1,202 | $784 |
| Legal Services | $584 | $1,245 | $749 |
| Real Estate | $660 | $1,185 | $791 |
| Education | $862 | $1,985 | $1,143 |
Notice the gap between organic and inorganic. In financial services, inorganic CAC is nearly 2x organic. That's the compounding value of content and SEO - it takes longer to build, but the unit economics are dramatically better over time.
LTV:CAC Ratio by Stage
Benchmarks from SaaS Hero show how the ratio should improve as you scale:
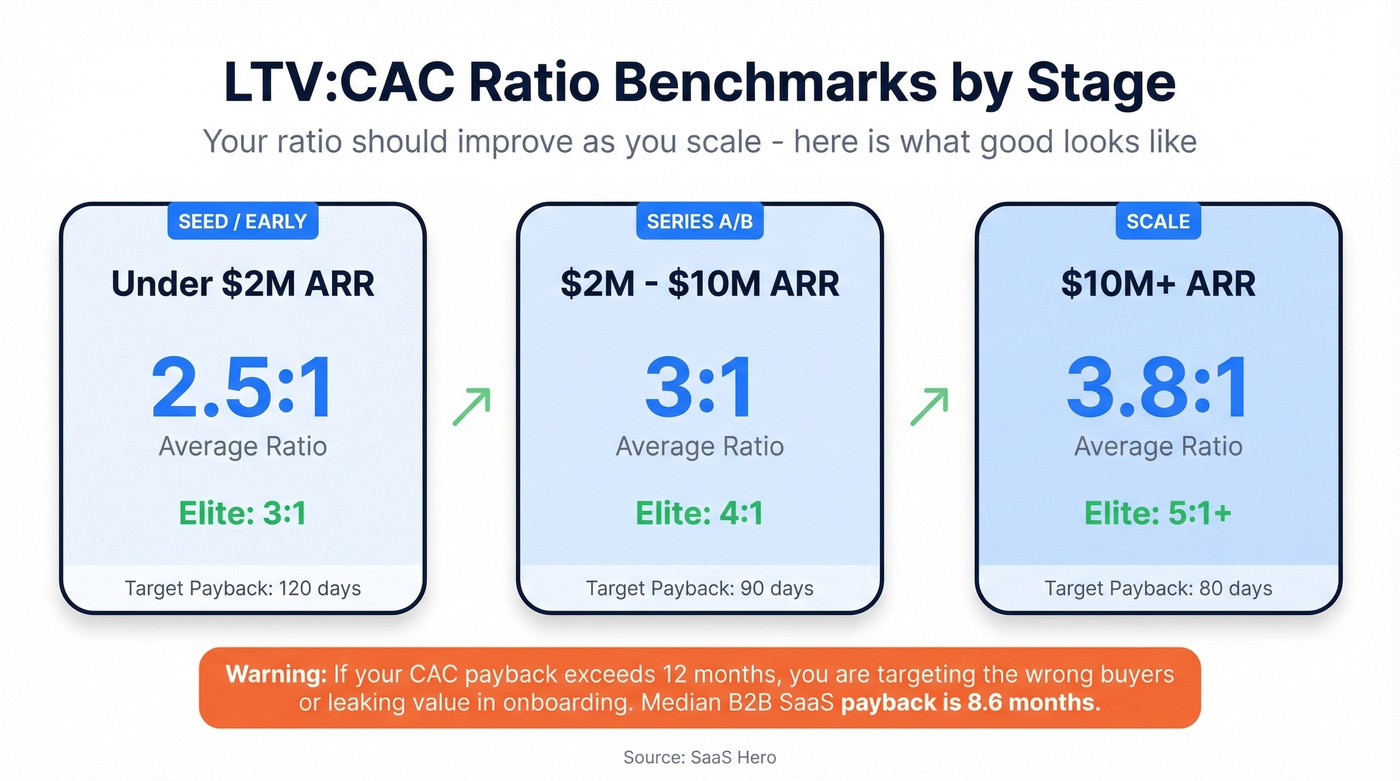
| Stage | ARR Range | Avg Ratio | Elite Ratio | Target Payback |
|---|---|---|---|---|
| Seed / Early | <$2M | 2.5:1 | 3:1 | 120 days |
| Series A/B | $2M-$10M | 3:1 | 4:1 | 90 days |
| Scale | $10M+ | 3.8:1 | 5:1+ | 80 days |
The median B2B SaaS CAC payback period is 8.6 months. If yours is longer than 12 months, you're either targeting the wrong buyers or your onboarding is leaking value before customers realize ROI (run a quick churn analysis to find the leak).
How AI Is Cutting Acquisition Costs
Some AI applications cut CAC. Others just add complexity. Here's what's actually delivering results right now:
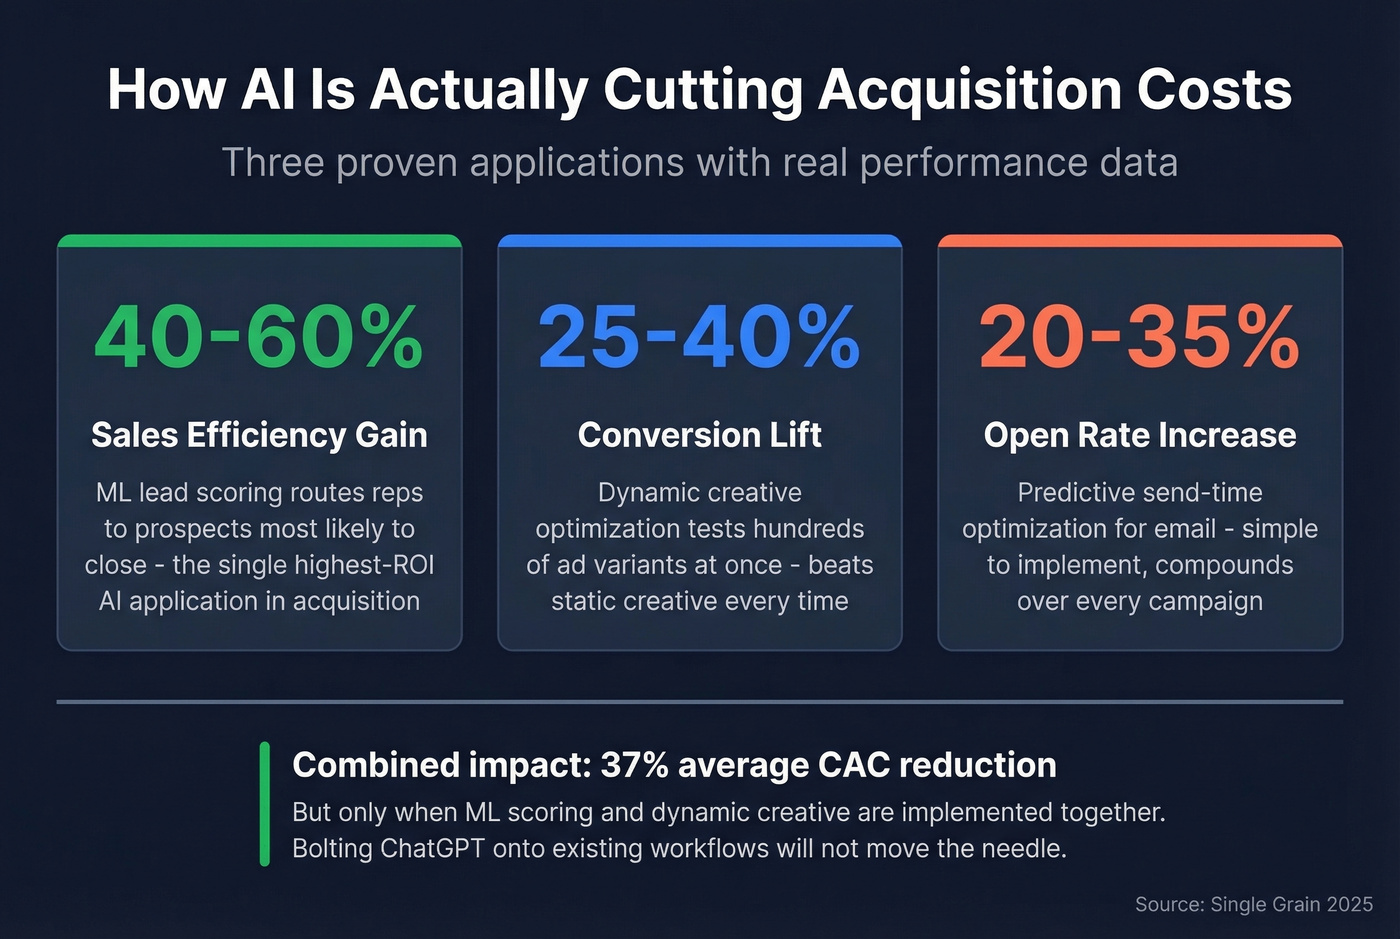
ML lead scoring drives a 40-60% sales efficiency gain by routing reps to the prospects most likely to close. This is the single highest-ROI AI application in acquisition. Dynamic creative optimization tests hundreds of ad variants simultaneously, producing 25-40% conversion lifts over static creative. And predictive send-time optimization for email increases open rates by 20-35% - simple to implement, compounds over every campaign.
Companies using AI-powered marketing see an average 37% CAC reduction, but that number is realistic only for teams that implement ML scoring and dynamic creative together. Bolting ChatGPT onto existing workflows won't move the needle.
Bad Data Is Inflating Your CAC
Let's be honest about something most acquisition guides ignore.
Your SDR team sends 5,000 outbound emails this month. 1,200 bounce because the emails are stale or invalid. Another 800 reach the wrong person - they've changed roles or left the company. Your effective audience is 3,000. That's 40% waste, and it means your real CAC is 40% higher than whatever your dashboard says.

The channel isn't broken - the data is. Snyk experienced this firsthand: their 50-person AE team was running bounce rates of 35-40% before switching to Prospeo. After deploying 98%-accuracy email verification with a 7-day refresh cycle, bounce rates dropped below 5%. AE-sourced pipeline jumped 180%, generating 200+ new opportunities per month. That's not a marginal improvement - it's a structural fix to outbound economics.
Step 1 says define your ICP. Step 2 says match channels to economics. Prospeo handles both - 30+ search filters let you turn your ICP into a live prospect list in minutes, not hours. Layer buyer intent signals across 15,000 topics to reach accounts actively researching your category. One team tripled pipeline from $100K to $300K/week with the same headcount.
Turn your ICP definition into a verified prospect list in under five minutes.
Seven Mistakes That Inflate Your CAC
- Spreading budget across too many channels. Master two before you add a third.
- Tracking CAC without LTV context. A $2,000 CAC is great if LTV is $20,000. Terrible if LTV is $3,000.
- Hiding pricing behind "Request Demo." Self-serve buyers convert fastest. Don't gate them.
- Skipping outbound data verification. Every bounced email inflates CAC and damages sender reputation.
- Scaling paid before validating product-market fit. Ads amplify what you have. A 0.5% conversion rate just burns faster at higher spend.
- Ignoring onboarding churn. If they churn in month two, that CAC is wasted.
- Spending on "brand awareness" without measurement. Every dollar should trace to pipeline.
FAQ
What is customer acquisition cost (CAC)?
CAC equals total sales and marketing spend divided by new customers acquired in a given period. Include salaries, tools, ad spend, and overhead - excluding headcount makes your number artificially low and hides the true cost to acquire a customer.
What's a good CAC for B2B SaaS?
The combined B2B SaaS average is $239 according to First Page Sage benchmarks. But "good" depends on LTV - aim for a 3:1 LTV:CAC ratio minimum. If your LTV is $1,200, keep CAC under $400.
What's the cheapest way to acquire a customer?
Referral programs cost roughly $150 per new buyer in B2B, followed by SEO at ~$290. Outbound runs ~$1,980 but drops significantly with verified contact data - tools like Prospeo cut bounce-related waste by keeping emails 98% accurate on a 7-day refresh.
Why is customer acquisition getting more expensive?
Privacy regulations killed easy targeting, cookie deprecation broke attribution, and ad costs keep climbing as global digital spend approaches $936B by 2029. CAC rose 40-60% from 2023 to 2025, and the trend isn't reversing in 2026.
How does data quality affect acquisition cost?
Bad contact data wastes outbound spend on bounced emails and wrong numbers - if 25% of your list bounces, your real CAC is 25% higher than reported. Verified, fresh data eliminates the decay that silently inflates costs across every outbound campaign.