You Don't Need 28 B2B Sales KPIs - You Need These
Your VP of Sales just pulled up the dashboard. Twenty-eight metrics, four tabs, a color-coded heatmap nobody reads. Meanwhile, 69% of B2B reps missed quota last year - not because they lacked data, but because they drowned in it. McKinsey found that companies running data-driven sales engines report 15-25% EBITDA increases, yet most teams can't name the five B2B sales KPIs that actually move revenue.
The problem isn't measurement. It's focus.
Quick Version: The Five That Matter
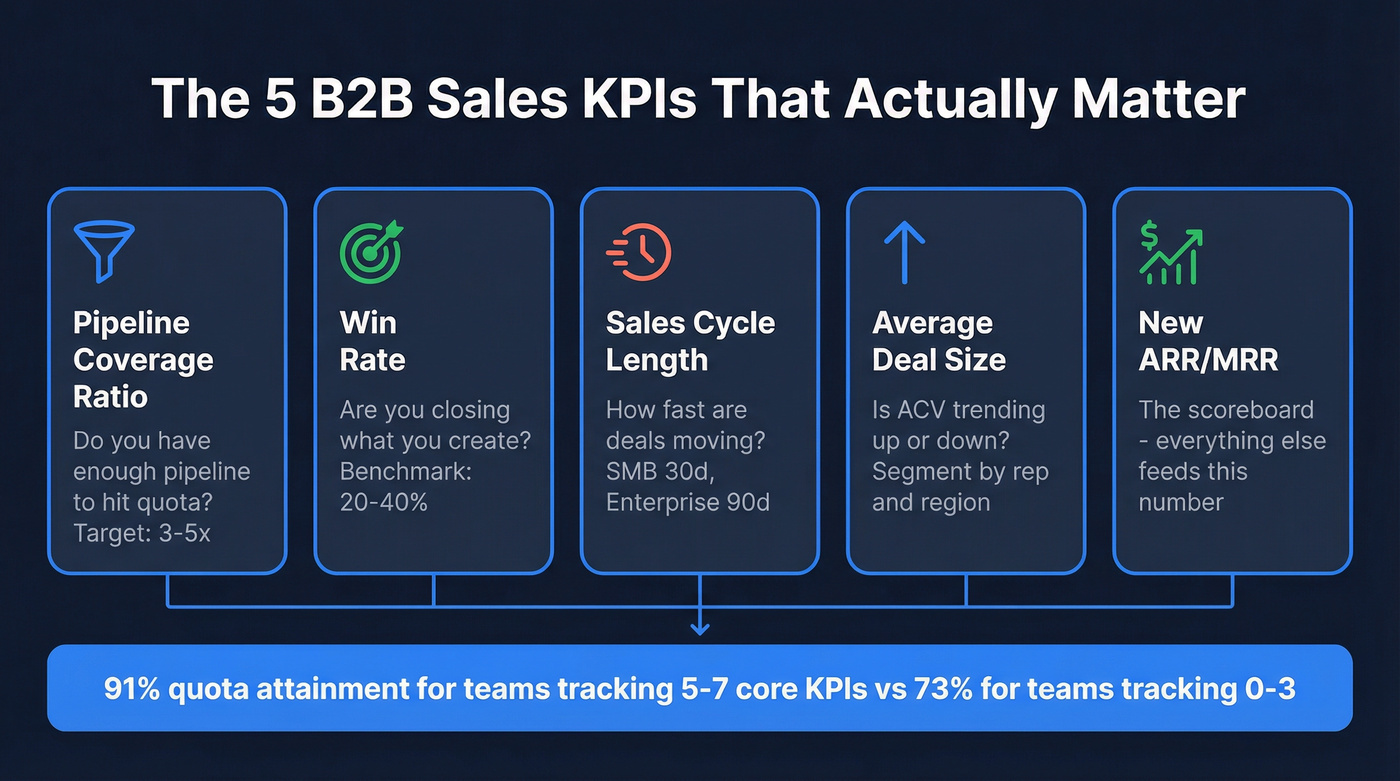
Teams tracking 5-7 core KPIs achieve 91% average quota attainment versus 73% for teams tracking 0-3. That's not marginal - it's the gap between a team that hits plan and one that doesn't.
Start here:
- Pipeline coverage ratio - Do you have enough pipeline to hit quota?
- Win rate - Are you closing what you create?
- Sales cycle length - How fast are deals moving?
- Average deal size - Is ACV trending up or down?
- New ARR/MRR - The scoreboard. Everything else feeds this.
Build a dashboard around these five and you'll outperform most B2B sales orgs. Benchmarks and formulas below.
The Core Metrics That Drive Revenue
Revenue KPIs
New ARR is the ultimate output metric. Everything else on this list exists to explain why that number went up or down.
Average deal size tells you whether you're moving upmarket, getting squeezed on pricing, or landing bigger logos. Track it monthly and segment by rep, region, and product line - the aggregate number hides too much. We've watched teams celebrate a "record quarter" only to realize one whale deal masked a 15% decline in average ACV across the rest of the book.
Quota attainment is the simplest formula in sales: (closed revenue / quota) x 100. But the distribution matters more than the average. If 20% of reps carry 80% of revenue, you don't have a sales team - you have a few closers and a hiring problem. Best-in-class orgs get 60-70% of reps at or above 100%.
Pipeline KPIs
Pipeline coverage ratio is the single best leading indicator of whether you'll hit the number. The formula: total qualified pipeline value for the next 1-2 sales cycles / quota for the period. Minimum is 3x. If your win rate runs below 25%, you need 4-5x. Sales leaders across RevOps communities consistently rank pipeline coverage as the #1 leading indicator - and they're right.
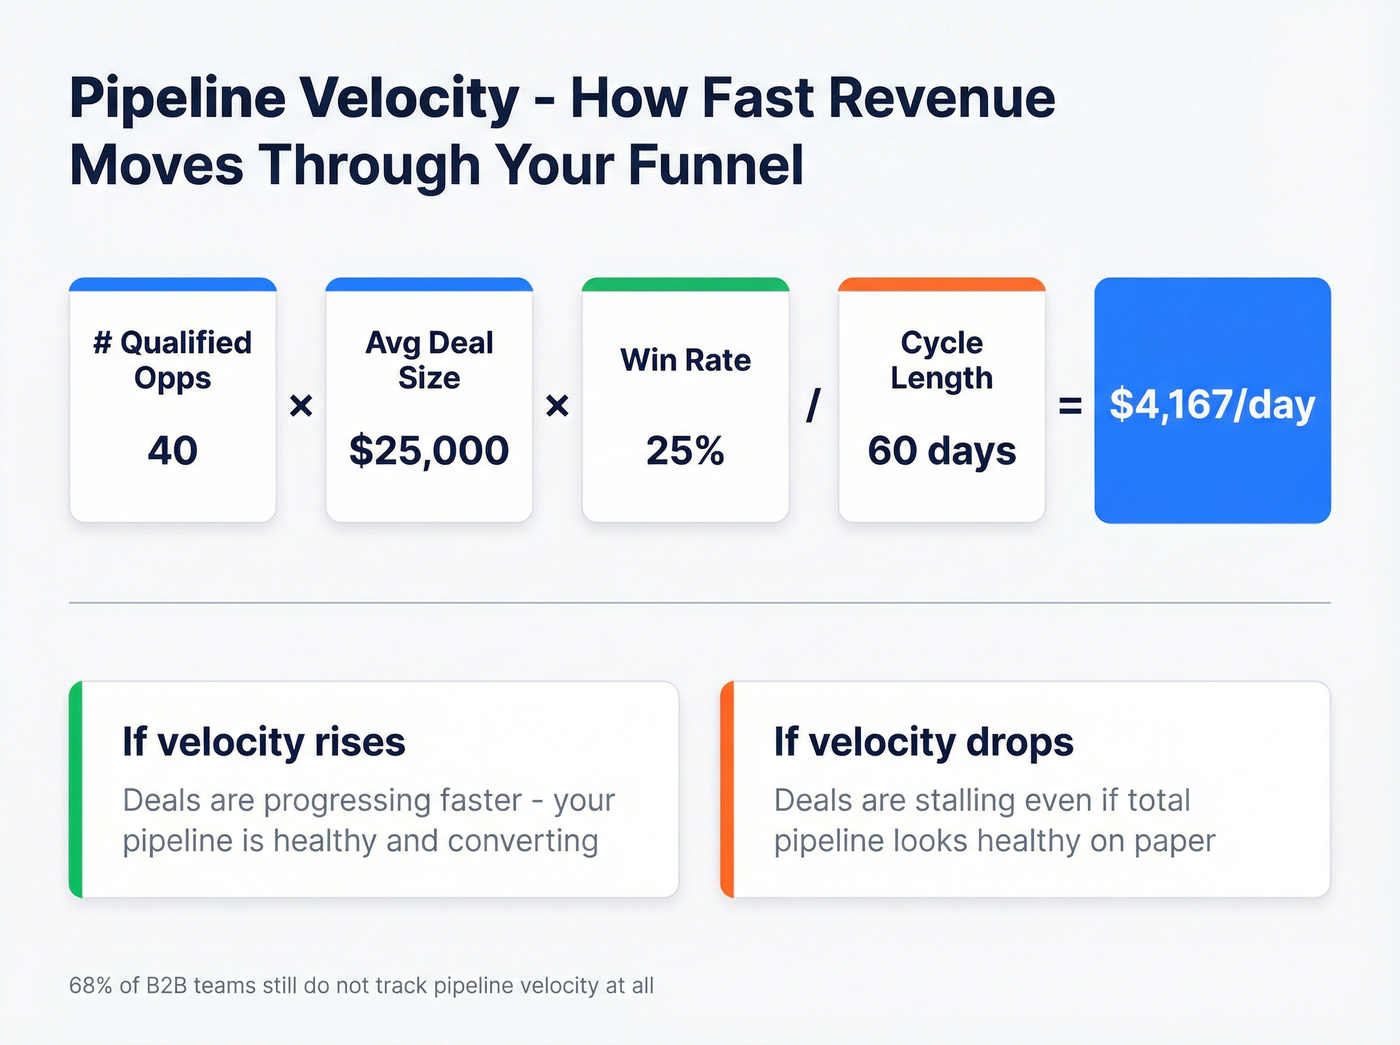
Pipeline velocity tells you how fast revenue moves through the funnel: (number of qualified opportunities x average deal size x win rate) / sales cycle length in days. A staggering 68% of B2B teams still don't track velocity at all. Teams that do see 23% faster revenue growth than those tracking only pipeline value.
Here's a worked example. Say you have 40 qualified opportunities at $25K average, a 25% win rate, and a 60-day cycle. Your velocity is (40 x $25,000 x 0.25) / 60 = $4,167/day. If that number drops month over month, deals are stalling - even if your total pipeline looks healthy on paper.
Efficiency KPIs
Win rate = (closed-won deals / total opportunities) x 100. The average across B2B sits at 20-30%. Best-in-class teams hit 35-40%+. Below 20%? The issue is usually qualification, not closing skill.
Sales cycle length varies dramatically by segment. Based on anonymized CRM data from 939 B2B companies: SMB averages 30 days, enterprise averages 90. If your cycle runs significantly longer than your segment's benchmark, look at deal stalls between stages - that's where the time hides. (If you sell SaaS, compare against SaaS sales cycle benchmarks too.)
Customer acquisition cost should stay below one-third of first-year ACV. The CLV:CAC ratio needs to be at least 3:1 to sustain growth, with 4:1 as the optimal target. These metrics reveal whether your growth engine is sustainable or just burning cash.
Activity and Response KPIs
Lead response time is the activity metric that actually correlates with revenue. Best-in-class teams respond to inbound leads in under five minutes, and 35-50% of deals go to the first responder. Cold outreach-to-meeting conversion runs 2-3%; warm outreach hits 15-20%.
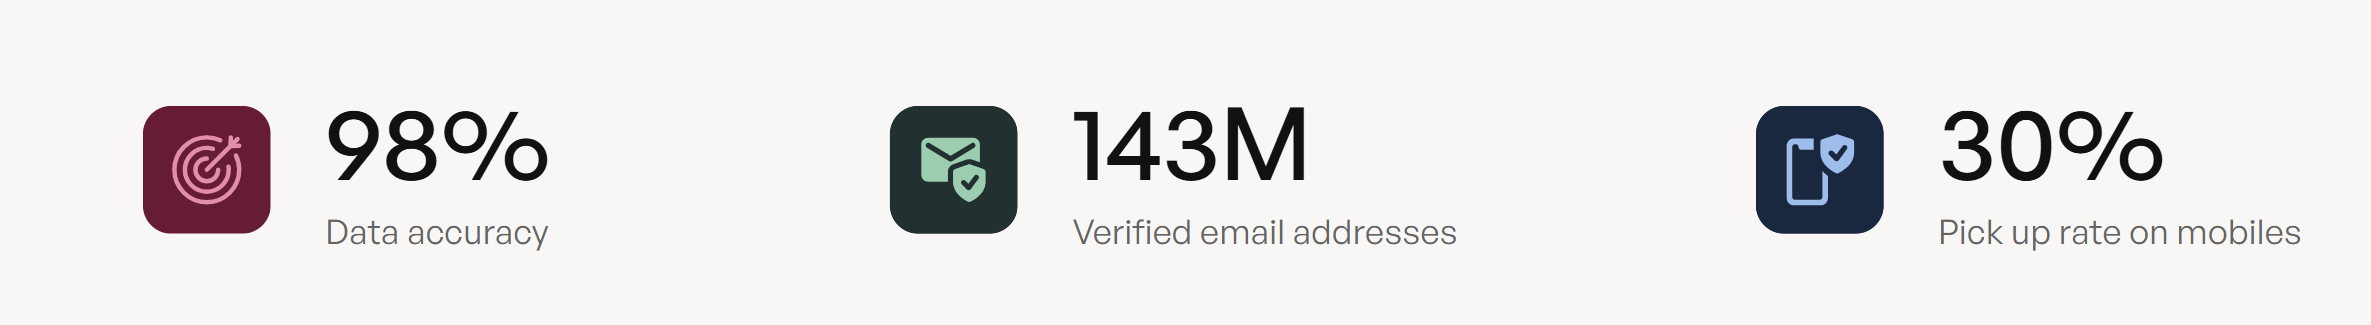
Here's the thing: activity metrics are fiction if reps are emailing bounced addresses or calling dead numbers. We've seen teams log 50 dials per rep per day and celebrate the volume, only to discover a third of those numbers were disconnected. Prospeo's 98% email accuracy and 125M+ verified mobiles help ensure logged activity reflects real conversations, not phantom touches. (If you're auditing this, start with CRM hygiene and prospect data accuracy.)
Meetings booked matters only when paired with meeting-to-opportunity conversion (benchmark: 25-40%). A hundred meetings that produce five opportunities is a targeting problem, not a volume problem. Tighten your prospecting workflow before you push for more activity.
Retention KPIs
Customer retention rate, churn, and net revenue retention validate everything upstream. NRR above 110% means existing customers are expanding faster than others are leaving - the clearest sign of product-market fit.
One gap most KPI frameworks miss: rep retention and ramp time. If your average ramp is six months and annual rep turnover is 30%, you're perpetually running at half capacity. Track both alongside customer retention.
B2B Sales KPI Benchmarks by Segment
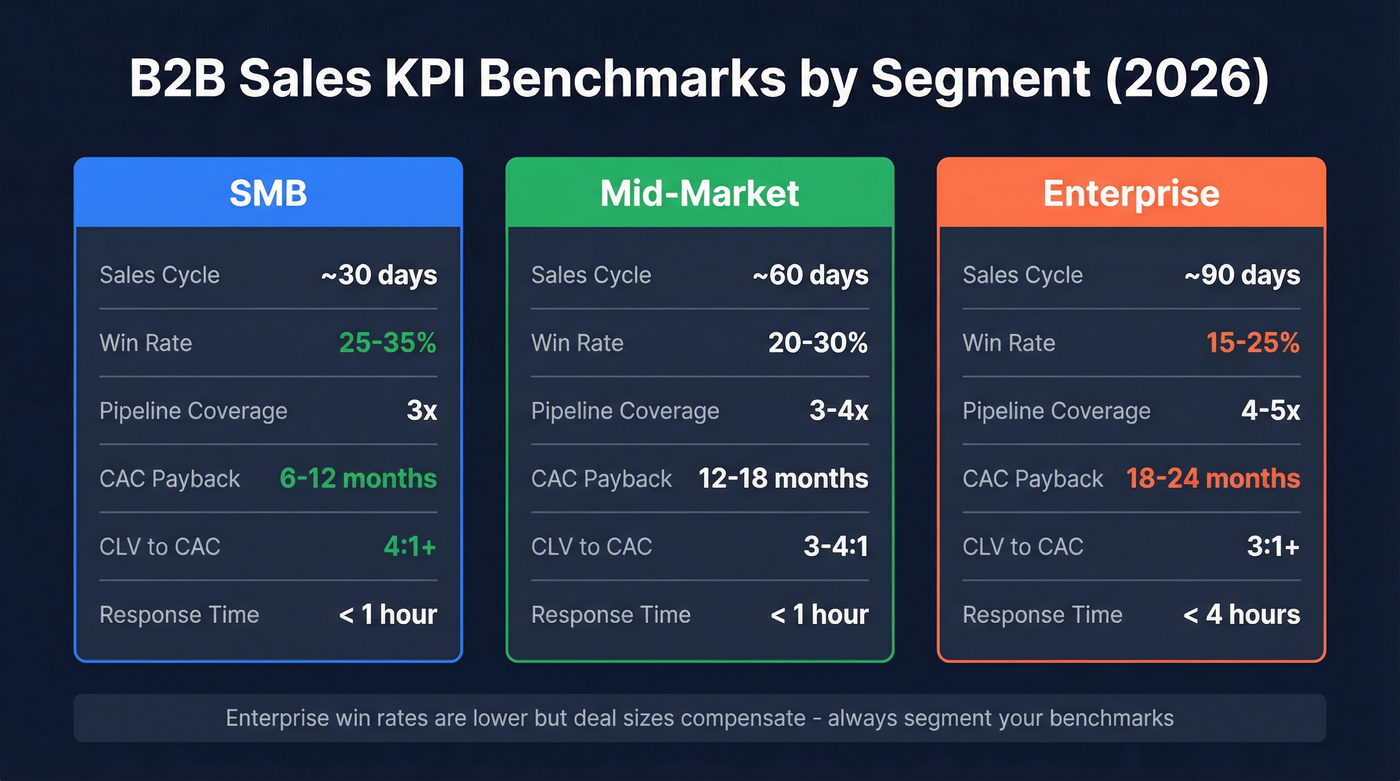
Use these benchmarks as starting points - they reflect the most recent data available heading into 2026.
| KPI | SMB | Mid-Market | Enterprise |
|---|---|---|---|
| Sales cycle | ~30 days | ~60 days | ~90 days |
| Win rate | 25-35% | 20-30% | 15-25% |
| Pipeline coverage | 3x | 3-4x | 4-5x |
| CAC payback | 6-12 months | 12-18 months | 18-24 months |
| CLV:CAC | 4:1+ | 3-4:1 | 3:1+ |
| Response time | < 1 hour | < 1 hour | < 4 hours |
Enterprise win rates are lower, but deal sizes compensate. Don't compare your enterprise team's 18% win rate to an SMB team's 32% - they're playing different games. The Salesforce KPI framework makes the same point: segment your benchmarks or they're meaningless.
Let's be honest: if your average contract value sits below $10K, you probably don't need half the KPIs on most "definitive lists." Pipeline coverage, win rate, and cycle length will tell you 90% of what you need to know. The teams that drown in dashboards are usually the ones avoiding the hard conversation about why they're not closing.
KPI Traps - What Not to Track
A Morton Kyle poll asked B2B sales leaders which metric is most dangerous to obsess over. The results: 47% said CRM activity counts, 37% said pipeline size.
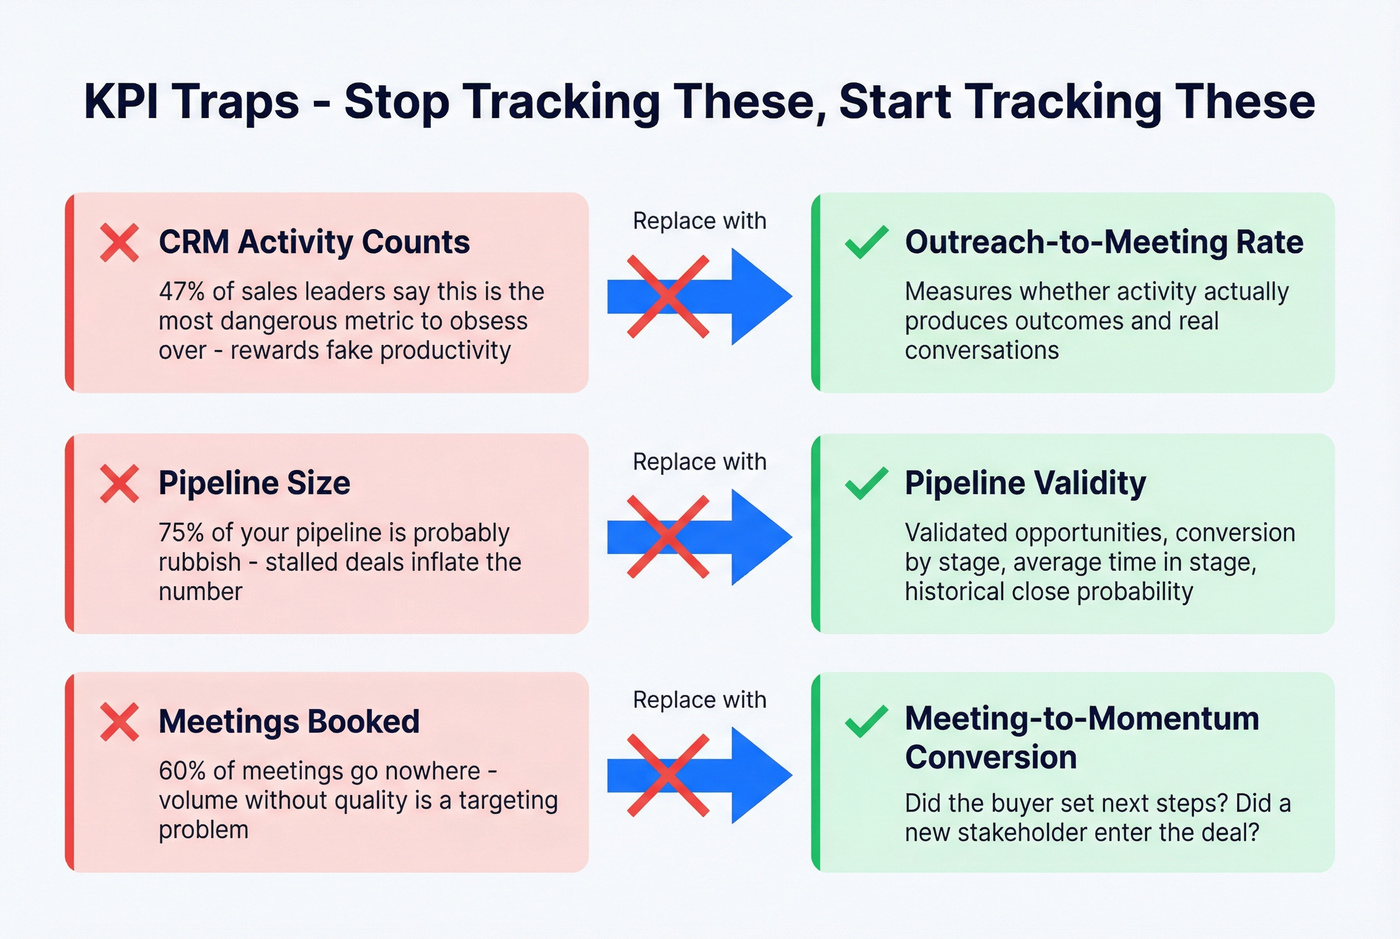
CRM activity counts reward fake productivity. Reps learn to log calls, send templated emails, and hit their "50 touches a day" target without a single meaningful conversation. Replace with outreach-to-meeting rate - it measures whether activity produces outcomes. If you're rebuilding outbound, use a sales cadence that ties touches to conversion.
Pipeline size is the most dangerous number in sales. As one practitioner put it, "75% of your sales pipeline is rubbish." A $4M pipeline with 20% of deals stalled past their expected close date is really a $1.5M pipeline. Replace with pipeline validity: validated opportunities, conversion by stage, average time in stage, and historical close probability. Those are the metrics that tell you whether pipeline is real or inflated. (For common failure modes, see sales pipeline challenges.)
Meetings booked sounds productive until you realize 60% went nowhere. Replace with meeting-to-momentum conversion - did the buyer set next steps? Did a new stakeholder enter the deal? In our experience, teams who make this switch start seeing pipeline quality improve within a single quarter.
Skip vanity metrics entirely if you're a small team. They'll eat your review time and produce zero insight.
Activity KPIs are fiction when reps dial disconnected numbers and email bounced addresses. Prospeo delivers 98% email accuracy and 125M+ verified mobiles so every logged touch reflects a real conversation - not a phantom metric inflating your dashboard.
Stop measuring activity against bad data. Measure it against verified contacts.
How to Run KPI Reviews
Match the cadence to the metric's time horizon:
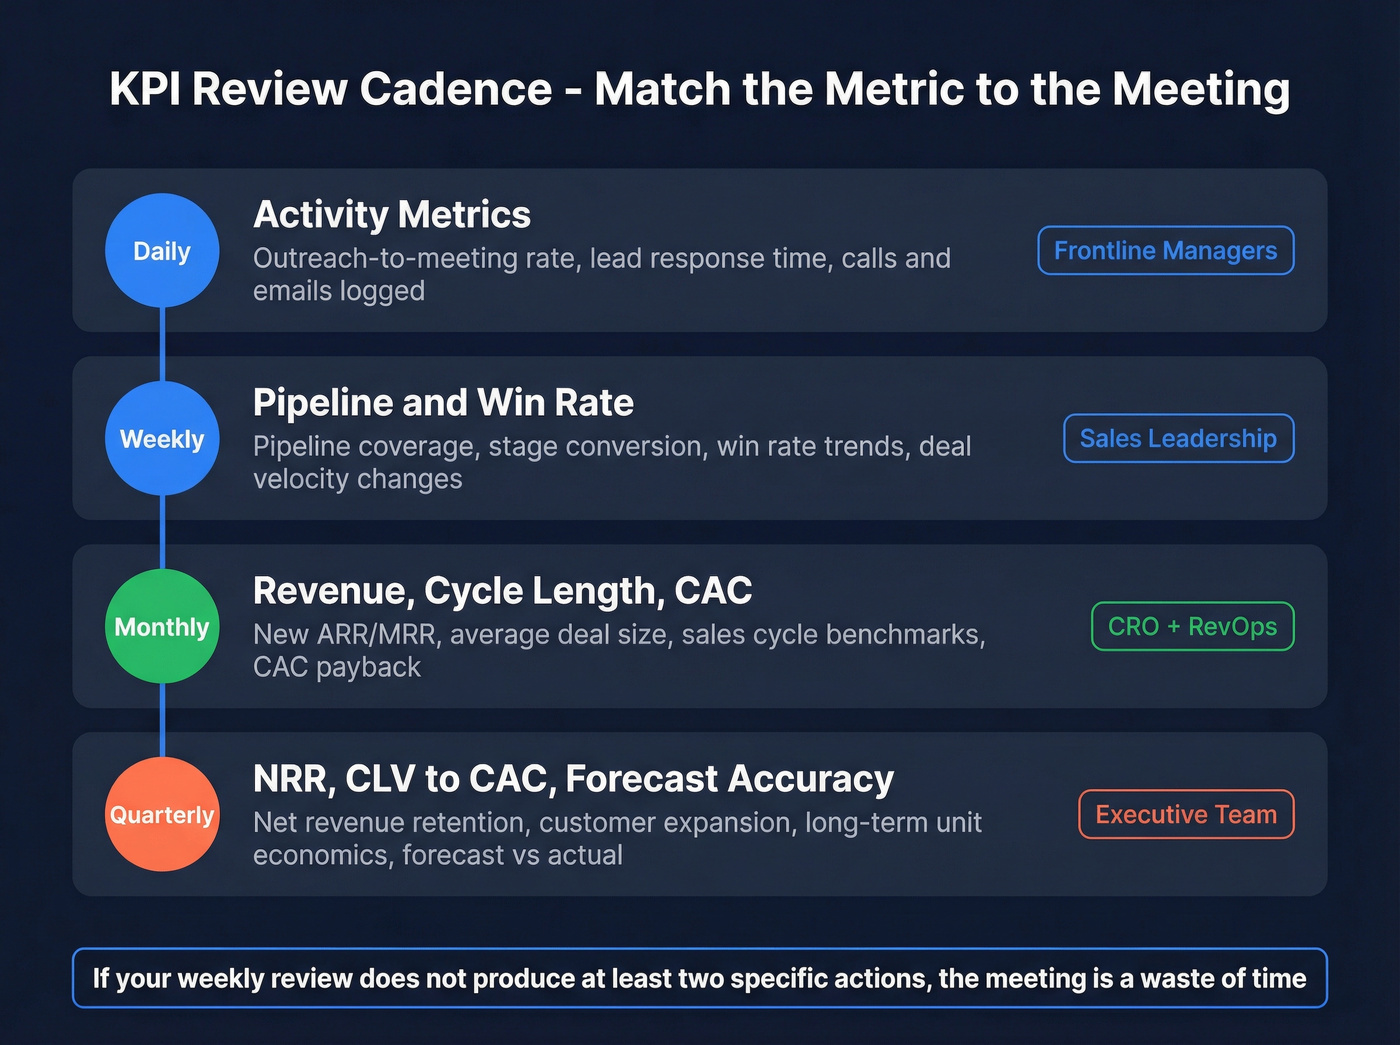
| Cadence | What to Review | Who's in the Room |
|---|---|---|
| Daily | Activity metrics | Frontline managers |
| Weekly | Pipeline, win rate | Sales leadership |
| Monthly | Revenue, cycle, CAC | CRO + RevOps |
| Quarterly | NRR, CLV:CAC, forecast | Executive team |
One operational detail most teams miss: cohort your data. Intercom's sales team uses cohorting for exactly this reason - newer cohorts always show lower conversion rates because leads haven't had time to progress through the funnel. Comparing January's cohort to March's in April makes March look terrible. That's not a performance problem; it's a math problem.
If your weekly review doesn't produce at least two specific actions - a deal to accelerate, a rep to coach, a segment to deprioritize - the meeting is a waste of everyone's time. If forecasting is consistently off, add a deal forecast accuracy check to the agenda.
Choosing the Right Metrics for Your Team
Not every KPI belongs on every dashboard. The right B2B sales KPIs depend on your go-to-market motion, deal complexity, and growth stage. A PLG-led startup selling $5K contracts needs a radically different scorecard than an enterprise team running six-month procurement cycles.
Start by identifying your biggest revenue bottleneck - not enough pipeline, poor conversion, or deals that stall - and weight your KPIs accordingly. For teams drowning in unqualified pipeline, obsess over win rate and meeting-to-opportunity conversion. For teams with strong conversion but thin pipeline, focus on coverage and outbound activity quality.
Data Quality - The KPI Prerequisite
Your SDR team logged 200 outbound calls last week. But 30% of those numbers were disconnected, and 15% of the contacts had changed jobs. Your real activity was 110 calls - and your "4x pipeline coverage" is built on contacts who can't be reached.
The dashboard lied because the data underneath was rotten.
We've seen this pattern repeatedly. Teams invest in Gong, Clari, and polished Salesforce dashboards - then feed them stale data. Every metric on this page is only as good as the contact and account data underneath it. Prospeo refreshes contact data every 7 days (versus the 6-week industry average), delivering 98% email accuracy, a 92% API match rate, and an 83% enrichment match rate. When the underlying data is clean, your pipeline coverage number reflects real opportunities with reachable buyers - not phantom deals. (If you want a system for this, use a CRM verify workflow.)
Pipeline velocity depends on four variables - but none of them matter if your qualified opportunities are built on stale data. Prospeo refreshes every record on a 7-day cycle, so your pipeline coverage ratio reflects real buyers, not ghost prospects from six weeks ago.
Your pipeline KPIs are only as current as your data. Refresh every 7 days.
AI-Driven KPIs for 2026
Only 45% of sales leaders have high confidence in their forecasting accuracy. AI is closing that gap - McKinsey reports AI-driven forecasting reduces errors by 20-50%, and AI-powered sales automation cuts cycle time by 28%.
Three emerging KPIs worth adding to your dashboard this year:
- Deal risk score - probability a deal slips or dies, based on engagement patterns
- Predictive close rate - AI-adjusted win probability that updates in real time
- Forecast accuracy - how close your calls were to actual outcomes, tracked over rolling quarters
Gartner projects that by 2026, 35% of CROs will have or be building GenAI operations teams, and 64% of B2B companies expect to increase investments in predictive analytics. The shift is real, but it depends on data quality. AI models trained on stale CRM data produce stale predictions - the "garbage in, garbage out" problem doesn't disappear because you added a machine learning layer. It gets amplified. (For a practical implementation view, see AI sales analytics.)
FAQ
What's the difference between a sales KPI and a sales metric?
A KPI is a metric tied to a specific business goal with a defined target and review cadence. All KPIs are metrics, but not all metrics are KPIs. Your win rate with a 30% target reviewed weekly is a KPI your team acts on. The number of emails sent on Tuesday is just a metric - and probably a vanity one.
How many B2B sales KPIs should I track?
Five to seven. Teams in that range hit 91% average quota attainment versus 73% for teams tracking fewer than three. Start with pipeline coverage, win rate, cycle length, deal size, and new ARR - then add one or two based on your biggest bottleneck.
What's a good win rate for B2B sales?
The average B2B win rate falls between 20-30%. Best-in-class teams hit 35-40%+. Segment matters - a 15% enterprise win rate can outperform a 35% SMB win rate on revenue because deal sizes compensate.
How often should I review sales KPIs?
Activity metrics daily, performance metrics weekly, strategic metrics monthly or quarterly. Reviewing NRR daily is pointless; ignoring pipeline velocity for a month is dangerous. Match cadence to the metric's decision horizon.
How does data quality affect B2B sales KPIs?
Bad data inflates pipeline coverage and distorts conversion rates - you think you have 4x coverage when it's really 1.5x. A 7-day data refresh cycle and verified contact records keep CRM data current, so your KPIs reflect reality rather than phantom opportunities built on stale records.