Revenue Growth Strategy: What Actually Works (2026 Benchmarks)
The typical company grows 2.8% per year. That's not a guess - it's what McKinsey found analyzing 5,000 of the world's largest public companies across 2005-2019. Only 1 in 8 broke 10% annual growth. And of those that hit top-quartile growth, only 1 in 3 sustained it into the next five-year period. The math is brutal, and most revenue growth strategy advice ignores it entirely.
Here's the thing: if you only have 60 seconds, pick one lever (expansion revenue is the most underrated), resource it properly, and fix your pipeline data before scaling outbound.
Why Revenue Growth Matters
Revenue growth rate is straightforward arithmetic: (current period revenue - previous period revenue) / previous period revenue x 100. The number itself isn't interesting. What it correlates with is.
BCG's research shows revenue growth drives 32-56% of total shareholder return depending on the time horizon. McKinsey puts a finer point on it: every +5 percentage points of revenue growth correlates with +3-4 percentage points of TSR, compounding to 33-45% higher market cap over a decade. And here's the kicker - more than one-third of companies deliver below-median TSR despite growing faster than inflation. Revenue growth isn't a vanity metric. It's the single biggest driver of enterprise value creation. But growth without the right approach can destroy value just as easily.
2026 Benchmarks to Anchor Against
"Good" growth depends entirely on your stage, sector, and starting point. But you need numbers to anchor against.
| Metric | 25th %ile | Median | 75th %ile |
|---|---|---|---|
| Annual Revenue Growth (SaaS) | 15.25% | 28.29% | 65.40% |
| Net Revenue Retention | - | 101% | - |
| New CAC Ratio | - | $2.00 | $2.82 (Q4) |
| Expansion ARR (% of New ARR) | - | 40% | 58% ($50M-$100M) |
| Revenue Churn | - | 12.50% | - |
| S&M Multiple | - | 3.19 | - |
SaaS benchmarks from Lighter Capital's 155-company dataset and BenchmarkIt's report. Outside SaaS, mature industries like manufacturing and professional services typically grow in the low single digits, while AI-exposed categories often run 15-25%.
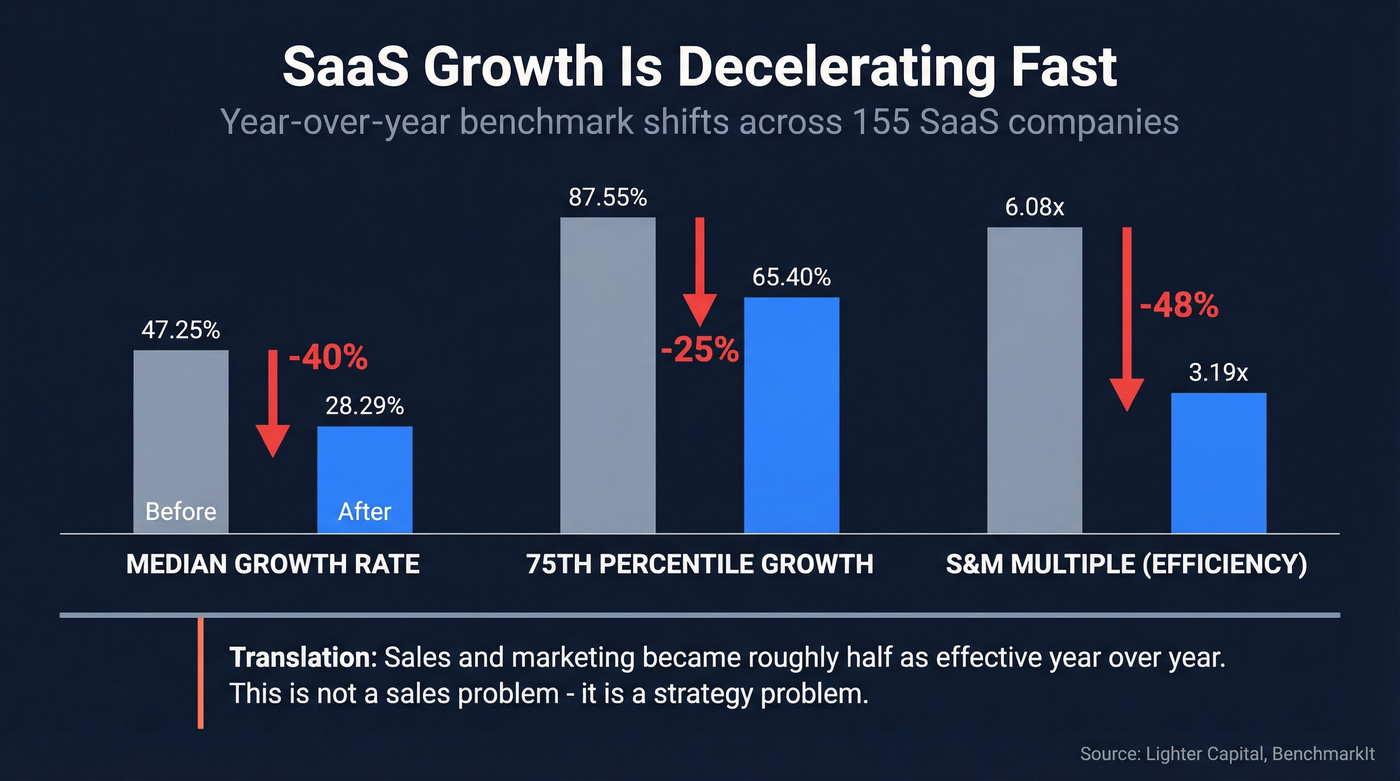
The deceleration story is the real headline. Median SaaS growth dropped from 47.25% to 28.29% year over year. The 75th percentile fell from 87.55% to 65.40%. We've benchmarked dozens of B2B teams against these numbers, and the pattern is consistent - if your board is asking why growth slowed, show them this table. The entire market shifted.
Now look at the efficiency side. The median S&M multiple collapsed from 6.08 to 3.19 - sales and marketing became roughly half as effective year over year. That's not a sales problem. That's a strategy problem. Teams that want to accelerate revenue in this environment need to rethink where every dollar goes.
One more lens: the Rule of 40 (revenue growth + EBITDA margin >= 40%). BCG benchmarked 107 PE-backed SaaS companies and found scale matters enormously.
| Revenue Scale | Rule of 40 Attainment |
|---|---|
| Under $30M | 9% |
| $30M-$80M | 22% |
| Over $80M | 26% |
Smaller companies struggle to hit Rule of 40 because they're still investing heavily without the margin base to offset it. Normal. But it means early-stage teams need to be even more disciplined about which growth lever they pick.
Choose Your Playbook by Starting Point
BCG studied 1,784 public companies over two decades and identified 330 "growth champions" - companies that beat their peers on revenue growth for five or more consecutive years. The uncomfortable finding: 57% of those champions outperformed the S&P 1200, but roughly 17% destroyed value.
Growth without the right strategy is dangerous.
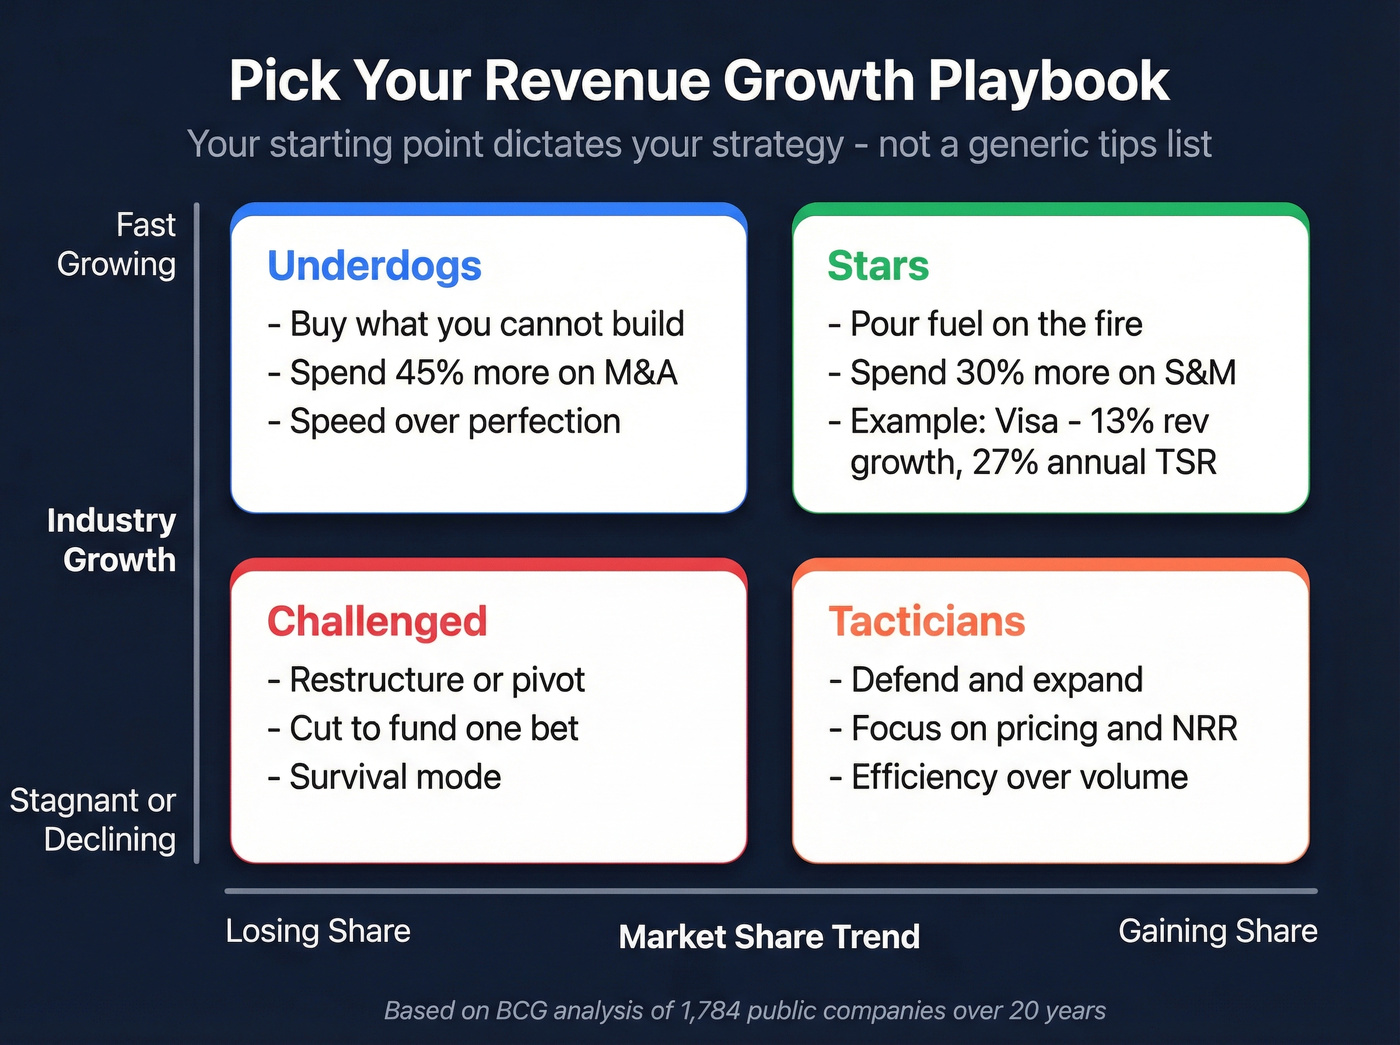
Your starting point dictates your playbook. BCG identifies six archetypes - Stars, Underdogs, Incumbents, Challenged, Tacticians, and Expanders - but the key decision axis is simple: are you gaining or losing share, and is your industry growing or stagnant? A company like Visa, which grew revenue 13% per year in a 7% industry and delivered 27% annual TSR from 2008-2018, needs a fundamentally different approach than a company losing share in a flat market.
Stars - companies gaining share in fast-growth industries - typically spend 30% more on sales and marketing as a percentage of revenue. They're pouring fuel on a fire that's already burning. Underdogs spend 45% more on M&A. They're buying what they can't build fast enough.
Let's be honest: generic "10 tips for revenue growth" articles are the opposite of strategy. Strategy is choosing what NOT to do. If you're an underdog, doubling your content marketing budget isn't a strategy. If you're a star, a massive acquisition probably isn't either. Match the lever to the starting point.
The article says it: ICP discipline before channel expansion. Prospeo's 30+ search filters - buyer intent, technographics, headcount growth, funding - let you define and saturate your ICP with surgical precision. 98% verified emails. $0.01 per lead. No contracts.
Stop spraying. Start saturating your best-fit segment.
The Five Levers That Actually Drive Revenue
Pick one or two based on your starting point. Ignore everything else for 12 months.
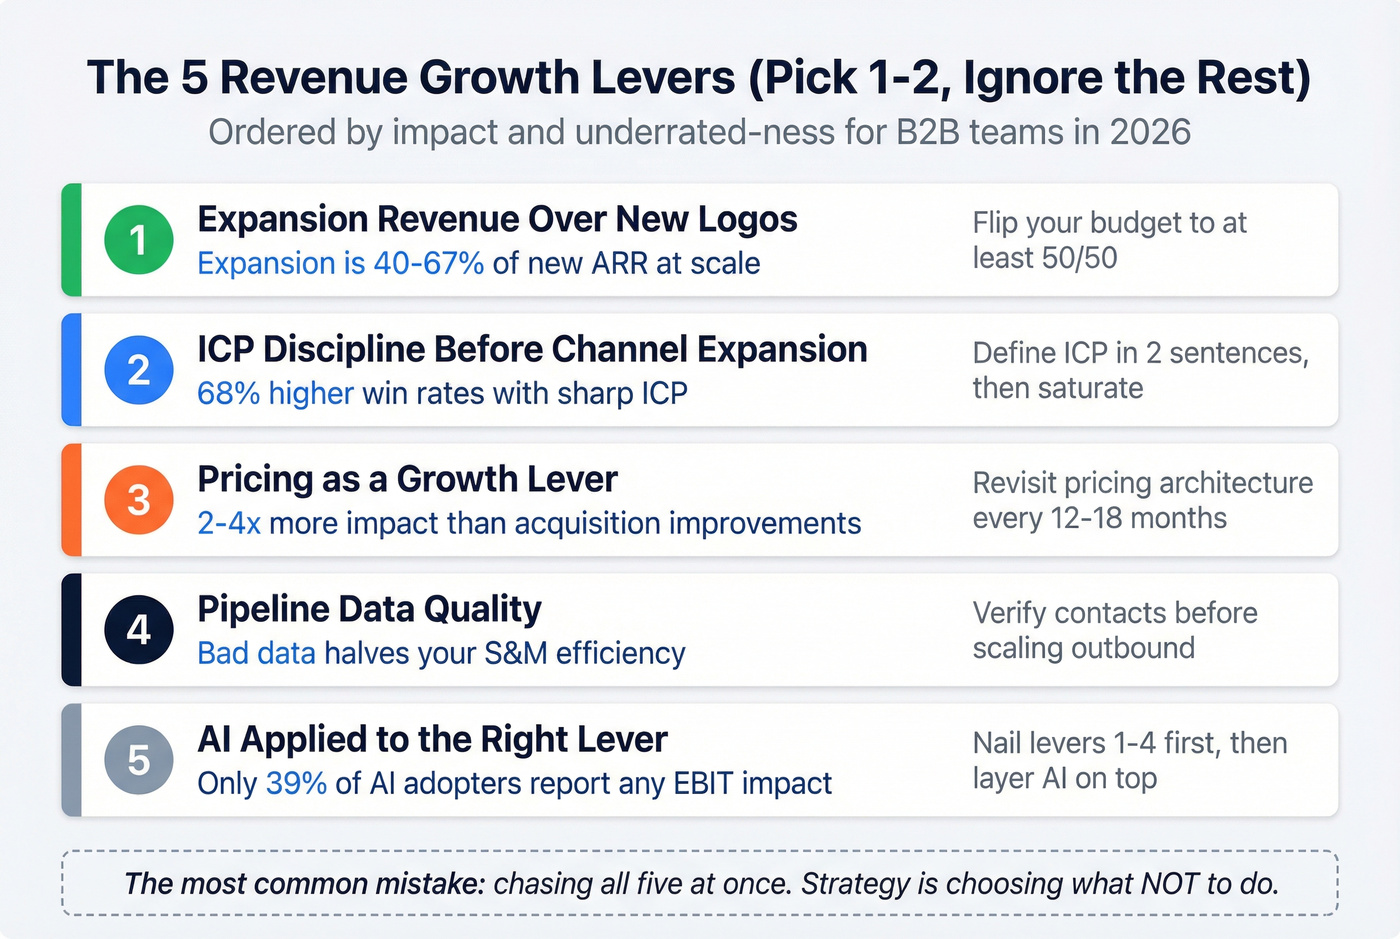
1. Expansion Revenue Over New Logos
This is the most underrated lever in B2B, and it frustrates me how often it gets deprioritized in favor of flashy new-logo campaigns that cost five times more per dollar of ARR. At the median, expansion ARR accounts for 40% of total new ARR. For companies above $50M, that number climbs past 58%, reaching 67% for companies above $100M. Top performers like Snowflake exceed 120% NRR, growing even if they never close another new deal. Companies above 100% NRR grow at twice the rate of peers below that threshold.
If you're spending 80% of your budget on new logo acquisition and 20% on expansion, you've got the ratio backwards. Flip it - or at least get to 50/50.
2. ICP Discipline Before Channel Expansion
Four in five companies don't have a clearly defined ICP, or their definition is so superficial it's useless. Companies with a sharp ICP see 68% higher win rates.
We've seen this pattern repeatedly: teams chase new channels before they've maxed out what's already working with their best-fit customers. ABM! PLG! Events! Define your ICP with enough specificity that your reps can describe the ideal buyer in two sentences, then saturate that segment before expanding. Skip this lever if your product-market fit is still shaky - ICP discipline only works when you know who you're disciplined about.
3. Pricing as a Growth Lever
Over 50% of innovations never meet their financial goals, and the root cause is usually pricing treated as an afterthought. GitHub Copilot is the textbook example - they moved from a single plan to tiered pricing to capture value across individual developers, teams, and enterprises.
Look, pricing is uncomfortable. Nobody wants to risk churn by raising prices. But if you haven't revisited your pricing architecture in 18+ months, you're leaving money on the table. A 5% price increase on existing customers often has more impact than a 15% increase in new logo volume. Patrick Campbell's research at ProfitWell backs this up - pricing improvements yield 2-4x the impact of acquisition improvements.
4. Pipeline Data Quality
Your revenue growth strategy dies at the execution layer if your outbound engine is built on bad contact data. The S&M multiple getting halved tells you that efficiency matters more than volume right now. Efficiency starts with data.
Snyk's outbound team was bouncing 35-40% of emails before switching to verified data from Prospeo. They cut that to under 5% and saw AE-sourced pipeline increase 180%, generating 200+ new opportunities per month. You can have the best ICP definition and the sharpest pricing in your market, and none of it matters if your reps are burning domain reputation on bad email addresses. The consensus on r/sales threads about outbound efficiency almost always circles back to data quality as the bottleneck - not messaging, not cadence length, not subject lines.
To keep your list clean at scale, use email verification for outreach and a repeatable CRM hygiene process.
5. AI Applied to the Right Lever
88% of companies use AI in at least one business function. Only 39% report any EBIT impact. AI isn't a strategy. AI applied to the right lever is.
The companies seeing revenue impact concentrate on sales/marketing execution and product development - not chatbots. Pick your growth lever first, then ask how AI accelerates it. If you haven't nailed levers 1-4, skip this one entirely.
Build the Org and Stack for Sustained Growth
Retention isn't a mindset - it's a headcount and tech stack decision. The data is unambiguous.
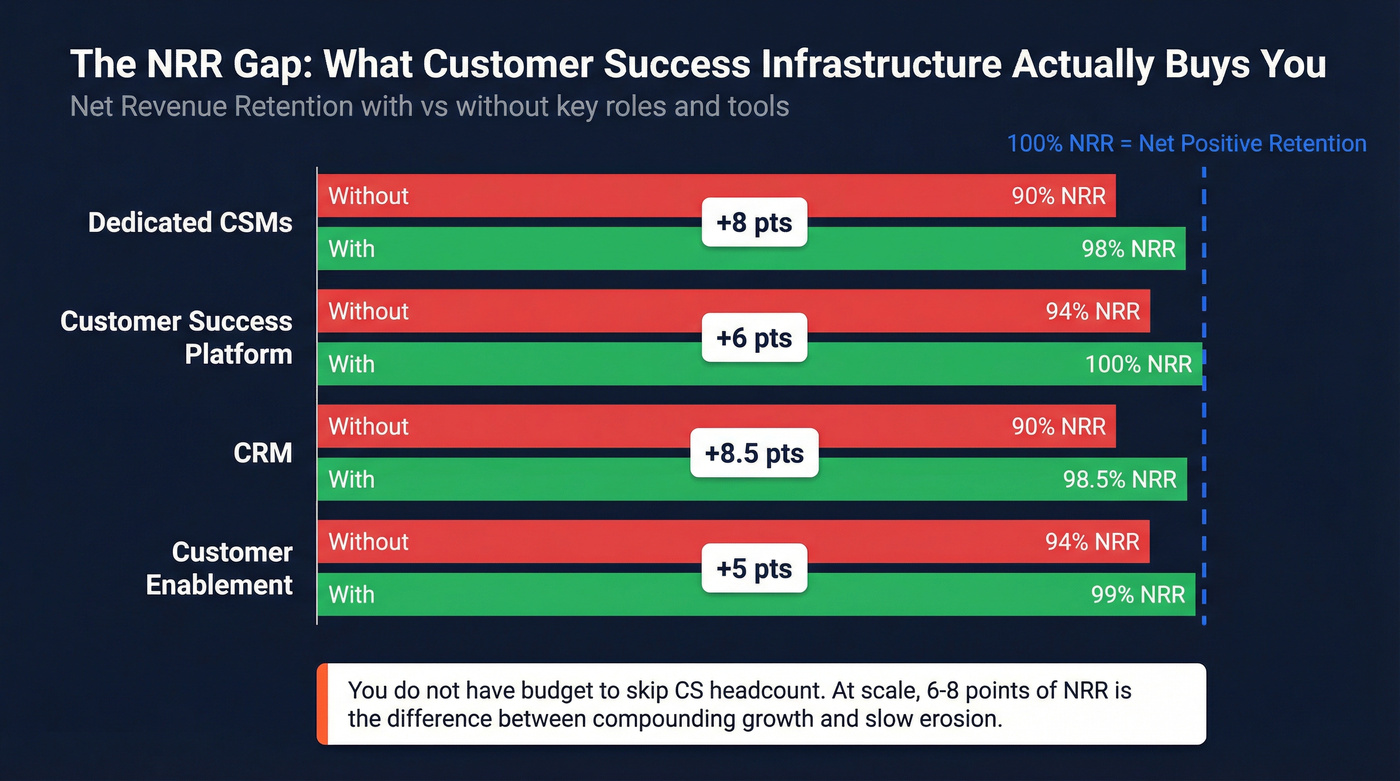
| Role/Tool | NRR With | NRR Without |
|---|---|---|
| CSMs | 98% | 90% |
| Customer Success Platform | 100% | 94% |
| CRM | 98.5% | 90% |
| Customer Enablement | 99% | 94% |
Companies with dedicated CSMs see 8 points higher NRR than those without. At scale, 6-8 points of NRR is the difference between compounding growth and slow erosion. The common refrain in revenue leadership communities - "we don't have budget for CS headcount" - misses the point entirely. You don't have budget not to.
The tech stack for retention-driven growth: CRM (non-negotiable), customer success platform, support tooling, and a data enrichment layer to keep your CRM clean and identify expansion signals before customers raise their hand. A tool like Prospeo returns 50+ data points per contact at a 92% match rate, surfacing job changes, headcount growth, and funding signals that flag upsell timing without waiting for a hand-raise.
If you're building this as a system, start with revenue operations alignment and tighten your CRM lead source tracking so expansion and retention motions are measurable.
AI and Revenue Growth in 2026
AI adoption is broad. AI impact is not.
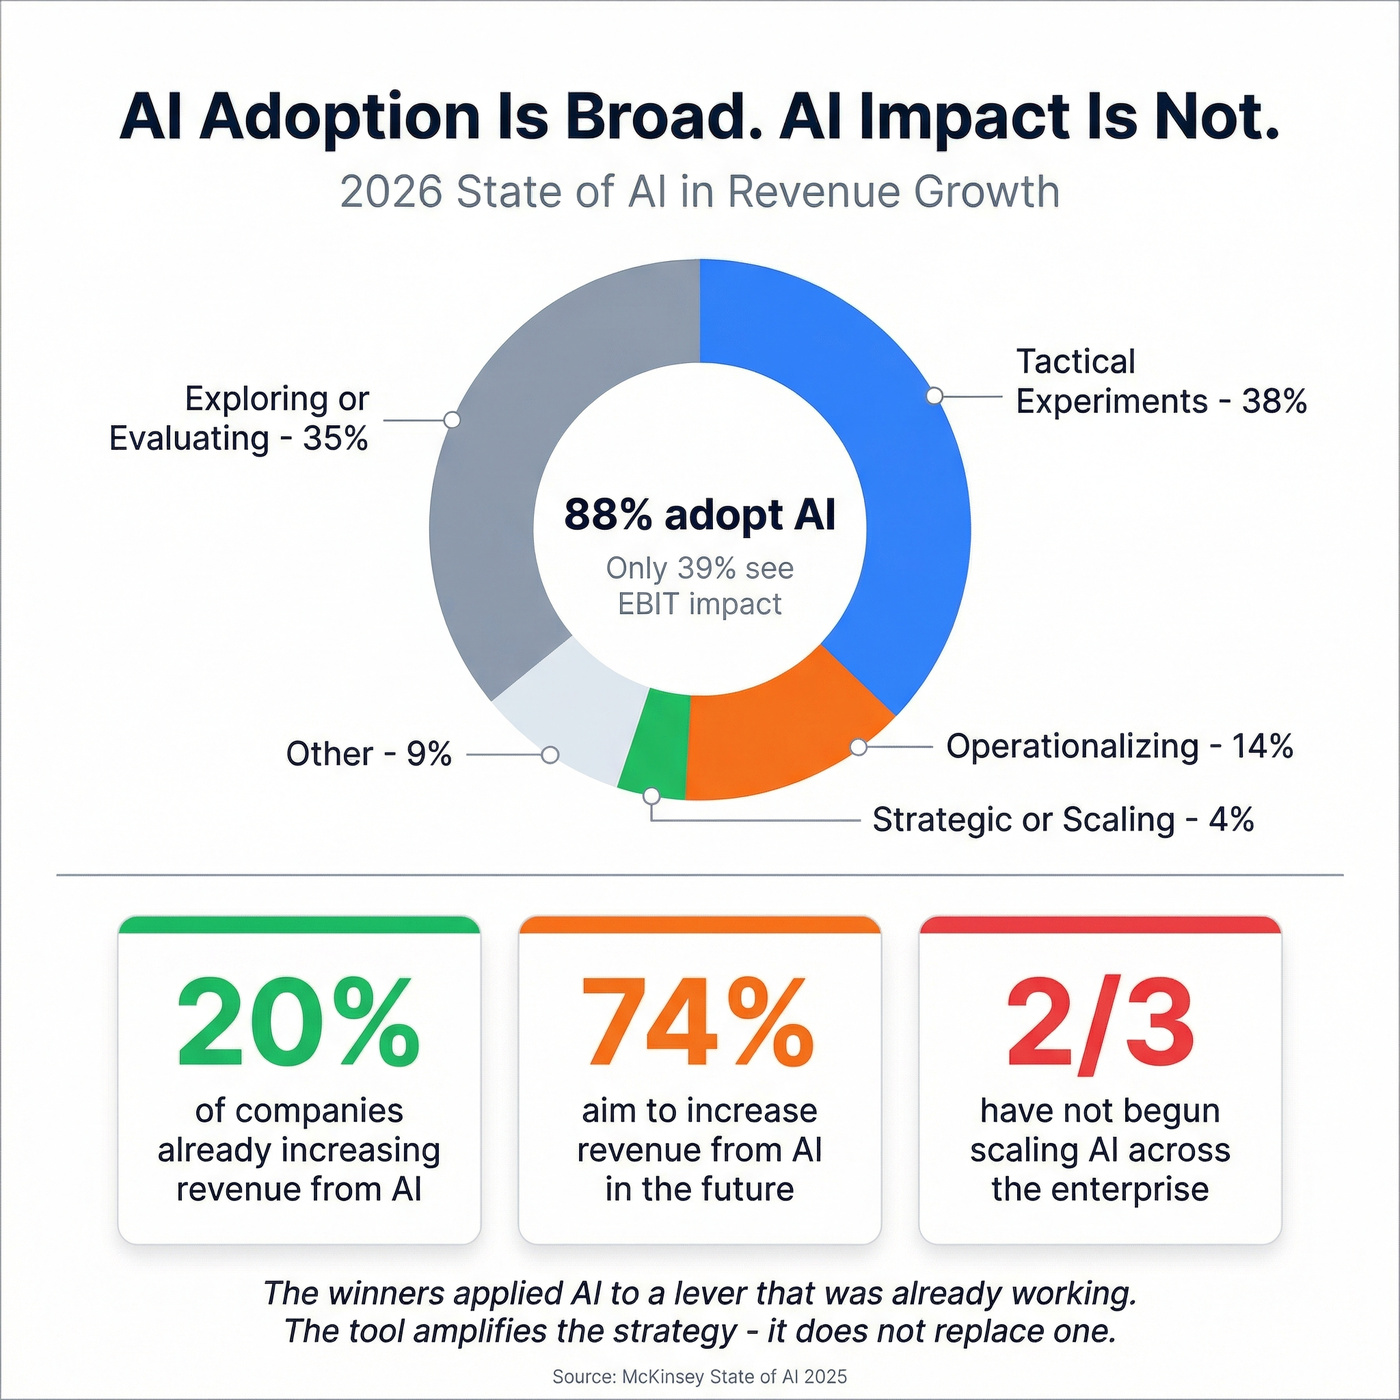
McKinsey's latest State of AI report shows 88% adoption but roughly two-thirds of companies haven't begun scaling AI across the enterprise. Worker access to AI rose 50% in 2025 alone. About 20% of companies already report increasing revenue from AI, while 74% aim to in the future. That's a lot of aspiration and not much execution.
The maturity distribution tells the story: 35% of companies are still exploring or evaluating AI, 38% are running tactical experiments, 14% are operationalizing, and just 4% have reached strategic or scaling status. One B2B company attributed $5.9M in revenue to an AI-augmented organic search strategy over 17 months - a 429% traffic increase from 4,973 to 26,313 organic users - but that's the exception, not the norm.
The companies seeing revenue impact from AI share one trait: they applied it to a lever that was already working. AI-powered lead scoring on top of a well-defined ICP. AI-assisted pricing optimization on top of a tested pricing architecture. AI-driven expansion signals on top of a functioning customer success org. The tool amplifies the strategy. It doesn't replace one.
If you're operationalizing this, treat it like AI lead qualification plus RevOps lead scoring, not a random set of prompts.
Five Mistakes That Kill Growth Momentum
No shared objectives across functions. Sales optimizes for new logos, product optimizes for usage, CS optimizes for renewal. Nobody's optimizing for revenue growth. In our experience, the teams that stall aren't the ones picking the wrong lever - they're the ones picking five.
Going broad before going deep. Launching three new channels when you haven't saturated your best one is a resource allocation failure disguised as ambition.
Obsessing over new customers while ignoring VIPs. Your top 20% of customers drive a disproportionate share of revenue and expansion potential. Treating them the same as everyone else is a strategic mistake that compounds quarter over quarter.
Tracking metrics that don't drive momentum. Less than 25% of growth experiments yield positive results. If you're measuring activity instead of learning velocity, you'll optimize for busywork. Focus on metrics that tell you what to do next, not metrics that make dashboards look full.
Treating growth like a hard science. Over-reliance on A/B testing and quantitative frameworks misses the qualitative signals - customer conversations, market shifts, competitive moves - that actually inform strategy. The best growth operators blend data with judgment. The spreadsheet tells you what happened. The customer call tells you what's about to.
If you want a practical diagnostic, map your bottlenecks against common sales pipeline challenges before you add more channels.
Section 4 of every revenue growth strategy is pipeline data quality - and it's where most teams silently bleed. Prospeo refreshes 300M+ profiles every 7 days (not 6 weeks). Bounce rates drop below 4%. Teams using Prospeo book 26% more meetings than ZoomInfo users.
Bad data is the silent killer of your growth levers. Fix it now.
FAQ
What should a revenue growth strategy target in 2026?
For private B2B SaaS startups, the median annual growth rate is 28.29%. Large public companies across industries average 2.8% per year. The 75th percentile for SaaS is 65.40%, while only 1 in 8 large public companies exceeds 10%. Benchmark against your cohort, not an arbitrary target.
What's the most underrated growth lever?
Expansion revenue from existing customers. At the median, expansion ARR accounts for 40% of total new ARR - rising above 58% for companies past $50M. Companies with dedicated CSMs see 98% NRR versus 90% without. Flipping your investment ratio toward retention and upsell is often the fastest path to compounding revenue.
How does pipeline data quality affect revenue?
Directly and measurably. Snyk cut bounce rates from 35-40% to under 5% using verified contact data and saw AE-sourced pipeline increase 180%, generating 200+ new opportunities per month. When your data refreshes every 7 days instead of the 6-week industry average, your outbound engine stays efficient instead of burning sender reputation on stale addresses.
What are the most effective B2B growth levers?
The five that consistently move the needle are expansion revenue, ICP discipline, pricing optimization, pipeline data quality, and AI applied to an already-working lever. The key is picking one or two based on your starting point - not running all five simultaneously. Companies that focus resources on the right lever for their archetype outperform those spreading effort across every tactic they read about.