SaaS Customer Journey Mapping: The Guide With Actual Benchmarks
Your trial-to-paid conversion is sitting at 8%, and nobody on the team can explain why. Marketing says the leads are good. Product says the onboarding flow is fine. CS says users just "go dark." The real problem? Nobody's mapped the actual experience between those handoffs.
Companies that skip SaaS customer journey mapping lose 15-20% of potential revenue growth because they can't see where conversions and upsells fall apart. Practitioners on r/SaaS and r/AskMarketing keep asking the same question: "Where do I even start?" This guide answers with benchmarks, dollar figures, and a 30-minute method you can use today.
Start Here: The Quick Version
Don't map the whole journey at once. Pick the stage that's bleeding the most revenue - usually onboarding-to-activation or renewal. Open a spreadsheet. Give yourself 30 minutes. Map that single stage with real metrics, not assumptions. Then expand. The benchmarks and steps below tell you exactly what "good" looks like at every stage.
What Is a SaaS Customer Journey Map?
A SaaS customer journey map is a visual representation of every touchpoint, emotion, and decision a customer experiences - from first hearing about your product through renewal and advocacy. It's not a sales funnel. A funnel tracks pre-sale conversion stages. A journey map covers the full lifecycle, including the post-sale experience where SaaS companies actually make or lose money.
Some frameworks break this into seven stages - RampIQ, for example, separates Referral and Revenue into their own phases. We use five stages here because merging those into Advocacy and Retention keeps the map actionable without losing granularity. SaaS journeys are distinct because free trials, self-serve onboarding, and recurring revenue cycles create touchpoints that don't exist in traditional B2B. Renewal isn't a one-time event. It's a continuous decision your customer makes every month or year.
Why Mapping the Journey Matters
That 15-20% revenue growth loss isn't abstract. It shows up as churned accounts nobody saw coming, expansion deals that never materialized, and onboarding flows that silently kill activation.
Revenue leak identification. You can't fix a drop-off you can't see. Mapping reveals exactly where users stall between stages - and what it costs you in ARR.
Cross-team alignment. Marketing, sales, product, and CS stop arguing about whose fault churn is. The map makes handoff failures visible and assigns ownership.
Retention economics. Net revenue retention is the metric investors care about most. Journey maps connect user experience to NRR by showing which moments drive expansion and which trigger cancellation. If you're pressure-testing churn drivers, pair this with a proper churn analysis.
Actionable change, not wall art. Gartner found that nearly a third of organizations use journey maps - but most struggle to turn them into meaningful change. The difference is maps built on real data with assigned owners versus sticky-note exercises that gather dust.
The 5 B2B SaaS Journey Stages (With Benchmarks)
Most journey frameworks list stages without telling you what "good" looks like. These benchmarks come from Userpilot's analysis of 547 SaaS companies and SaaS Capital's retention data, supplemented with churn data from industry reports.
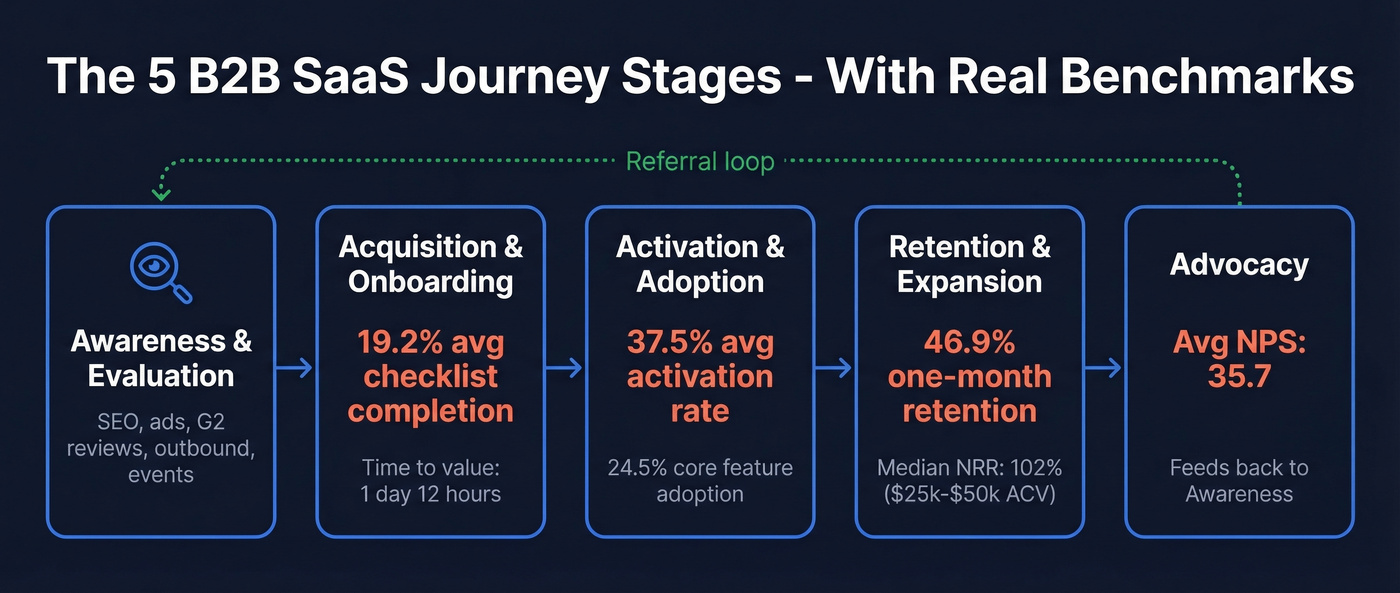
Awareness & Evaluation
This is where prospects discover your product and decide whether it's worth their time. Key touchpoints include content marketing, paid ads, review sites like G2, outbound email, events, and word-of-mouth referrals. The touchpoints differ dramatically by motion - PLG companies lean on organic search, free tool pages, and community, while sales-led companies add SDR outreach, demo requests, and multi-threaded account engagement. If you want a tighter top-of-funnel view, map this stage alongside your funnel metrics.
Acquisition & Onboarding
The prospect becomes a user. Trial-to-paid conversion typically falls in the 5-25% range for self-serve trials and freemium motions. For opt-in free trials requiring a credit card, it can reach 20-60%. The range is wide because onboarding quality makes or breaks this stage.
The benchmarks are sobering. Average onboarding checklist completion sits at just 19.2%, meaning over 80% of new users don't finish the setup flow you designed for them. Average time-to-value is 1 day and 12 hours. If your product takes longer than that to deliver an "aha" moment, you're losing users before they ever experience what you built.
Activation & Adoption
Activation is the moment a user does the thing that predicts they'll stick around. The practical way to identify it: find the action that correlates most strongly with 30-day retention. That's your aha moment, and your customer health score should weight it heavily.
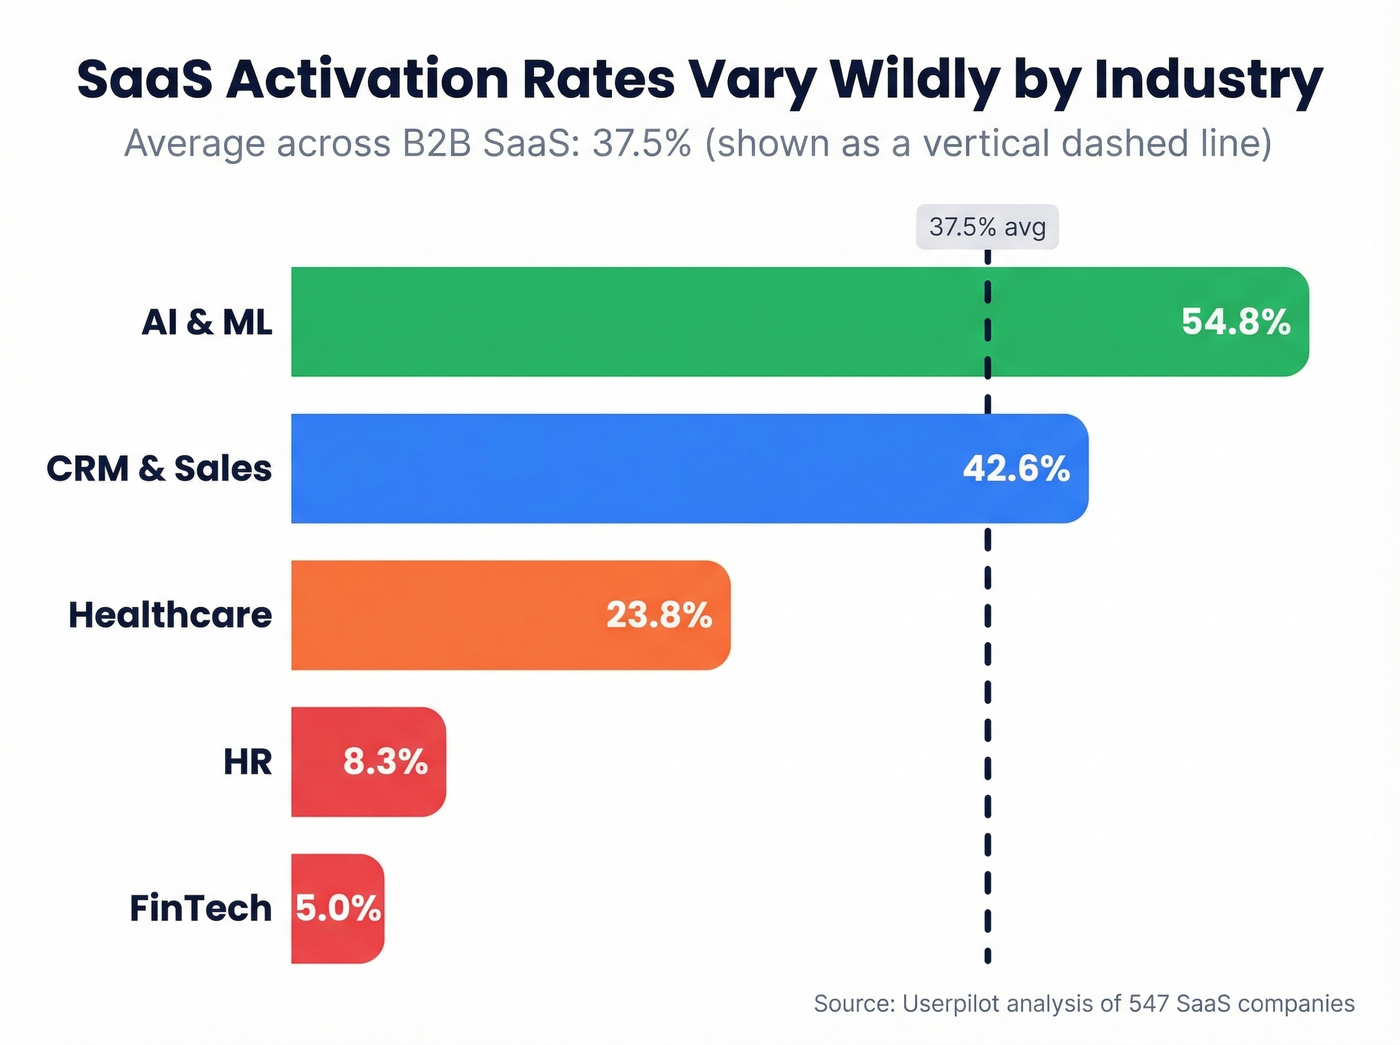
Average activation rate across B2B SaaS is 37.5%. But industry variation is massive:
| Industry | Activation Rate |
|---|---|
| AI & ML | 54.8% |
| CRM & Sales | 42.6% |
| Healthcare | 23.8% |
| HR | 8.3% |
| FinTech | 5.0% |
Core feature adoption averages just 24.5%. Three-quarters of your users aren't engaging with the features you consider essential. If your journey map doesn't track activation and feature adoption separately, you're flying blind.
Retention & Expansion
This is where SaaS economics are won or lost. One-month retention averages 46.9% - more than half of users are gone within 30 days. Average B2B SaaS monthly churn runs 3.5%, split between 2.6% voluntary and 0.8% involuntary.
That voluntary vs. involuntary distinction matters for mapping. Voluntary churn - users choosing to leave - requires different interventions than involuntary churn from failed payments and expired cards. Your customer success team should track both separately on the map. To benchmark and improve this stage, use a clear renewal rate definition and reporting cadence.
For expansion, the numbers get specific. SaaS Capital's data shows that companies in the $25k-$50k ACV range hit a median NRR of 102%, with top quartile at 111% and bottom quartile at 97%. If your NRR is below 100%, your journey map's retention and expansion stages need immediate attention. Expansion mechanics also get clearer when you separate cross selling vs upselling in your map.
Advocacy
Average NPS across SaaS companies is 35.7. That's your baseline. Advocacy touchpoints include referral programs, case study participation, review site submissions, community engagement, and conference speaking.
The critical insight for mapping: advocacy feeds directly back into the awareness stage. A happy customer's G2 review becomes a prospect's first touchpoint. Your journey map should visualize this loop, not treat advocacy as a dead end.
Your awareness stage depends on outbound reaching real inboxes. Prospeo's 98% email accuracy and 7-day data refresh mean your SDRs connect with the right buyers - not bounced addresses that tank deliverability and skew your journey metrics.
Fix the top of your journey map with data that actually connects.
PLG vs. Sales-Led: Two Different Maps
The same SaaS product can have radically different journey maps depending on the go-to-market motion. Sapphire Ventures notes that PLG requires simpler packaging structures with fewer permutations, while sales-led adds operational complexity through deal desks, pricing exceptions, and CPQ workflows.
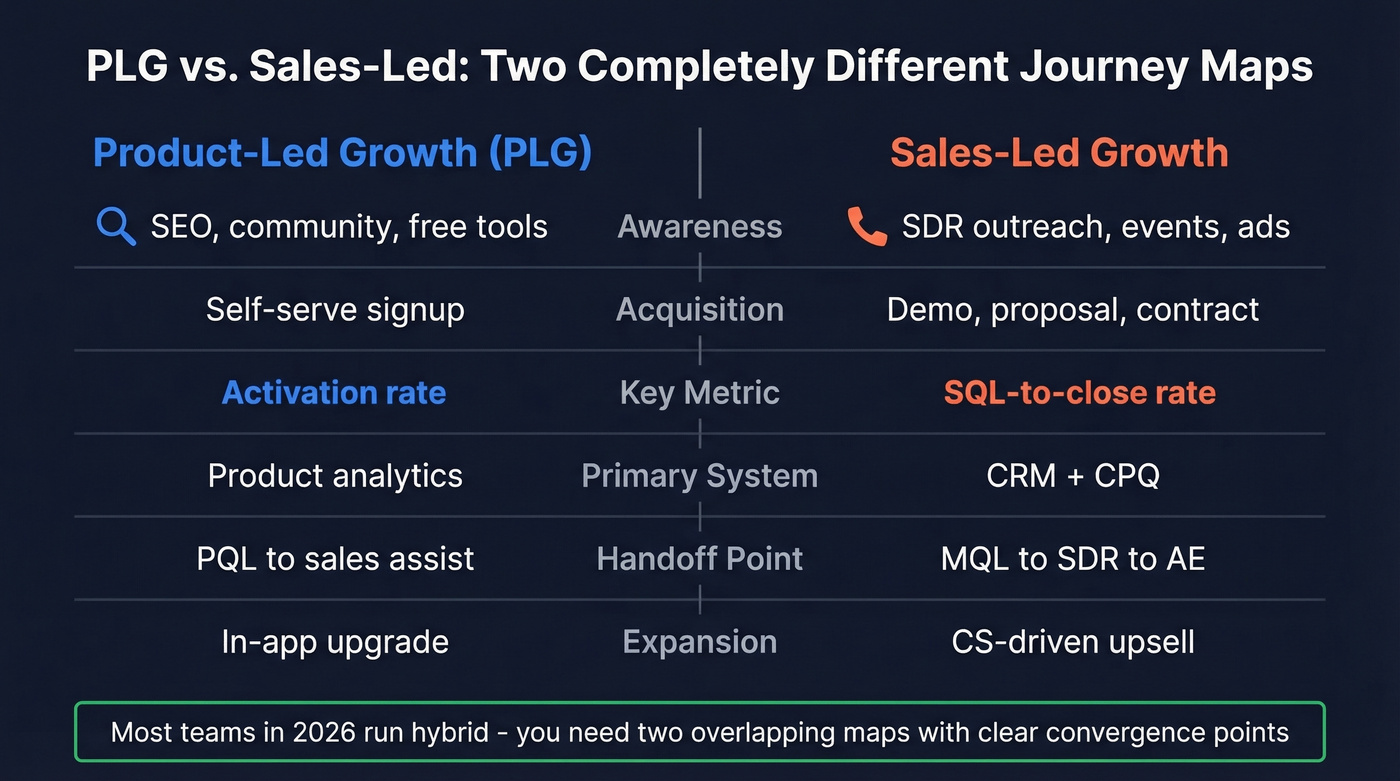
| Dimension | PLG | Sales-Led |
|---|---|---|
| Awareness | SEO, community, free tools | SDR outreach, events, ads |
| Acquisition | Self-serve signup | Demo → proposal → contract |
| Key metric | Activation rate | SQL-to-close rate |
| Primary system | Product analytics | CRM + CPQ |
| Handoff point | PQL → sales assist | MQL → SDR → AE |
| Expansion | In-app upgrade | CS-driven upsell |
In 2026, many teams run hybrid: PLG for initial acquisition with sales-assist for expansion. If you're running hybrid, you need two overlapping maps - one for the self-serve path and one for the sales-assisted path - with clear handoff points where they converge.
Let's be honest: if your deal size is below $10k annually, you probably don't need a sales-led journey map at all. PLG with a product-qualified lead handoff to a lightweight sales assist often beats a full sales cycle at that price point. Most teams try to force one map onto both motions and end up with a document that describes neither accurately. If you're formalizing the handoffs, a RevOps Manager (or equivalent) usually ends up owning the system.
How to Build Your Map in 7 Steps
1. Start With One Bleeding Stage
The biggest mistake is trying to map everything at once. Pick the stage that's costing you the most revenue. For most SaaS companies, that's onboarding-to-activation or renewal. We've found that the 30-minute single-stage exercise produces more actionable insights than a two-day workshop with sticky notes.
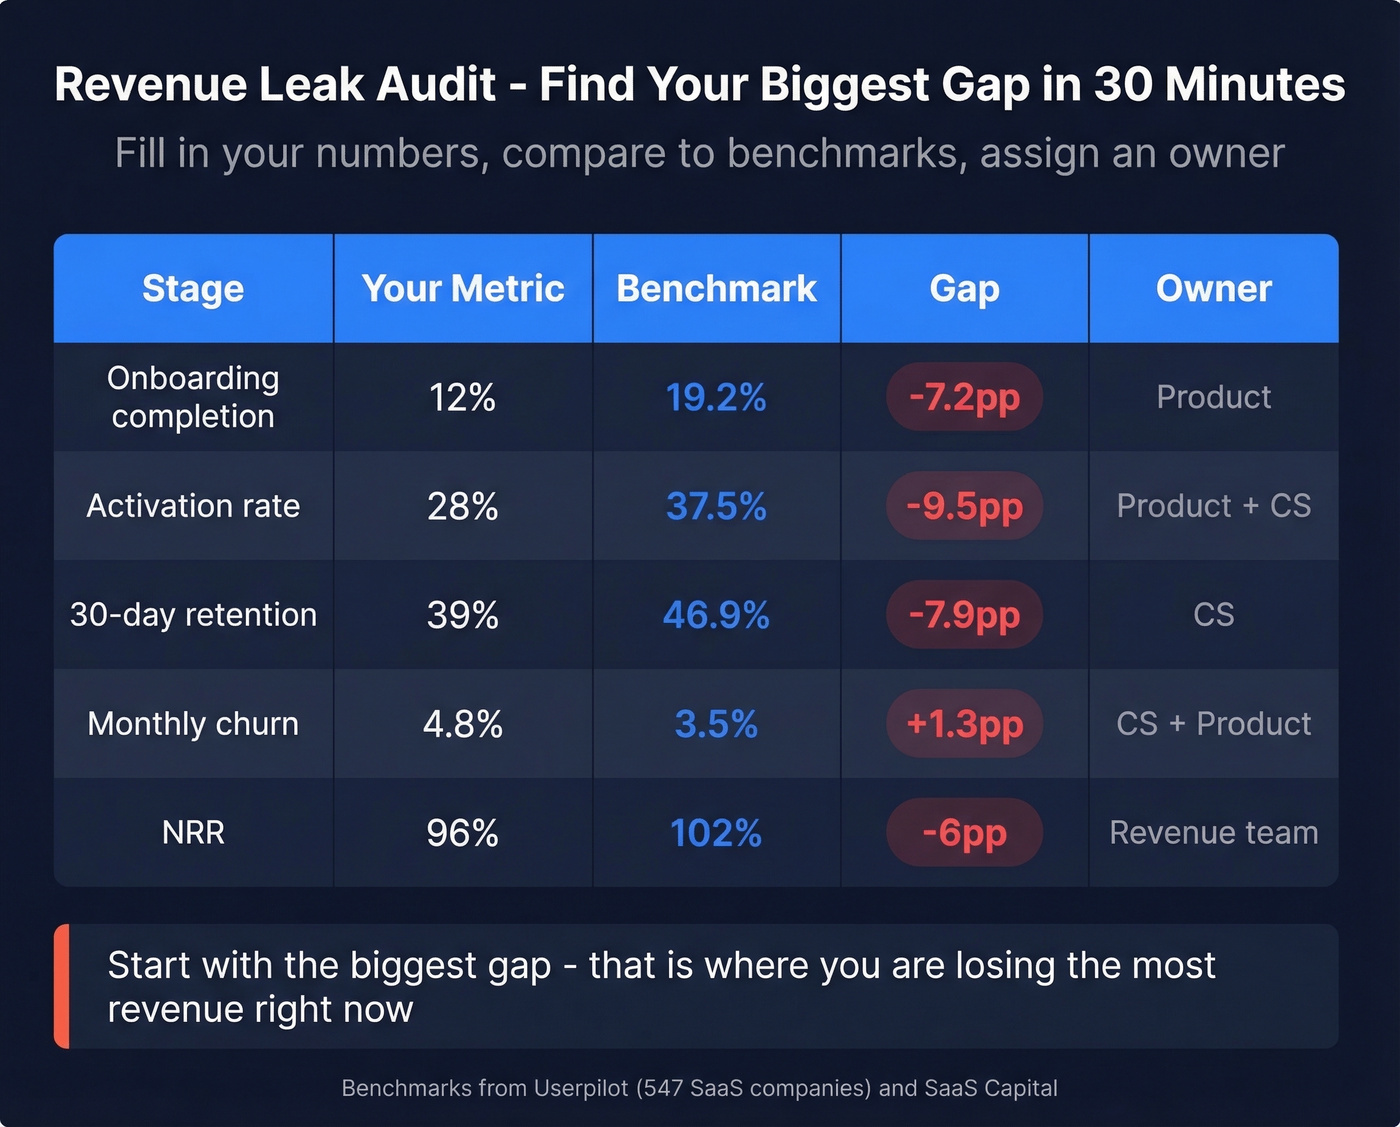
Use what we call the Revenue Leak Audit - a five-column spreadsheet that forces specificity:
| Stage | Your Metric | Benchmark | Gap | Owner |
|---|---|---|---|---|
| Onboarding completion | 12% | 19.2% | -7.2pp | Product |
| Activation rate | 28% | 37.5% | -9.5pp | Product + CS |
| 30-day retention | 39% | 46.9% | -7.9pp | CS |
| Monthly churn | 4.8% | 3.5% | +1.3pp | CS + Product |
| NRR | 96% | 102% | -6pp | Revenue team |
Fill in your numbers. The gaps tell you where to focus. The owner column tells you who's accountable. This is the single most useful artifact you'll produce - more useful than any wall-sized diagram.
2. Define Your ICP and Personas
B2B SaaS journeys involve multiple stakeholders with different experiences. The champion who found your product on G2 has a different journey than the economic buyer who only sees the security questionnaire and the pricing page. Map at least two personas: the end-user and the decision-maker. Their touchpoints, emotions, and friction points diverge at almost every stage, and recognizing that the B2B SaaS buyer journey often includes a buying committee - not a single decision-maker - keeps your map honest about the complexity of enterprise deals. If you need a starting point, use an Ideal Customer Profile Template and score each segment before you map.
3. Gather Quantitative + Qualitative Data
Quantitative sources: product analytics from Mixpanel or Amplitude, CRM data from HubSpot or Salesforce, billing system exports, feature usage logs.
Qualitative sources: session recordings in Hotjar or FullStory, support tickets, NPS verbatims, churn interview transcripts, sales call recordings.
Analytics show the drop-off. Session recordings and support tickets show the reason. Most teams over-index on one or the other.
4. Map Touchpoints Per Stage
List every interaction a customer has during the stage you're mapping. Include digital touchpoints like email sequences, in-app messages, and help docs alongside offline ones like sales calls, onboarding sessions, and events. Be exhaustive first, then prioritize. A typical SaaS journey spans email, in-app, chat, phone, review sites, and community forums - and missing even one channel creates a blind spot that'll haunt your retention numbers. If outbound is one of your touchpoints, keep a library of sales follow-up templates so the experience stays consistent across reps.
5. Add Emotions and Pain Points
This is where journey maps differentiate from funnels. At each touchpoint, document the user's emotional state. Confused during onboarding setup. Frustrated when a feature doesn't work as expected. Anxious at renewal when they're not sure the ROI justifies the cost. These emotions are the signals that tell you where to invest.
6. Assign Metrics and Owners
Every touchpoint needs a metric and an owner. ChurnZero's framework puts it simply: "Someone always owns the moment." Onboarding checklist completion is product's metric. Time-to-first-value belongs to CS. Trial-to-paid is marketing and sales jointly. If nobody owns it, nobody fixes it. For the acquisition stage, it helps to standardize your lead generation metrics so teams stop debating definitions.
7. Set a Review Cadence
Quarterly reviews are the minimum. Update immediately when you launch a new product line, enter a new segment, or change your GTM motion. One team on r/customerexperience described growing from 8 to 50+ people in 18 months and finding their static maps completely useless. We've seen the same pattern repeatedly - journey maps are living documents. Treat them like code: version them, review them, and deprecate the parts that no longer reflect reality.
5 Mistakes That Kill Your Map
Mapping everything at once. You'll spend weeks producing a beautiful wall-sized diagram that's too complex to act on. Start with one stage. Prove the value. Expand.
Building from assumptions, not data. The sticky-notes-in-a-workshop approach produces maps that reflect what the team thinks happens, not what actually happens. Onboarding checklist completion averages 19.2%. Pull the data first.
No ownership. Most organizations struggle to turn journey maps into meaningful change. The reason is almost always the same: nobody owns the map after the workshop ends. Assign a journey owner per stage with explicit accountability.
Static maps that break at scale. A map that works for an 8-person startup won't survive 50 people, three product lines, and two market segments. Build in a tool that supports branching paths and versioning - or at minimum, a shared spreadsheet that's easy to fork.
Insights too vague to act on. "Users are confused" isn't actionable. Use the "What / So What / Now What" structure from CustomerThink. What: 73% of users skip step 3 of onboarding. So what: They never configure integrations, which predicts churn. Now what: Redesign step 3 as a guided wizard with pre-built templates.
Journey Mapping Tools and Pricing
You don't need expensive software to start. But as your maps grow in complexity, dedicated tools earn their keep. Here's the 2026 pricing breakdown:
| Tool | Free Tier | Entry Paid | Mid Tier | Enterprise |
|---|---|---|---|---|
| Google Sheets | $0 | - | - | - |
| FigJam | $0 | $5/seat/mo | $5/seat/mo | $5/seat/mo |
| Miro | $0 | $8/mo/member | $16/mo/member | Custom |
| Lucidchart | $0 | $9/mo | $10/user/mo | Custom |
| Mural | $0 | $9.99/user/mo | $17.99/user/mo | Custom |
| UXPressia | $0 | $160/mo | $360/mo | Custom |
| Smaply | Free | ~$390/mo | ~$690/mo | ~$990/mo |
| Custellence | $0 | $1,999/mo | - | Custom |
| TheyDo | Free | $35,000/yr | - | Custom |
Best free start: Google Sheets or FigJam. A well-structured spreadsheet beats a fancy tool you don't know how to use.
Best dedicated tool: UXPressia - purpose-built for journey mapping, starts free, and the $160/mo starter plan covers most mid-size teams.
Best for team collaboration: Miro at $8/mo per member. Everyone already knows the interface, which means people actually use it.
Skip if you're under 20 people: TheyDo at $35,000/year is enterprise overkill for teams that don't yet have multiple journey maps across segments.
Journey mapping tools visualize the experience, but the experience starts with reaching the right person. Prospeo's B2B database covers 300M+ professional profiles on a 7-day refresh cycle, so the first touchpoint in your journey map starts with a verified contact - not a guess. The free tier gives you 75 verified emails per month, enough to validate your top-of-funnel data quality before committing. If you're building lists from multiple sources, consider adding data enrichment services to keep records consistent across systems.
If 80% of users don't finish onboarding, every lost lead hurts more. Prospeo gives you 300M+ verified profiles with 30+ filters - buyer intent, job changes, technographics - so you fill your funnel with prospects who match your ICP and actually activate.
Stop mapping journeys for the wrong prospects. Target buyers who convert.
FAQ
What's the difference between a journey map and a sales funnel?
A journey map covers the full post-sale lifecycle - onboarding, activation, retention, expansion, advocacy - and includes emotions and pain points at each stage. A sales funnel tracks pre-sale conversion only. For SaaS, where 70-80% of lifetime revenue comes from retention and expansion, the funnel captures only a fraction of the picture.
How often should I update my journey map?
Quarterly at minimum. Update immediately after launching a new product, entering a new segment, or changing your GTM motion. Teams that scale quickly - say from 10 to 50 people in a year - often find their original maps irrelevant within six months.
Do I need a dedicated journey mapping tool?
No. Start with a spreadsheet or FigJam for free. Move to UXPressia or Smaply only when you're managing multiple maps across segments and need versioning or branching paths. Teams under 20 people rarely need anything beyond Miro at $8/mo per member.
How does the B2B SaaS journey differ from B2C?
B2B SaaS involves longer sales cycles, multiple stakeholders in a buying committee, and post-sale revenue that often exceeds the initial contract value through expansion. Mapping means accounting for handoffs between marketing, sales, and CS that don't exist in most consumer products - plus renewal cycles that make retention the primary revenue driver.
How does data quality affect my map's accuracy?
Bad contact data - bounced emails, wrong numbers - corrupts your awareness and acquisition metrics from the start. If 15%+ of outbound emails bounce, your top-of-funnel conversion rates are fiction. Verifying contacts before they enter your journey keeps every downstream metric honest.