How to Build a Sales and Marketing Strategy That Actually Drives Revenue (2026 Playbook)
It's the end of Q1. Marketing is celebrating a record month - 2,400 MQLs. Sales is furious because half those leads don't pick up the phone and the other half have never heard of your product. The CEO wants to know why pipeline is flat despite a 40% increase in ad spend.
You don't have a lead problem. You have an alignment problem. And in 2026, only 8% of companies have actually solved it.
The fix isn't another Slack channel or a monthly "smarketing" meeting. It's a single, unified sales and marketing strategy - one document, shared goals, shared definitions, shared accountability. Getting this right is the highest-leverage thing you can do for revenue this year.
The Short Version
If you read nothing else:
- Write one unified strategy, not two separate plans. Aligned companies are 67% better at closing deals. Two separate plans with two separate dashboards is how you get finger-pointing instead of pipeline.
- Build an SLA that defines what a qualified lead is and how fast sales follows up. No ambiguity. No "I'll get to it when I can." Written commitments with numbers attached.
What Does This Strategy Actually Include?
A sales and marketing strategy is a single plan that connects how you attract buyers to how you close them. Not a marketing plan stapled to a sales plan - a unified revenue engine where both teams work from the same goals, the same definitions, and the same data.
Most companies treat these as separate functions. Marketing owns awareness and lead generation over months and quarters. Sales owns conversion through direct conversations over days and weeks. The strategy connects them with shared revenue targets, agreed-upon handoff criteria, and a feedback loop that actually works.
| Dimension | Marketing | Sales |
|---|---|---|
| Primary goal | Generate demand | Convert demand |
| Timeframe | Months to years | Days to weeks |
| Key metrics | MQLs, CPL, pipeline | Win rate, ACV, cycle time |
| Core tools | MAP, CMS, analytics | CRM, dialer, sequencer |
| Approach | One-to-many | One-to-one |
The strategy document sits above both columns. It defines the ICP, the buyer journey, the handoff rules, and the shared KPIs that keep everyone honest.
Why Alignment Matters More Than Tactics
The gap between aligned and misaligned companies is staggering.
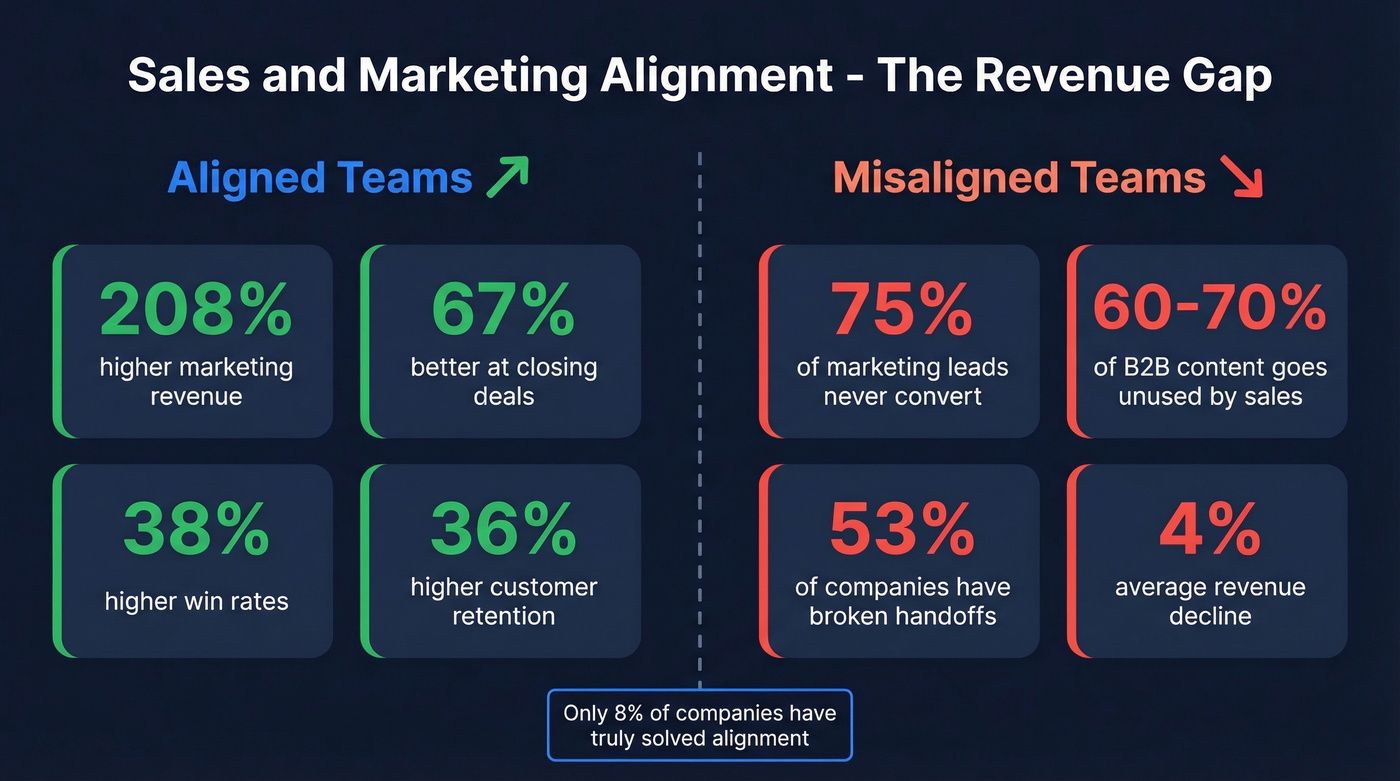
Best-performing aligned organizations report revenue increases of up to 208%. That's not a typo. Strong alignment drives 20% average annual growth, while companies that can't get their teams working together see roughly a 4% revenue decline. Aligned companies are 67% better at closing deals, see 38% higher win rates, and achieve 36% higher customer retention. This isn't a platitude - it's the single biggest lever most B2B companies aren't pulling.
Now flip it. Close to 75% of marketing leads never convert to a sale. Between 60-70% of B2B content goes completely unused by sales. And 53% of companies still experience broken handoffs - leads falling into a black hole between the two teams.
Here's the thing: most companies don't have a demand gen problem or a closing problem. They have a handoff problem. Fix the handoff and you'll free up more revenue than any new channel or tool ever will.
The Motherhood, a boutique influencer marketing agency, is a perfect example. They hit a wall - increasing competition, no structured sales process, declining revenue. After building a formal sales process and aligning it with demand generation, they doubled revenue and posted their best sales year on record. We'll break down exactly what they did in the case studies section below.
B2B vs B2C: Know Which Game You're Playing
Before building your strategy, understand the playing field. B2B and B2C share vocabulary but almost nothing else.
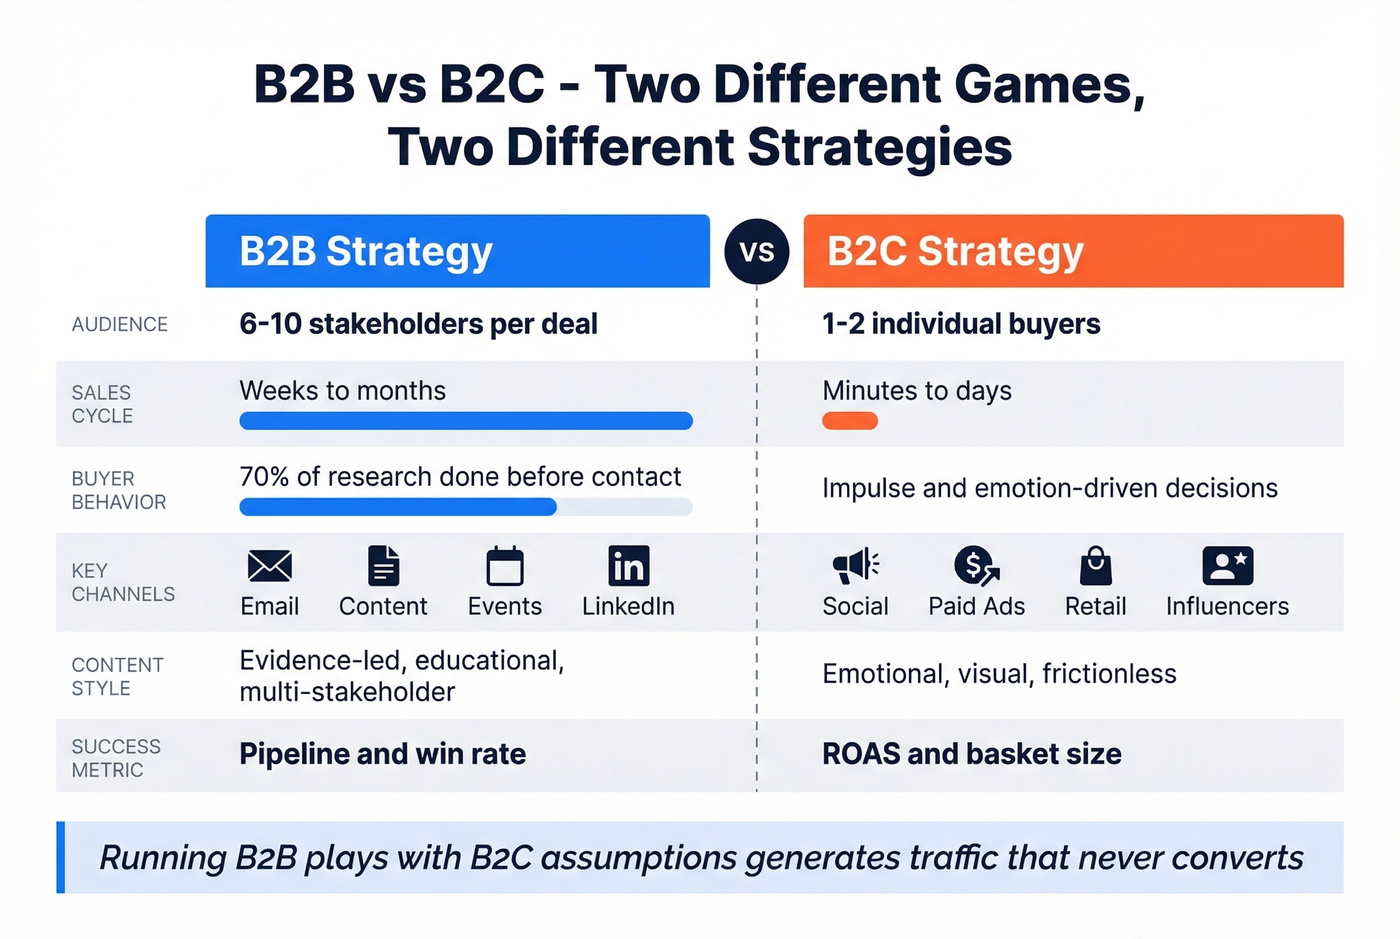
The biggest difference is complexity. A typical B2B buying group includes 6-10 stakeholders, each with different priorities, objections, and authority levels. B2B buyers complete up to 70% of their research before ever contacting a vendor - your marketing has to do serious educational heavy lifting before sales even gets a shot.
Gartner breaks the B2B buying process into six non-linear tasks: problem identification, solution exploration, requirements building, supplier selection, validation, and consensus creation. Your strategy needs to support all six - not just the "supplier selection" moment when a demo gets booked.
| Dimension | B2B | B2C |
|---|---|---|
| Audience | Buying committees | Individual consumers |
| Sales cycle | Weeks to months | Minutes to days |
| Stakeholders | 6-10 per deal | 1-2 |
| Pricing | Negotiated, custom | Standardized |
| Key channels | Email, content, events | Social, paid, retail |
| Success metric | Pipeline, win rate | ROAS, basket size |
B2B strategies need multi-threading to reach multiple stakeholders, evidence-led content, and longer nurture sequences. B2C strategies optimize for reach, emotional resonance, and frictionless conversion. If you're running B2B plays with B2C assumptions, you'll generate traffic that never converts.
How to Build Your Strategy
Seven steps. None of them are optional.
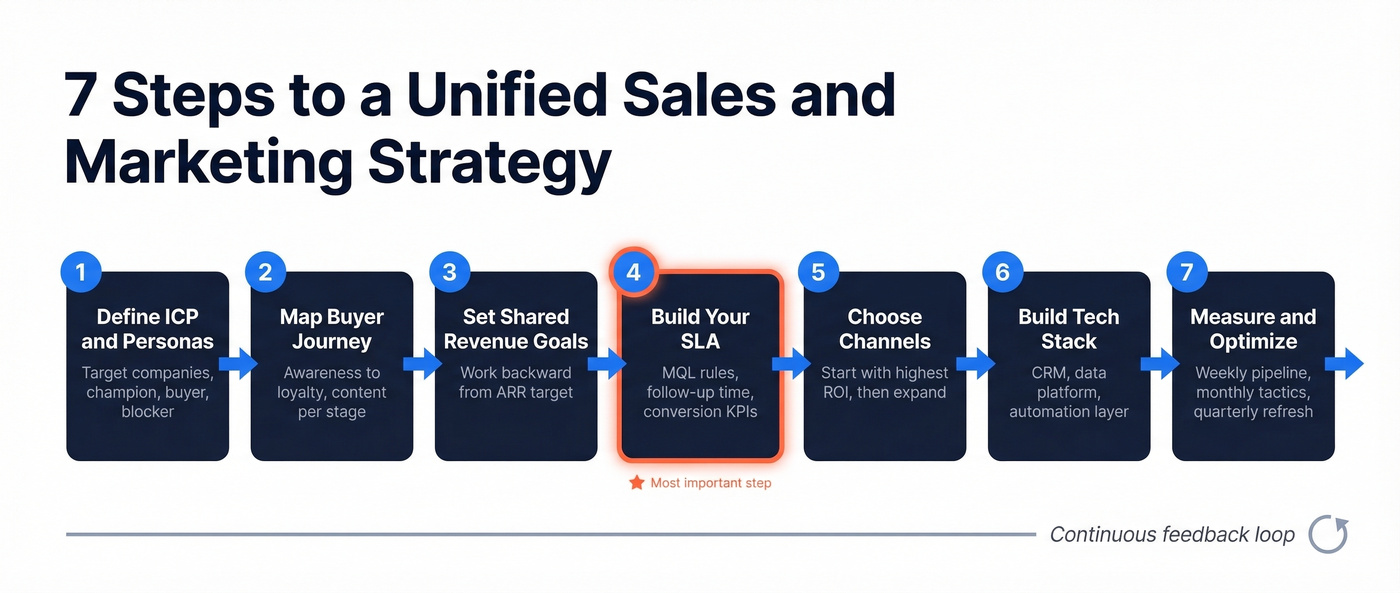
Define Your ICP and Personas
Start with who you're selling to - not demographics, but the specific companies and roles that actually buy. Your ICP defines the company: industry, size, tech stack, growth stage. Your buyer personas define the people inside those companies who influence the deal.
B2B deals involve 6-10 stakeholders. You don't need a persona for every one, but you need at least three - the champion, the economic buyer, and the most common blocker. If your strategy only targets one persona, your reps will get stuck in single-threaded deals that stall at procurement.
If you need a starting point, use an ICP scoring rubric and iterate from real pipeline.
Map the Buyer Journey
Your buyers move through awareness, consideration, decision, and loyalty stages. Your strategy needs content, touchpoints, and handoff rules for each one.
Remember: 70% of B2B research happens before a buyer talks to your team. If your strategy only activates at the "book a demo" stage, you're invisible for most of the journey. Map what questions buyers ask at each stage, what content answers those questions, and when marketing hands off to sales.
To keep this measurable, define your funnel metrics before you ship new campaigns.
Set Shared Revenue Goals
Start with the revenue target and work backward. If you need $5M in new ARR and your average deal is $50K with a 25% close rate, you need 400 qualified opportunities. If marketing sources 50% of pipeline, that's 200 opportunities marketing needs to create. Make these SMART - specific, measurable, achievable, relevant, and time-bound. "$5M in new ARR by Q4" is a goal. "Grow revenue" is a wish.
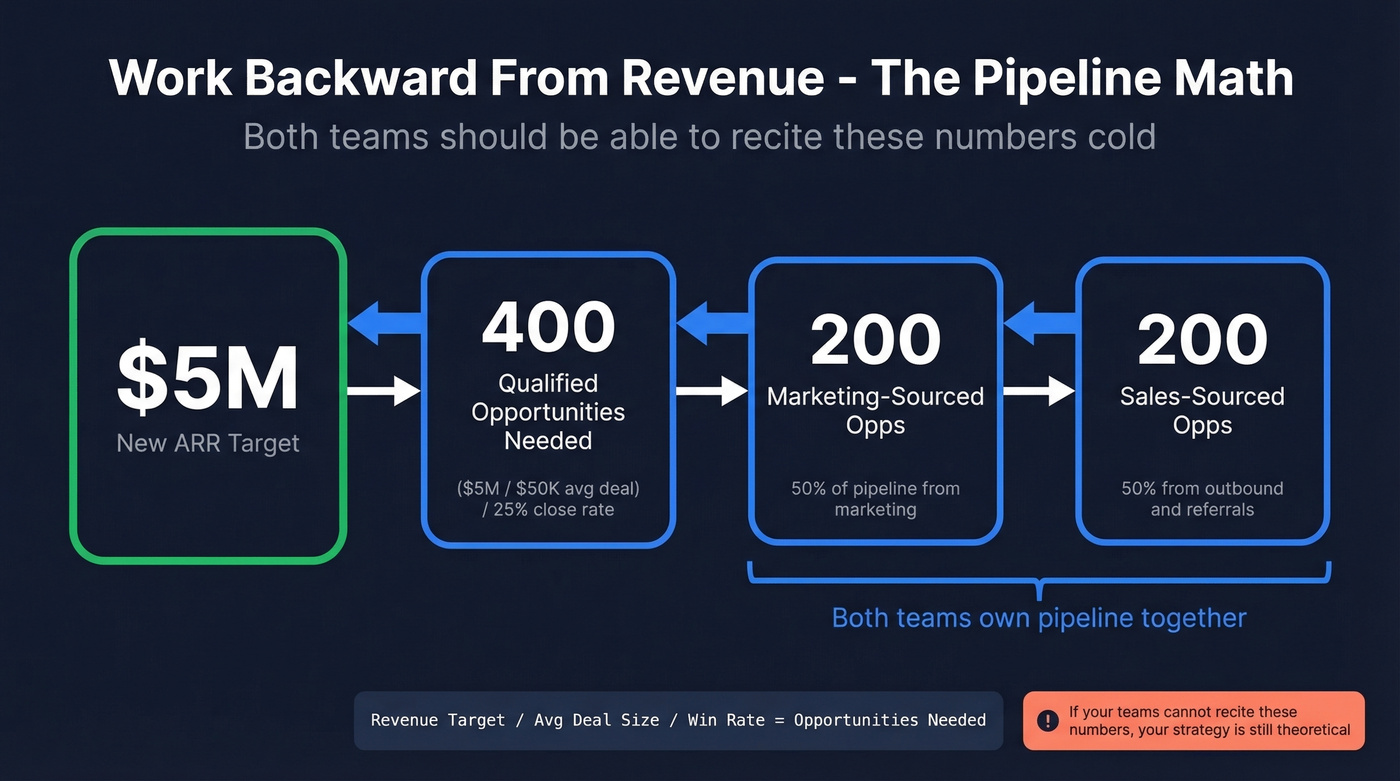
Both teams should be able to recite these numbers cold. If they can't, your strategy is still theoretical.
If you want to sanity-check the math, compare it to current sales pipeline benchmarks and your historical conversion rates.
Build Your SLA
This is the single most important document in your entire revenue plan. We'll go deeper in the next section, but the preview: your SLA defines what counts as a qualified lead, how fast sales follows up, and what conversion rates both teams commit to hitting. Without it, every pipeline review devolves into "your leads suck" versus "you're not following up."
If you need a reference point, Build an SLA with clear definitions and response-time commitments.
Choose Channels and Allocate Budget
Not all channels are equal. Email marketing returns $36-40 for every $1 spent. SEO and content marketing ROI can exceed 700%. Average B2B cost per lead runs about $200, but demo-request CPLs can hit $600-$800. Start with the highest-ROI channels, prove them out, then expand.
If you're rebuilding outbound, start with proven sales prospecting techniques and then layer in new channels.
Build Your Tech Stack
There are over 14,000 marketing tools on the market. The temptation is to buy your way to alignment. Don't. Dan McGaw's advice is spot-on - define your workflows in spreadsheets first, test them for months, then buy tools to automate what's already working.
Your minimum viable stack is three layers: a CRM, a data platform, and an automation layer. We'll cover specific stack recommendations in a dedicated section below.
If your CRM choice is still up in the air, here are examples of a CRM with real pricing and best-fit notes.
Measure, Review, Optimize
Strategy without measurement is just storytelling. Set up a shared dashboard both teams can see - pipeline by stage, conversion rates at each handoff, and revenue attribution by channel. Review pipeline weekly. Adjust tactics monthly. Do a full strategy refresh quarterly. Annual-only planning is too slow for how fast markets move.
To make reviews actionable, track pipeline health indicators (not just top-line pipeline).
75% of marketing leads never convert - and bad contact data is the silent killer. When sales finally gets a qualified handoff, they need to actually reach the buyer. Prospeo delivers 98% email accuracy and 125M+ verified mobile numbers with a 30% pickup rate, so your aligned strategy converts into real conversations.
Stop losing aligned leads to bad data. Start connecting.
The SLA - Your Most Important Document
A Marketing & Sales Alignment Agreement is a written contract between your two teams. Not a handshake. Not a verbal agreement from a kickoff meeting. A document with numbers, commitments, and accountability.
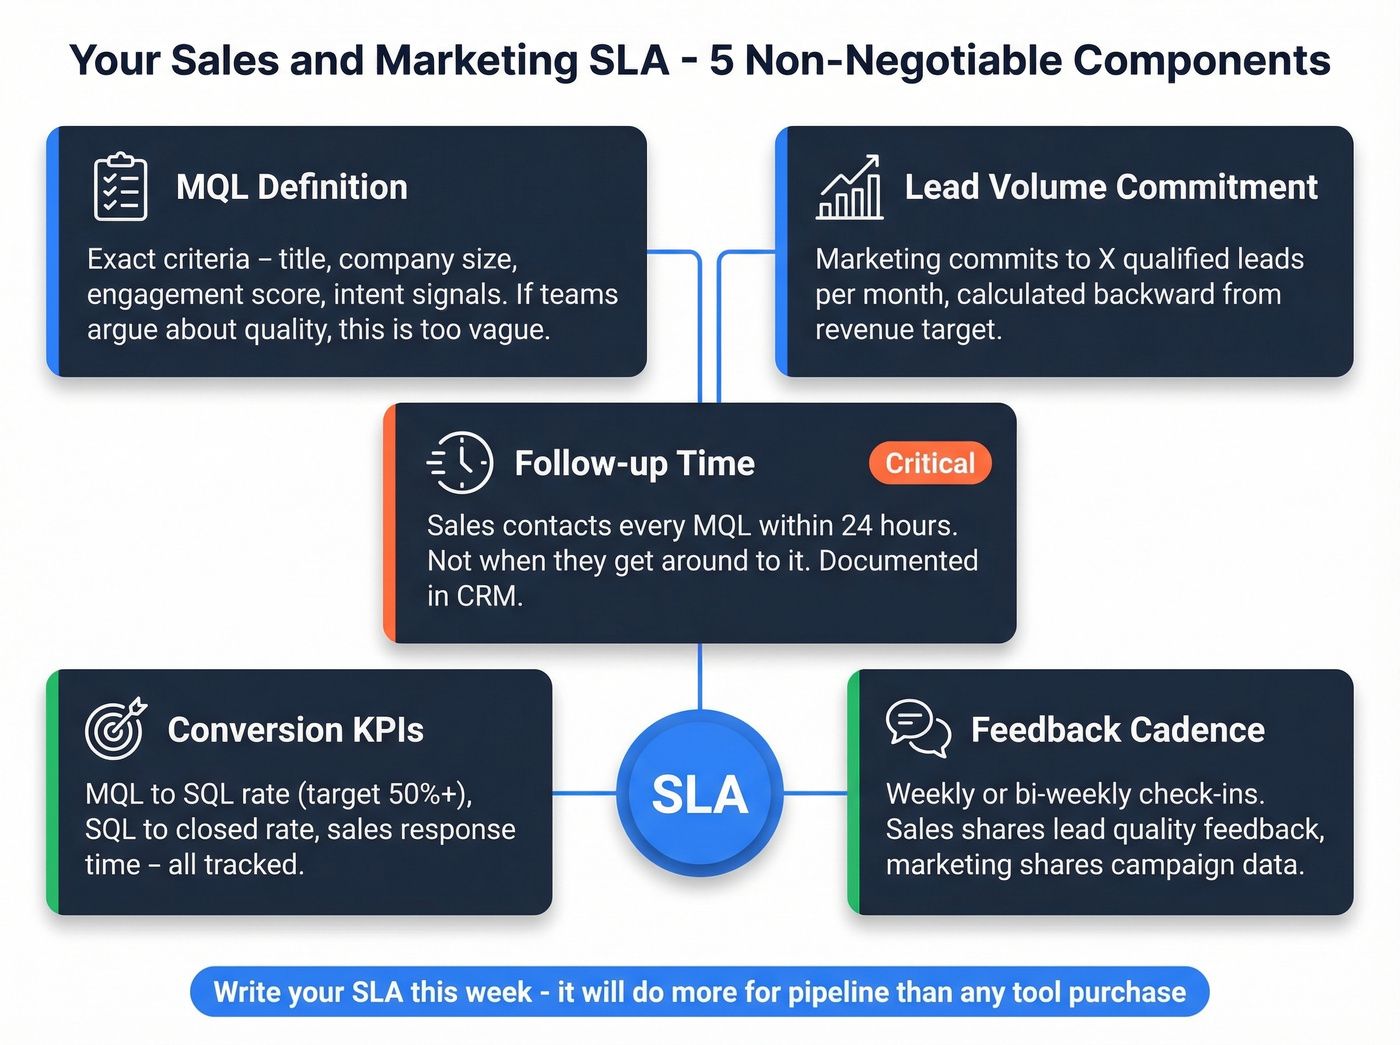
We've watched pipeline reviews devolve into blame sessions more times than we can count. The root cause is always the same: no SLA. Here are the five components that fix it.
MQL definition. Exactly what criteria a lead must meet before marketing passes it to sales - title, company size, engagement score, intent signal. If your teams argue about lead quality, your MQL definition is too vague.
If you want to operationalize this, set up a simple lead scoring model both teams agree on.
Lead volume commitment. Marketing commits to delivering a specific number of qualified leads per month, calculated backward from the revenue target.
Follow-up time. Sales commits to contacting every MQL within 24 hours. Not "when they get around to it." Twenty-four hours, documented in the CRM.
If you need to standardize the motion, use these sales follow-up templates to keep response quality consistent.
Conversion KPIs. MQL-to-SQL conversion rate (target 50%+), SQL-to-closed rate, and sales response time - all tracked and reviewed.
Feedback cadence. Weekly or bi-weekly check-ins where sales gives marketing feedback on lead quality and marketing shares campaign performance data.
The math-based approach works best. Measure close rates by channel, assign dollar values to each lead source, and commit to a monthly lead goal that ties directly to revenue. If you do nothing else after reading this article, write an SLA this week. It'll do more for your pipeline than any tool purchase.
Channel ROI Benchmarks
You need numbers to allocate budget intelligently. Here are the benchmarks that matter for B2B:
| Channel | Metric Type | Benchmark |
|---|---|---|
| Email marketing | ROI | $36-40 per $1 spent |
| SEO / content | ROI | 700%+ |
| Avg B2B CPL | Cost | ~$200 |
| Demo request CPL | Cost | $600-$800 |
| Website conversion | Rate | 2-5% (top pages 10%+) |
| MQL-to-SQL rate | Rate | 50%+ target |
| Marketing-sourced pipe | Revenue share | 30-60% of total |
Marketing-sourced pipeline should contribute 30-60% of your total revenue target. Below 30%, marketing isn't generating enough demand. Above 60%, you're under-investing in outbound and your pipeline is fragile.
Social media is the wildcard. 81% of consumers say social media influences their purchases, but only 30% of marketers believe they can actually measure social ROI. For B2B, social works best as a brand and trust channel rather than a direct lead source - don't expect posts to fill your pipeline. Expect them to warm up the accounts your outbound team is already targeting.
The consensus across practitioner communities like r/sales and r/b2bmarketing is clear: email and content are the workhorses. Paid social and events are amplifiers. Build your budget around the workhorses first.
Building Your Tech Stack
We've seen teams blow $100K+ on tools they barely use. The pattern is always the same: buy the enterprise platform, realize you only need 20% of it, then spend six months trying to justify the contract.
A real-world stack from an agency operator on Reddit tells the story well. Calendly feeds into Zapier, which triggers an intro email via Mailchimp and pushes the contact into HubSpot. The whole thing costs under $200/month and avoids HubSpot's notorious pricing jump - their Marketing Hub goes from ~$50/month on Starter to ~$800/month on Professional. That's a painful leap if all you need is email automation.

The composable stack approach works better for most teams:
- CRM: HubSpot free tier or Salesforce (~$25-$35/user/mo for SMB plans)
- Marketing automation: Mailchimp (~$13/mo to start) or HubSpot Starter
- Sales engagement: Instantly (~$30/mo) or Smartlead (~$39/mo)
- Automation glue: Zapier (~$20/mo) or Make (~$9/mo)
- Analytics: Google Analytics (free) + your CRM's built-in reporting
If you're evaluating tooling for reps specifically, start with a shortlist of SDR tools and map them to your workflow.
Real Thread illustrates the principle well. They started with Salesforce not properly integrated and SalesLoft not connected. After rebuilding around a composable stack - Segment piping data into Salesforce, Amplitude replacing Kissmetrics, and Clearbit for enrichment - everything actually talked to each other. Process first, tools second.
Mistakes That Kill Your Strategy
Five mistakes that show up repeatedly. Skip this section if your team already has a working SLA and shared dashboard - but in our experience, most teams haven't gotten there yet.
Plans that die in PowerPoint. Your strategy deck gets applause at the QBR and then sits in a Google Drive folder until next quarter. Translate every strategic initiative into weekly actions with owners and deadlines. If it's not in someone's task list, it doesn't exist.
If your QBRs aren't driving action, tighten the agenda with these QBR questions to ask.
Emphasizing price over value. Discounting your way to closed deals trains your market to wait for discounts. Arm sales with ROI calculators and case studies that quantify value. Compete on outcomes, not price.
Talking more than listening. This is the one most reps refuse to acknowledge. The best salespeople listen far more than they talk. Build discovery frameworks - BANT, MEDDIC, whatever fits your cycle - that force reps to ask questions before pitching. Our team has seen organizations that mandate structured discovery hit 20-30% higher win rates within a single quarter.
If you're standardizing qualification, use a consistent MEDDIC sales qualification checklist across the team.
Letting unqualified leads clog the pipe. Every unqualified lead that enters your pipeline wastes sales time and distorts your metrics. Enforce your MQL criteria ruthlessly. A smaller pipeline of qualified opportunities beats a bloated pipeline of maybes every single time. This is where the SLA earns its keep - if the definition is tight and both teams respect it, pipeline quality improves overnight.
Building on bad data is the most insidious mistake of all, and it's the one that frustrates us the most because it's so preventable. You launch an outbound campaign with 5,000 contacts, 30% bounce, and suddenly your sender domain is flagged. Dead phone numbers waste rep time. Stale titles mean you're pitching the wrong person. Data-driven revenue plans only work when the underlying data is accurate. Verify before you send. One customer, Meritt, cut their bounce rate from 35% to under 4% after switching to verified data - same campaign, same messaging, completely different results.
If deliverability is already shaky, start with the fundamentals in our email deliverability guide.
What Aligned Strategy Looks Like
Two case studies with hard numbers.
The Motherhood was a boutique influencer marketing agency struggling with increased competition and no formal sales infrastructure. They conducted a two-year sales analysis, built a revenue forecast, formalized their sales process, updated their HubSpot CRM to match, and hired a dedicated BDR. The result: doubled revenue and hit their best sales year on record. The key wasn't a new product or market - it was connecting marketing's demand generation to a structured sales process with clear handoff points.
SAP's "Inspire the Future" campaign shows what alignment looks like at enterprise scale. The campaign achieved 48% higher engagement than other SAP social campaigns, attracted 22,000+ podcast listeners (top 2% threshold is 18,000), and generated EUR924.4M in pipeline with EUR266.15M in projected revenue. It expanded globally and attracted partner co-investment from firms like Capgemini. That's what happens when marketing and sales operate from the same playbook with shared pipeline targets.
FAQ
What's the difference between a sales strategy and a marketing strategy?
Marketing generates demand over months through content, ads, and brand building. Sales converts that demand through direct conversations over days and weeks. A unified sales and marketing strategy connects both to shared revenue goals, handoff rules, and accountability metrics.
How do you align sales and marketing teams?
Write a shared SLA defining qualified leads, follow-up timelines, and conversion KPIs. Hold weekly pipeline reviews using a shared dashboard. Aligned companies are 67% better at closing deals - the SLA is the foundation that makes that possible.
What KPIs should you track?
MQLs, MQL-to-SQL conversion rate (target 50%+), sales response time (under 24 hours), cost per lead (~$200 B2B average), pipeline coverage ratio, win rate, and customer acquisition cost. Review weekly in a shared dashboard both departments access in real time.
How often should you update your strategy?
Review KPIs weekly, adjust tactics monthly, do a full strategy refresh quarterly. Annual cycles are too slow - buyer behavior shifts faster than that. Companies that review quarterly grow 20% faster on average.
What's a good free tool for contact data?
Prospeo's free tier includes 75 verified emails and 100 Chrome extension credits per month - enough to validate your ICP targeting before committing budget. HubSpot's free CRM pairs well for tracking those contacts through the pipeline.
Your SLA says sales follows up in 5 minutes. But 60-70% of content goes unused and leads bounce because the data is stale. Prospeo refreshes every 7 days - not the 6-week industry average - so every lead your marketing team hands off has a working email and a real phone number attached.
Alignment without accurate data is just a prettier handoff to nowhere.