Sales Enablement KPIs: Track Fewer, Track Better
59.9% of sales teams say they're on track to meet revenue targets - yet 84% of individual reps missed quota last year That gap isn't a data shortage. It's a KPI selection problem.
Your CEO asks one question at the QBR: "What did enablement actually do for pipeline?" You pull up a dashboard with 37 metrics. Half are content views. A third are training completion rates. None connect to revenue. We've watched teams spend months building dashboards crammed with 30 metrics and still fail to answer that single question. Knowing how to measure sales enablement starts with choosing the right metrics - not the most metrics.
What You Need (Quick Version)
Build your starter dashboard around five KPIs:
- Win rate - the ultimate enablement outcome metric
- Time to productivity - how fast new reps generate pipeline
- Content adoption in closed deals - actual usage in won opportunities, not views or downloads
- Quota attainment - tracked at the rep level, not the org average
- Contact data accuracy - bounce rates and connect rates that determine whether reps even reach prospects
Gail Behun, Sr Director of Revenue Enablement, puts it well: focus on "four or five at any given time consistently." Below you'll find formulas, benchmarks, and review cadences for each.
Enablement KPIs vs. Sales KPIs
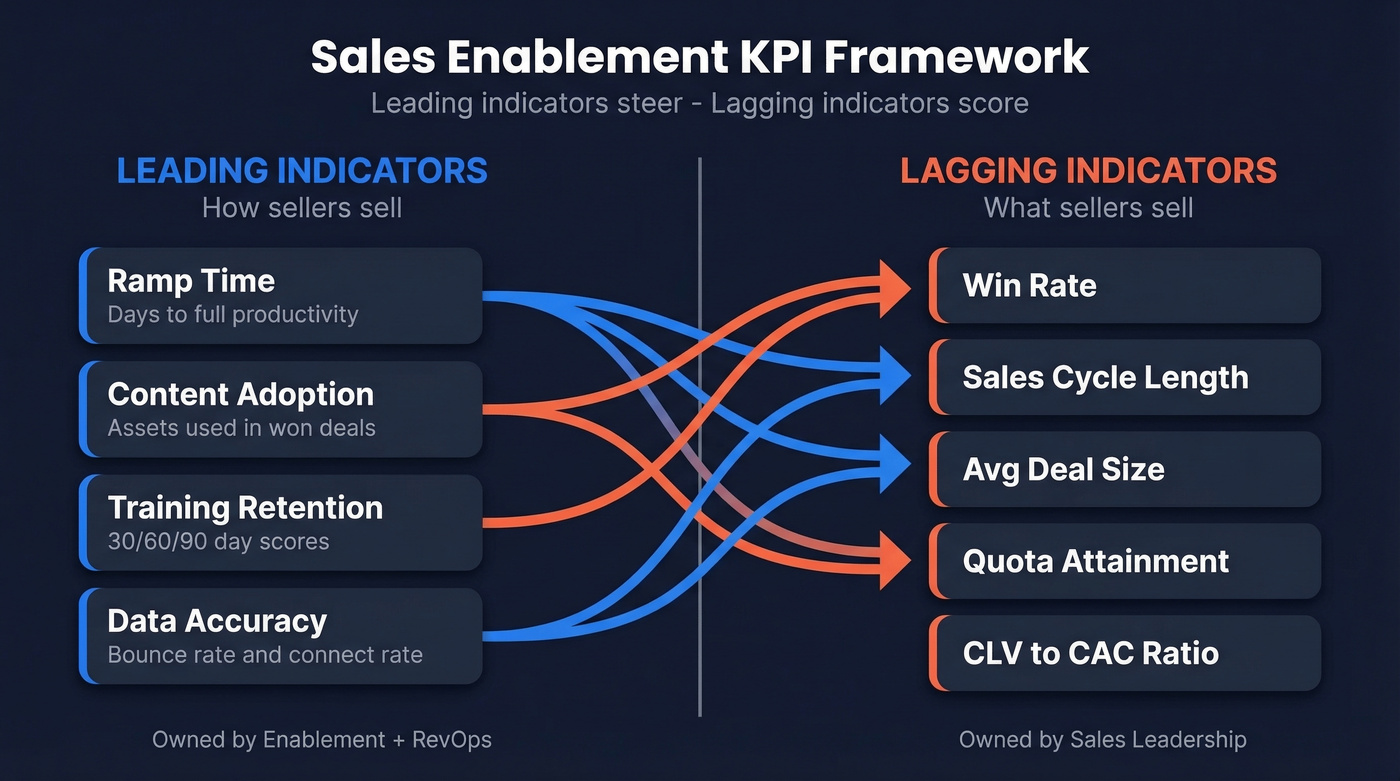
The simplest test, borrowed from DemandZen's framework: does this metric measure how sellers sell or what sellers sell? Enablement KPIs measure inputs - readiness, training effectiveness, content usage, ramp time. Sales KPIs measure outputs - revenue, win rate, deal size, quota attainment.
The Sales Enablement Landscape Report highlights the same leading-vs-lagging tension and found that 49% of enablement teams and their leadership disagree on which metrics matter most. That misalignment is exactly why KPI selection - not just tracking - is the real problem.
| Enablement KPIs (Leading) | Sales KPIs (Lagging) | |
|---|---|---|
| Measures | How sellers sell | What sellers sell |
| Timing | Predictive | Retrospective |
| Examples | Ramp time, content adoption | Win rate, quota attainment |
| Owner | Enablement + RevOps | Sales leadership |
| Action | Adjust programs now | Inform next quarter |
The mistake most teams make is treating lagging indicators as enablement metrics. Win rate matters, but it's an outcome of dozens of inputs. You need both categories - leading indicators to steer, lagging indicators to score. (If you want the broader framework, see leading vs lagging indicators.)
Why Most Teams Track the Wrong Metrics
Here's the thing: tracking more metrics doesn't make you more informed. It makes you more confused. A Gartner quote via Mindtickle nails it: "The best sales enablement programs track and enforce whether resources are being used across the sales organization." Enforce - not just measure consumption.
HubSpot's State of Sales report found that 42% of sales leaders say ARR is their most important success metric. Fewer than 5% prioritize pipeline coverage, lead scoring, or sales linearity. The metrics leadership watches are almost entirely lagging indicators, which means enablement teams scramble to reverse-engineer credit for outcomes they influenced but can't directly prove. Without a clear enablement measurement framework, proving that credit becomes nearly impossible.
Your enablement team created 47 battle cards. Reps viewed them 2,300 times. So what? Views don't close deals. The metric that matters is how many of those assets showed up in closed-won opportunities. (If you're standardizing these assets, use a sales enablement playbook to keep adoption measurable.)
Content views don't close deals - and neither do emails that bounce. Contact data accuracy is the foundational KPI that every other enablement metric depends on. Prospeo's 98% email accuracy and 7-day data refresh cycle keep your bounce rate under 5% so reps spend time selling, not chasing dead contacts.
Fix the data layer and every KPI downstream improves.
Metrics That Actually Prove Impact
Two groups: leading indicators you can influence right now, and lagging indicators that prove whether your programs worked.
Leading Indicators
Time to Productivity
The single most important enablement KPI for any team that's hiring. Highspot's formula: Days to train + Days to onboard + Days of shadow + Days of practice = Time to Productivity. (To operationalize ramp, pair this with a 30-60-90 day plan.)
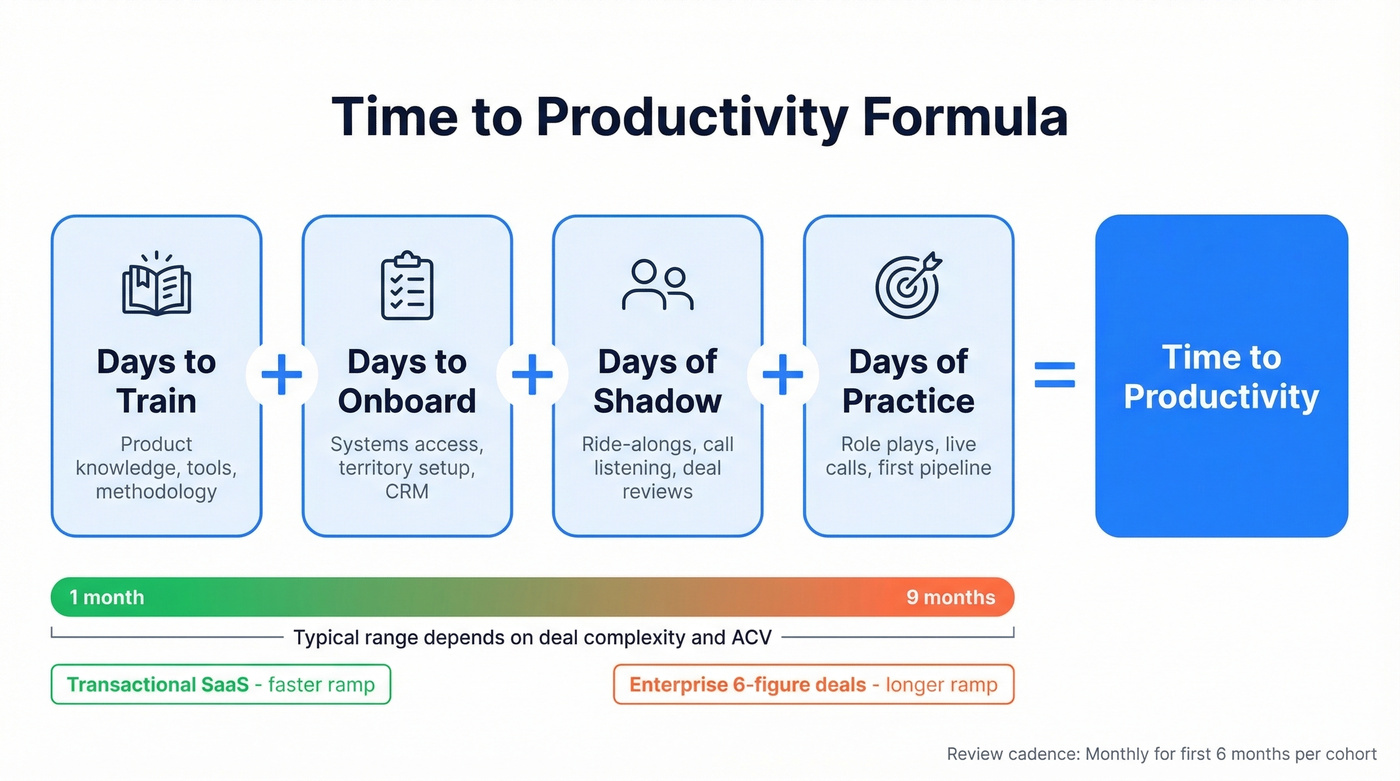
Expect roughly 1-9 months depending on deal complexity and ACV. Enterprise sales with six-figure contracts naturally take longer than transactional SaaS. Track the trend, not the snapshot. GreyScout cut rep ramp time from 8-10 weeks to 4 weeks - partly because new reps stopped wasting their first month chasing bad contact info. After switching to Prospeo, bounce rates dropped from 38% to under 4%, which meant reps reached real prospects from day one instead of burning through a list of dead emails.
Review cadence: monthly for the first 6 months of any new hire cohort.
Content Adoption Rate
Formula: (Assets used in closed-won deals / Total available assets) x 100
Don't measure views. Measure what gets used in the sales process. Three things to track:
- Number of times an asset is used in active deals
- Percentage of sellers who used each asset
- Number of times assets were shared in closed-won deals
Aim for 30-50% of your content library showing up in active deals. Anything below that means you're producing content nobody uses. (For what to build, start with proven sales enablement content types.)
Review cadence: quarterly, aligned with content audits.
Training Completion & Retention
Completion rates alone are vanity metrics. A rep who clicks through 12 modules in 45 minutes hasn't learned anything. Layer in post-training assessments - scenario-based quizzes, role-play scores, manager evaluations at 30/60/90 days. And don't overlook unlearning: reps who internalized last quarter's pricing or positioning need active deprogramming, not just new modules stacked on top. (If you need a structure, borrow from a modern sales training process.)
Review cadence: after each program, then 30/60/90-day follow-ups.
Contact Data Accuracy
This is the KPI most enablement teams ignore - and it quietly destroys every downstream metric.
If your reps booked 200 meetings but only 40 converted to qualified opportunities, the problem might not be messaging or training. It might be that half those "meetings" were with wrong numbers, bounced emails, or outdated contacts. We've seen this pattern over and over: teams blame the pitch when the real culprit is rotten data.

Measure it with two numbers: email bounce rate (target: under 5%) and phone connect rate (target: 15-30%+ for direct dials). Snyk ran into this exact problem - bounce rates of 35-40% across 50 AEs. After switching their data provider, bounces dropped to under 5%, AE-sourced pipeline jumped 180%, and the team generated 200+ new opportunities per month. (If you're diagnosing bounces, see cold email bounce rate.)
Review cadence: weekly, automated via CRM enrichment reports.
Lagging Indicators
Win Rate
Formula: (Deals won / Total opportunities) x 100
HubSpot reports that 91% of sales teams say win rates are stable or improving - which sounds great until you realize "stable" might mean "consistently mediocre." Industry benchmarks put B2B SaaS win rates at 15-30%, though this varies significantly by deal size and motion. The absolute number matters less than the trend. If enablement launches a competitive battle card program and win rate ticks up 3 points over two quarters, that's provable impact. (For a deeper KPI set, compare against B2B sales KPIs.)
Review cadence: monthly, segmented by deal size and rep tenure.
Sales Cycle Length
Formula: Total days to close all deals / Number of closed deals
Track by segment, not as a blended average. A $5k deal closes in 14 days; a $500k enterprise contract takes 9 months. Enablement's lever here is removing friction - better discovery frameworks, sharper proposals, faster access to verified decision-maker contacts.
Review cadence: quarterly, by segment.
Average Deal Size
Formula: Total revenue from closed deals / Number of closed deals
Track the quarter-over-quarter trend, not the absolute number. If enablement rolls out cross-sell training and average deal size increases 15% over two quarters, that's a direct line from program to revenue.
Quota Attainment
Formula: (Reps achieving quota / Total reps) x 100
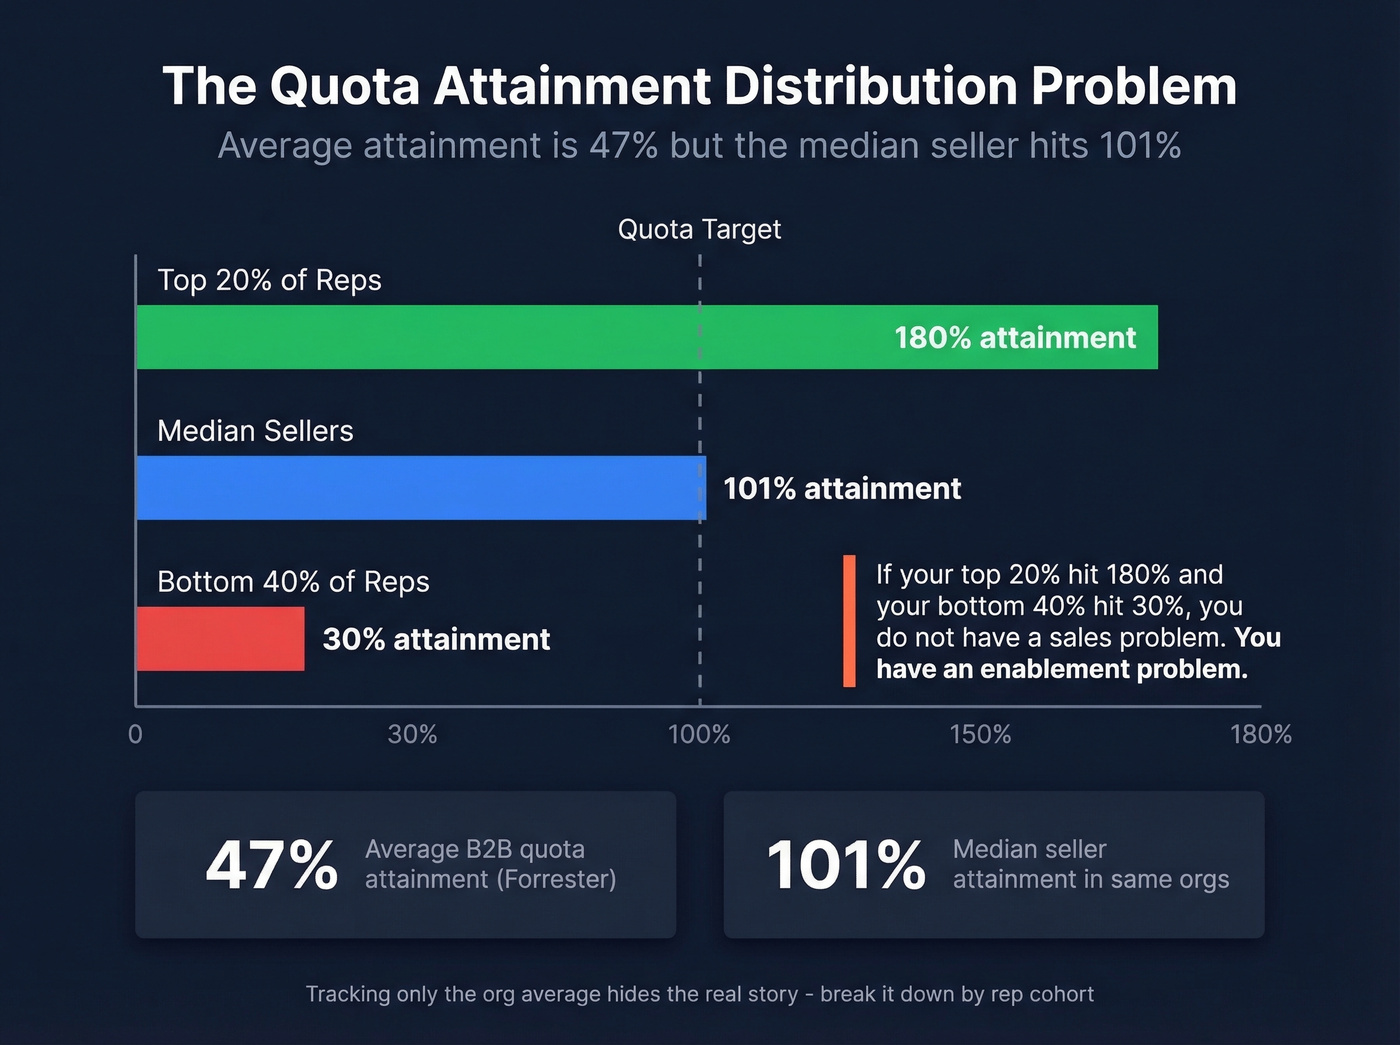
Here's where it gets interesting. Forrester reports that average B2B quota attainment sits at 47%. That sounds alarming - until you learn that the median seller in those same orgs hit 101%. It's a distribution problem, not a crisis. A few massive overperformers pull the average up while a long tail of underperformers drags it down.
Let's be honest: if your top 20% of reps hit 180% and your bottom 40% hit 30%, you don't have a sales problem. You have an enablement problem. The bottom cohort needs fundamentally different support than the top, and tracking only the org average hides that completely.
Review cadence: monthly, with rep-level breakdowns.
CLV-to-CAC Ratio
Formula: Customer Lifetime Value / Customer Acquisition Cost
Target 3:1. Enablement impacts both sides - better onboarding increases CLV through higher retention and expansion, while shorter sales cycles and higher win rates reduce CAC. It's the broadest metric on this list and the hardest to attribute directly to enablement. Track it quarterly at the program level. (If you want the math and levers, use this LTV CAC ratio guide.)
| KPI | Formula | Benchmark | Cadence | Data Source |
|---|---|---|---|---|
| Time to Productivity | Train + Onboard + Shadow + Practice days | ~1-9 months | Monthly | CRM + HRIS |
| Content Adoption | Assets in won deals / Total assets | 30-50% | Quarterly | Enablement platform |
| Training Retention | Assessment scores at 30/60/90 days | 80%+ pass rate | Post-program | LMS |
| Data Accuracy | Bounce rate + connect rate | <5% bounce, 15-30%+ connect | Weekly | CRM enrichment |
| Win Rate | Won / Total opps x 100 | 15-30% B2B SaaS | Monthly | CRM |
| Sales Cycle Length | Total days / Closed deals | 14-270 days by segment | Quarterly | CRM |
| Avg Deal Size | Revenue / Closed deals | Track QoQ trend | Quarterly | CRM |
| Quota Attainment | Reps at quota / Total reps | ~47% org avg | Monthly | CRM + Comp |
| CLV:CAC | LTV / CAC | 3:1 | Quarterly | Finance + CRM |
How to Choose the Right KPIs
Not every team needs all nine. Your maturity stage determines where to focus.
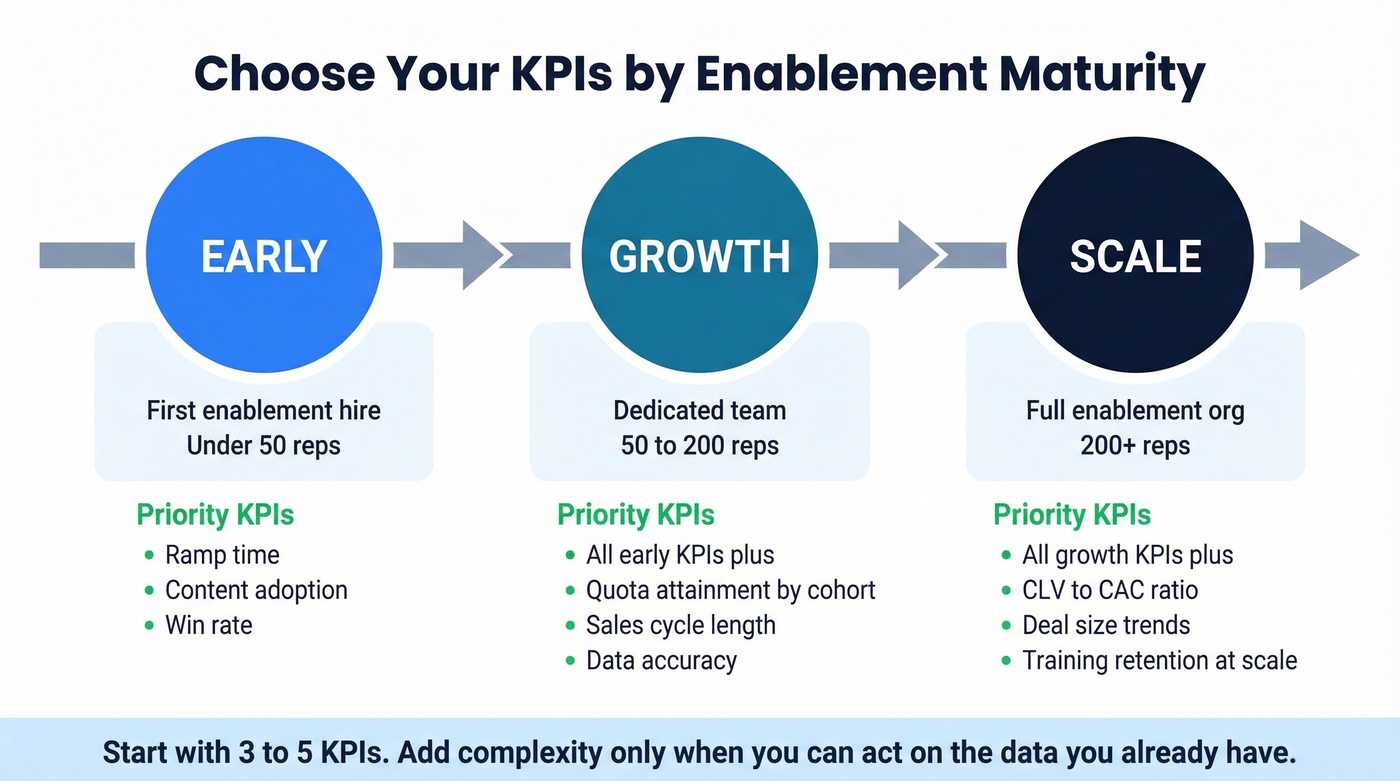
| Stage | Team Profile | Priority KPIs |
|---|---|---|
| Early | First enablement hire, <50 reps | Ramp time, content adoption, win rate |
| Growth | Dedicated team, 50-200 reps | + Quota attainment, cycle length, deal size |
| Mature | Full function, 200+ reps | + CLV:CAC, data accuracy, churn |
Spekit documented a useful example: for a post-acquisition cross-sell program, they tracked opportunities created within 90 days and deals closed within 120 days. Tight, specific measurement windows - not "did revenue go up eventually?" That's the level of precision you should aim for.
Skip the maturity model entirely if you're a team of three. Pick ramp time and win rate, measure them well, and expand from there. (If you're building the function from scratch, see how to build a sales enablement team.)
Building Your Enablement Dashboard
Three audiences need three different views. Your enablement manager needs leading indicators updated weekly. Your VP of Sales needs a monthly view connecting programs to pipeline and win rate. Your CFO needs a quarterly view showing CLV:CAC and cost-per-rep-ramped - the numbers that quantify enablement value in terms the finance team actually respects.
Demand Metric offers a free Excel dashboard template built around eight customizable metrics - about an hour to set up. For anything beyond a spreadsheet, you need three tools working together:
- CRM - Salesforce or HubSpot as your system of record for pipeline, deals, and activity data
- Enablement platform - Highspot, Seismic, or Mindtickle for content usage, training completion, and program measurement
One dashboard requirement that gets overlooked: mobile access. Organizations with mobile CRM access hit targets at 65% vs. 22% without it. Visibility drives accountability. (For examples of what to include, use these sales report examples.)
GreyScout cut ramp time in half. Snyk's 50 AEs grew pipeline 180%. The common thread: reps stopped wasting cycles on bad data. Prospeo gives your team 300M+ verified profiles at $0.01/email - so time-to-productivity and quota attainment actually move.
Stop blaming the pitch when the problem is rotten contact data.
FAQ
What's the difference between enablement KPIs and sales KPIs?
Enablement KPIs are leading indicators measuring how sellers sell - ramp time, content adoption, data quality. Sales KPIs are lagging indicators measuring what sellers sold - revenue, win rate, quota attainment. You need both: leading metrics to steer programs in real time, lagging metrics to prove results at QBRs.
How many KPIs should an enablement team track?
Four to five, consistently. Tracking 20+ metrics dilutes focus and makes it impossible to act on any single insight. Pick the metrics that align with your current quarterly initiative and rotate as goals shift - Spekit's 90-day measurement windows are a good model.
What's a good win rate benchmark for B2B SaaS?
B2B SaaS win rates typically fall between 15% and 30%, varying by deal size and sales motion. Don't obsess over the absolute number - track the trend quarter over quarter. A 3-point improvement after launching a competitive battle card program is more meaningful than hitting an arbitrary target.
How does data quality affect enablement metrics?
Bad contact data inflates activity metrics while depressing conversion and win rates. Reps log calls and send emails that never reach anyone, creating the illusion of effort without results. Fixing the data layer first is the single fastest way to get honest numbers from every other KPI on your dashboard.
How do I prove enablement ROI to leadership?
Connect leading indicators to lagging metrics leadership already watches. Show ramp time decreased 40%, then show that faster-ramping reps hit quota at 2x the rate of the previous cohort. Chain enablement input to revenue output - that turns your QBR from a defensive exercise into a strategic conversation.