Sales Lead Generation KPI Guide: The Ones That Actually Matter
It's Monday morning. Marketing's deck shows 500 new leads. Sales booked three meetings. The VP of Sales is staring at the VP of Marketing like someone just keyed their car.
This isn't a pipeline problem - it's a measurement problem. And it starts with tracking the wrong numbers.
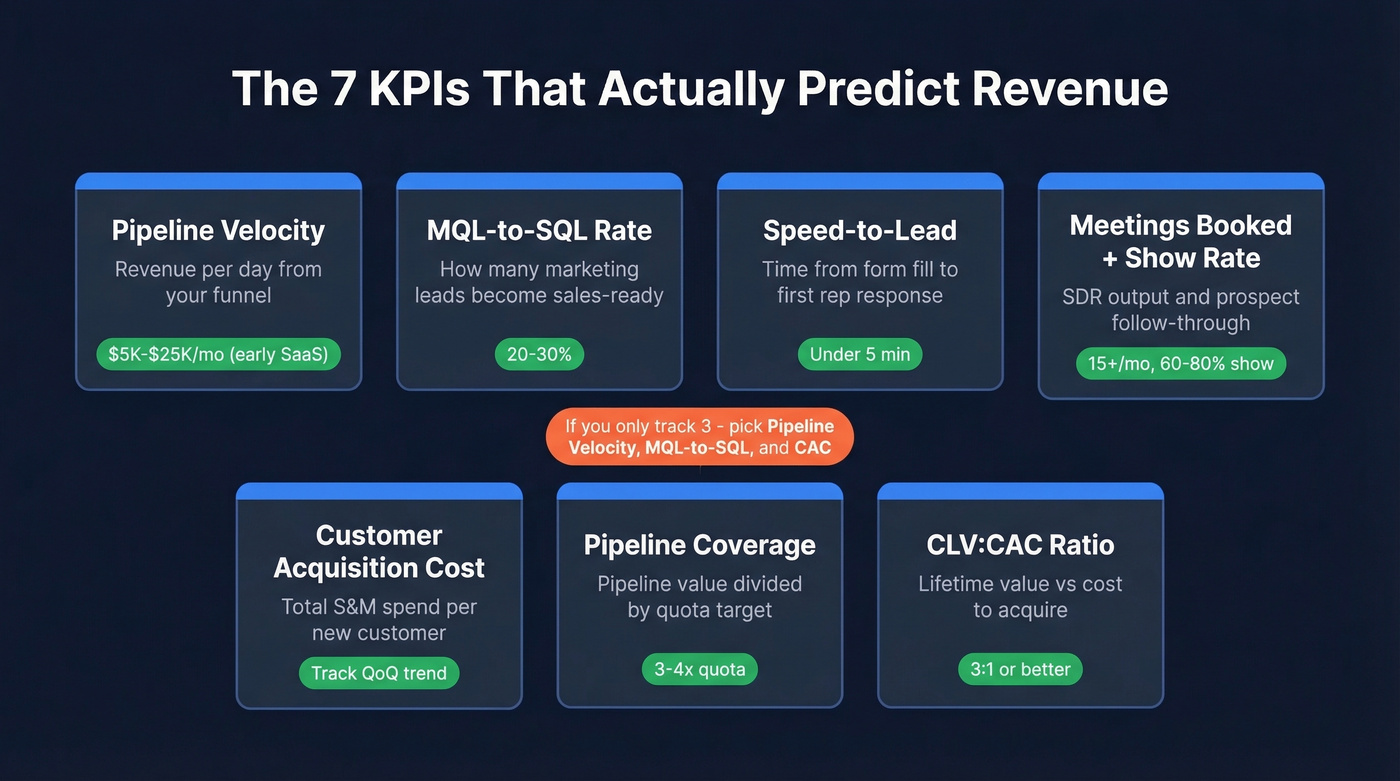
If you only track three sales lead generation KPIs, make them pipeline velocity, MQL-to-SQL conversion rate, and customer acquisition cost. Everything else is supporting detail.
Why Most Lead Gen Metrics Fail
The average B2B buying cycle runs 10.1 months. That's not a typo. Forrester's research shows 92% of buyers start with at least one vendor already in mind, and 6sense data shows the winning vendor sits on the buyer's Day One shortlist 95% of the time.
So when marketing celebrates 500 form fills, most of those people have already decided. They're downloading your whitepaper for ammo, not discovery. Tracking lead volume without understanding journey stage is measuring noise. The sentiment on r/sales is blunt: marketing KPIs optimized for lead volume and low CPL incentivize cheap traffic that produces junk leads. One thread flagged Meta Audience campaigns running 67% bot traffic - leads that look great on a dashboard and never pick up a phone.
Here's the thing: if your deal size is modest, you probably don't need a sophisticated attribution model. You need five verified phone numbers and an SDR who calls within four minutes.
Sales Lead Generation KPIs That Predict Revenue
Pipeline Velocity
This is the single most diagnostic metric in B2B sales:
(Opportunities x Average Deal Size x Win Rate) / Sales Cycle Length
Example: 50 opportunities x $25,000 x 20% win rate / 90-day cycle = $2,778 in revenue per day. That number tells you whether you'll hit quota this quarter - and which lever to pull if you won't.
Benchmarks by stage: early-stage B2B SaaS runs $5K-$25K/month. Growth-stage hits $50K-$200K/month. Enterprise targets $200K-$1M+/month. One immediate fix: remove stale deals stuck at 2-3x your average cycle length. They inflate your opportunity count and make velocity look healthier than it is.
MQL-to-SQL Conversion Rate
Healthy range: 20-30%. Below 15% means your MQL definition is too loose or marketing and sales aren't aligned on what "qualified" means. If your MQL criteria don't include BANT signals - budget, authority, need, timeline - the conversion rate is meaningless.
Further down the funnel, SQL-to-Opportunity should land at 50-70%, and Opportunity-to-Close at 20-35%. If you need a tighter handoff, start with lead scoring and a clear lead status taxonomy.
Speed-to-Lead
You've seen the stat: "Responding in 5 minutes makes you 21x more likely to qualify a lead." That number comes from a 2011 study that's been distorted through a decade of copy-paste marketing.
A 2026 Hennessey study based on 1,300+ law firm websites and 150,000+ data points tells the real story: only 25% of companies respond in under 5 minutes, up from 13% in 2021. But 39% still take over 2 hours or never respond at all. Speed-to-lead isn't a nice-to-have. It's a revenue KPI, and it's a competitive advantage precisely because most teams are terrible at it.
Meetings Booked and Show Rate
Outbound SDR benchmark: 5-25 meetings booked per month, with high-performing teams consistently hitting 15+. Show rate should land between 60-80%.
Below 60%, don't blame your reps - look at lead quality and your confirmation cadence. A well-timed reminder sequence fixes show rates faster than any coaching session. If your reps are struggling to get replies, use proven sales follow-up templates.
Customer Acquisition Cost
Total sales + marketing spend divided by new customers acquired. For B2B SaaS, cost per qualified meeting typically runs $300-$600.
Track cost per SQL, not cost per lead. CPL is a marketing metric, not a sales metric. A $15 CPL that converts at 2% costs more per customer than a $150 CPL that converts at 30%. We've seen teams celebrate a 40% drop in CPL while their cost per SQL actually went up.
Pipeline Coverage Ratio
Target 3-4x quota. Below 3x and you don't have enough pipeline to hit your number - that's math, not opinion. Above 5x signals your pipeline is bloated and you've got a qualification or deal-progression problem to fix. If you're unsure what “healthy” looks like, compare against sales pipeline benchmarks.
Customer Lifetime Value
CLV contextualizes everything upstream. Target a CLV:CAC ratio of 3:1 or better. Below 2:1, you're acquiring unprofitable customers regardless of how clean your funnel metrics look. A beautiful conversion rate means nothing if those customers churn in 90 days. To pressure-test this, run a simple churn analysis.
| KPI | Formula / Definition | Healthy Range |
|---|---|---|
| Pipeline Velocity | (Opps x Deal Size x Win Rate) / Cycle | Early SaaS: $5K-$25K/mo |
| MQL-to-SQL Rate | SQLs / MQLs | 20-30% |
| Speed-to-Lead | Time to first response | Under 5 minutes |
| Meetings Booked + Show Rate | Meetings per SDR/month; Held / Booked | 5-25 booked; 60-80% show |
| CAC | S&M spend / new customers | Varies by ACV; track QoQ trend |
| Pipeline Coverage | Pipeline value / quota | 3-4x |
| CLV:CAC Ratio | Lifetime value / CAC | 3:1+ |
The "5-Minute Rule": What the Data Actually Shows
Let's retire the zombie stat. The Hennessey study is the replacement benchmark - real distribution data, five years of tracking, 150K+ data points. The actual numbers are more useful than a single inflated multiplier because they show you where you stand relative to the field, not just that "fast is better."
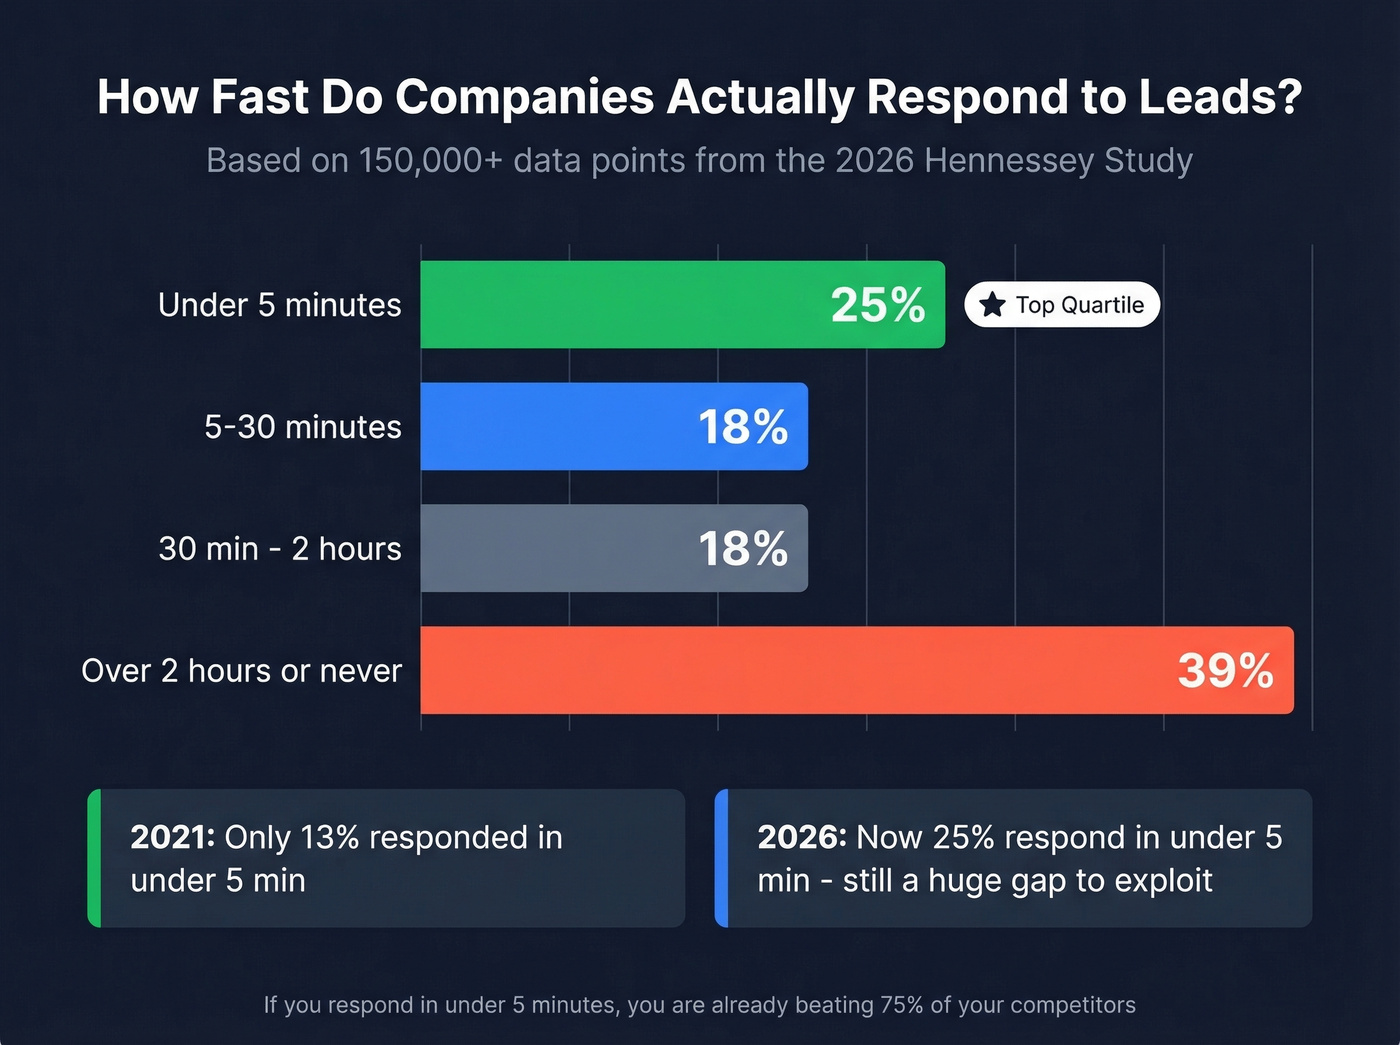
Use the distribution data to set your SLA. If you respond in under 5 minutes, you're already in the top quartile.
Speed-to-lead matters, but only if you're reaching real people. A 35% bounce rate corrupts every KPI downstream - pipeline velocity, CAC, conversion rates, all of it. Prospeo's 5-step email verification delivers 98% accuracy, and teams using it book 26% more meetings than ZoomInfo users.
Stop measuring a broken funnel. Fix the data feeding it.
Three Mistakes That Corrupt Your KPIs
Bad contact data. If 35% of your emails bounce, every conversion rate later in the funnel is wrong. Your connect rates, meeting rates, and pipeline metrics reflect your database's decay, not your team's skill. When Meritt switched to Prospeo for email verification, their bounce rate dropped from 35% to under 4%, and pipeline grew from $100K to $300K per week - because their reps were finally reaching real people. If you want to benchmark and fix this fast, start with email bounce rate.
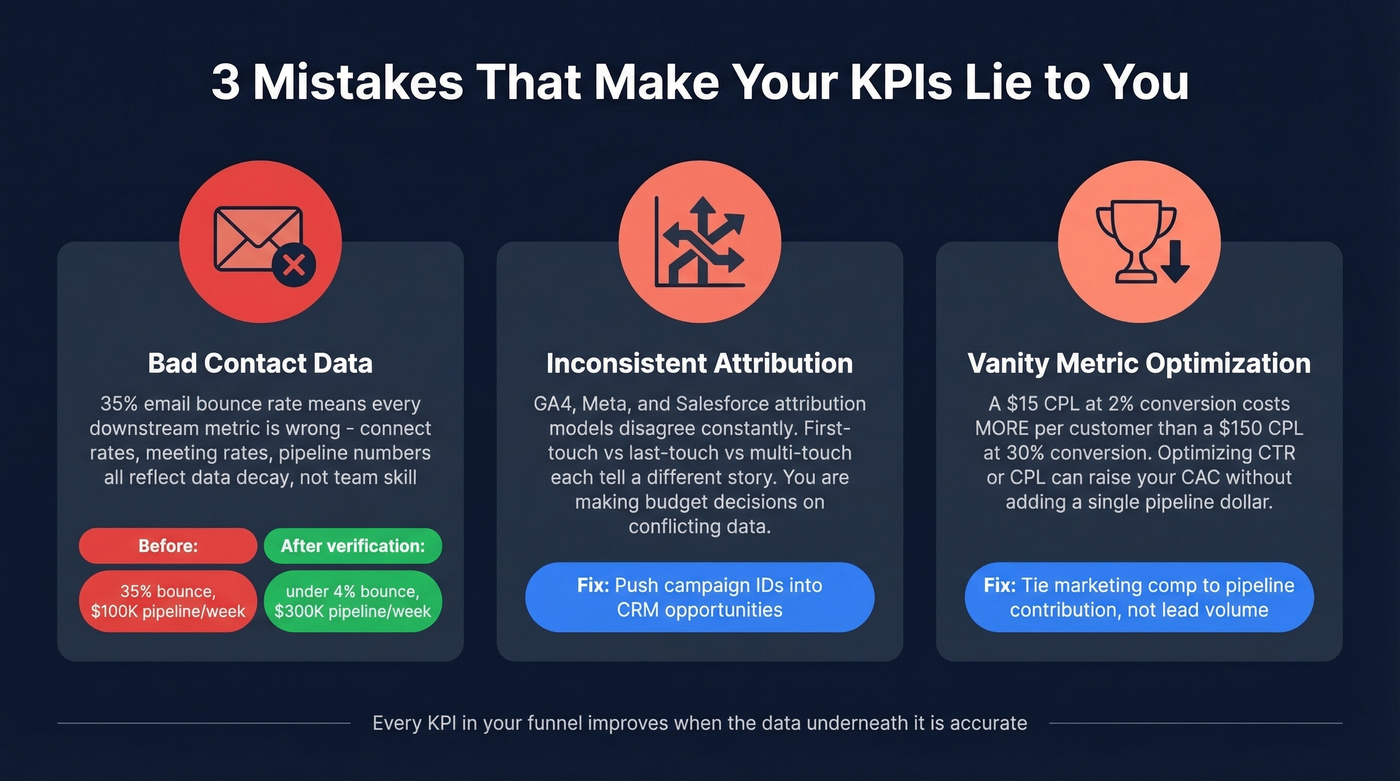
Inconsistent attribution. GA4, Meta, and Salesforce default attribution models disagree with each other constantly. First-touch, last-touch, multi-touch - each tells a different story depending on which window you trust. Push campaign IDs into CRM opportunities so you can measure impact by channel. Without this, you're making budget decisions on conflicting data.
Vanity metric optimization. Optimizing to CTR or CPL can raise your CAC without adding a single pipeline dollar. Missing SLAs between marketing and sales make it worse - no one owns the handoff, and no one's accountable when leads rot. Skip this trap entirely: tie marketing comp to pipeline contribution, not lead volume.
Diagnosing Funnel Leakage
Even with the right KPI framework, revenue still disappears between stages. Lead gen leakage - the silent loss of qualified prospects between handoff points - is the most underdiagnosed problem in B2B funnels, and in our experience it accounts for more lost revenue than bad targeting ever does. If you want a clean way to map it, use a lead generation workflow.
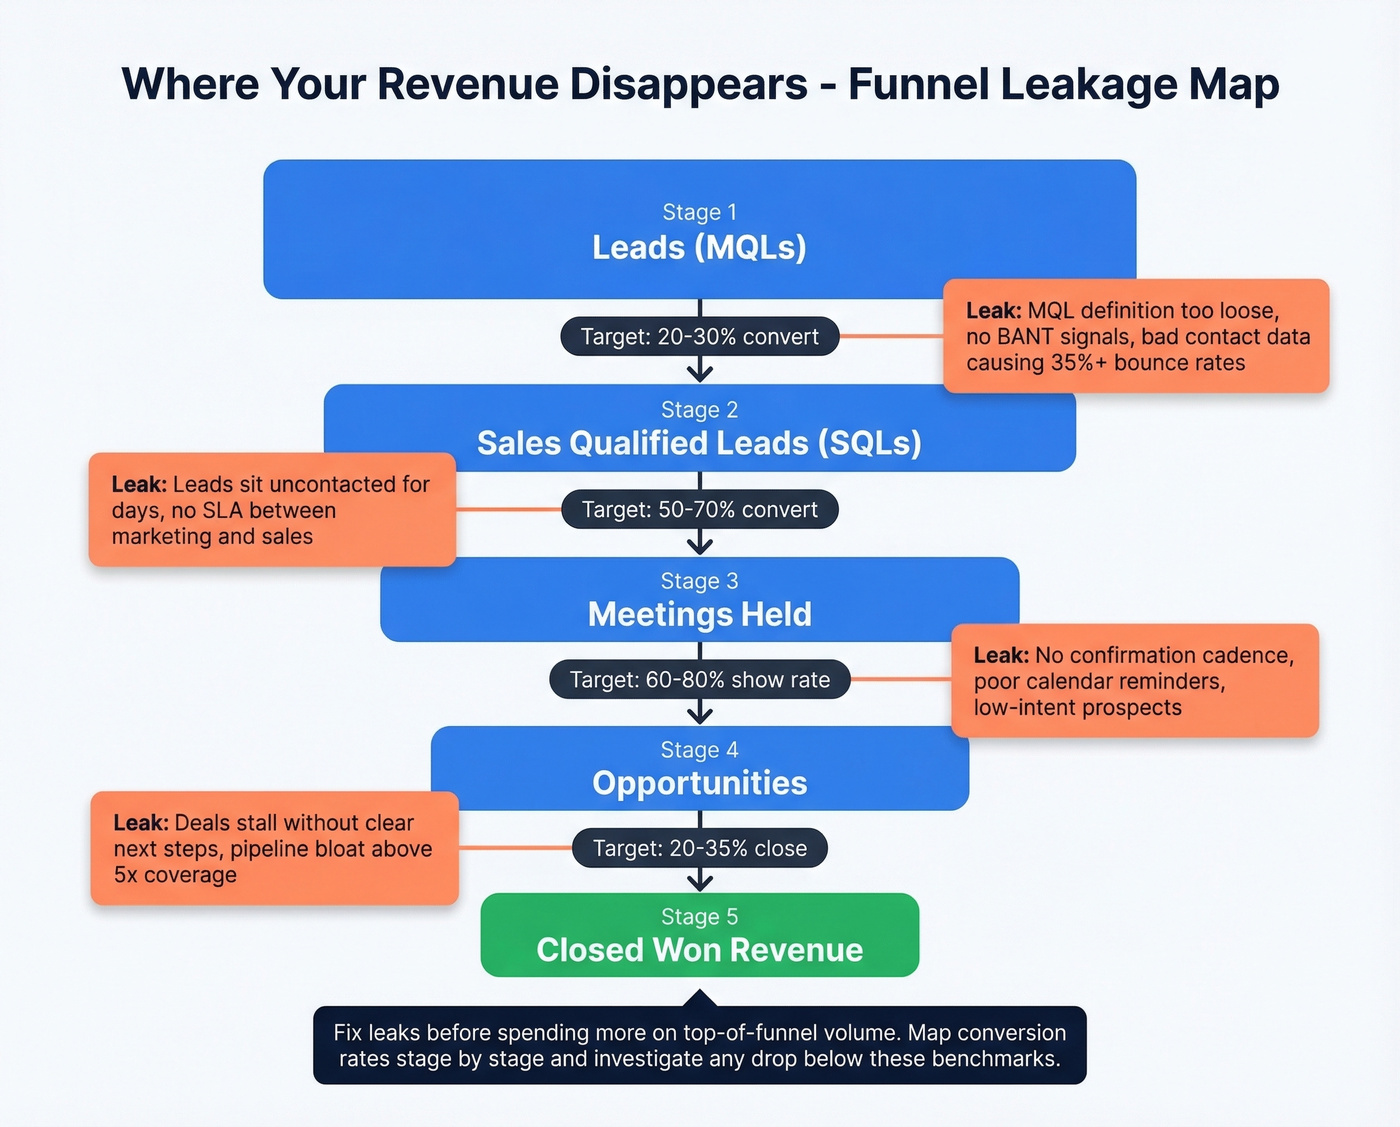
Common leak points include the MQL-to-SQL handoff where leads sit uncontacted for days, the meeting-to-opportunity gap where show rates crater, and the proposal-to-close stage where deals stall without a clear next step. Map your conversion rates stage by stage. Any drop below the benchmarks in the table above signals a leak worth investigating before you spend another dollar on top-of-funnel volume.
Fix the Data, Fix the KPIs
Every KPI on this list sits on top of data quality. If your SDRs dial disconnected numbers and email invalid addresses, no dashboard redesign will save you.
Before you rebuild your reporting framework, verify your contact data. It's the single highest-leverage fix you can make before your next campaign - and it's the foundation that makes every sales lead generation KPI trustworthy. Tools like Prospeo, which refreshes its 300M+ profile database every 7 days against an industry average of 6 weeks, exist specifically for this layer of the stack. Accurate data in, accurate KPIs out. If you're evaluating vendors, start with data enrichment services and a dedicated sdr tool.
Your pipeline coverage ratio means nothing if half your contacts are dead emails. Prospeo refreshes 300M+ profiles every 7 days - not the 6-week industry average - so your reps connect with real buyers, not bounced addresses. At $0.01 per email, cleaning up your pipeline costs less than one stale deal sitting in your CRM.
Every KPI in your funnel improves when the data underneath it is accurate.
FAQ
What's the most important sales lead generation KPI?
Pipeline velocity. It converts your funnel into revenue-per-day using four inputs: opportunities, deal size, win rate, and cycle length. If you can only watch one number weekly, track velocity and aim to improve it by 10-20% per quarter through tighter qualification and faster deal progression.
What's a good MQL-to-SQL conversion rate?
20-30% for most B2B teams. Anything under 15% usually means your MQL definition is too broad. Tighten criteria around role, urgency, and basic BANT signals, then re-check SQL volume after 2-4 weeks to confirm the change didn't just hide bad leads.
How fast should you respond to a new lead?
Under 5 minutes if you want a real edge, because only 25% of companies hit that mark and 39% take over 2 hours or never respond at all. Set an SLA of 5 minutes for inbound forms and 15 minutes for demo requests.
What tool helps keep KPIs accurate?
A data verification and enrichment tool keeps KPIs honest by reducing bounce rates and disconnected dials, which directly lifts connect rate and meeting rate. Any platform that offers real-time verification and frequent data refreshes will stabilize your conversion reporting - the key is catching decay before it corrupts your funnel math.
Track What Predicts Revenue
If your dashboard is full of "activity" but revenue is flat, your measurement system is probably rewarding the wrong behavior. Use pipeline velocity, MQL-to-SQL conversion, speed-to-lead, meetings held, CAC, coverage, and CLV:CAC as your core set. Fix data quality first so your sales lead generation KPIs reflect performance, not noise.