Sales Metrics That Actually Matter: Benchmarks, Formulas & What Nobody Tracks
Pipeline is up 40%. Activity numbers look great. The board deck is full of green arrows. Revenue is flat.
If that sounds familiar, you're tracking the wrong sales metrics - and you're not alone. Only 52% of CEOs believe in their own growth plans, and 84% of reps missed quota last year. The disconnect isn't effort. It's measurement.
Most sales teams track too many metrics, track the wrong ones, or track the right ones without the benchmarks to know whether their numbers are good, bad, or mediocre. Every metric below comes with a formula, a worked example, and a target range so you can stop guessing and start diagnosing.
Start Here: Five Core Metrics
If you're building a measurement framework from scratch, start with five. Everything else is refinement.
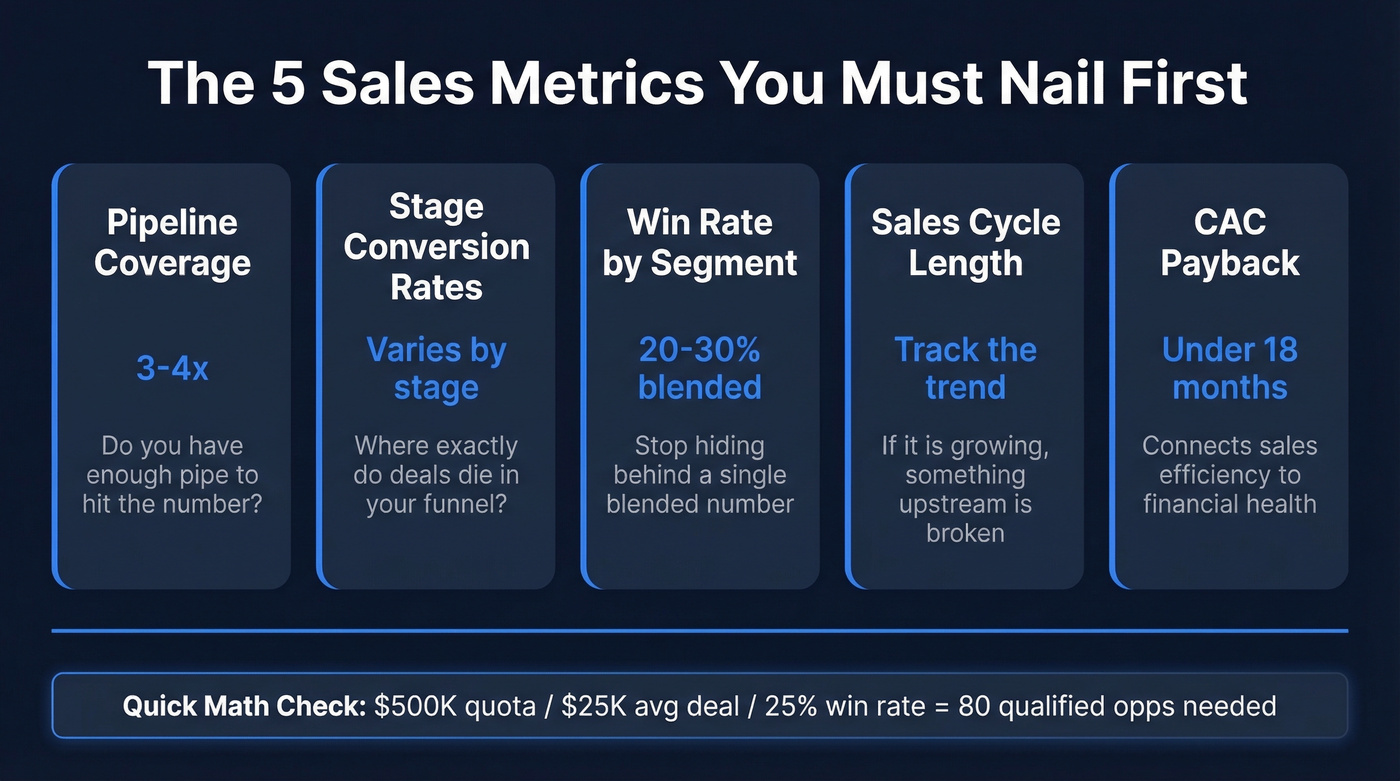
- Pipeline coverage - tells you whether you have enough pipe to hit the number (target: 3-4x)
- Stage conversion rates - reveals where deals die in your funnel, not just that they die
- Win rate by segment - a blended win rate hides the fact that you crush SMB and lose every enterprise deal
- Sales cycle length - the silent killer of forecasts; if it's growing, something upstream is broken
- CAC payback - connects sales efficiency to financial health; if payback exceeds 18 months, you're burning cash
Nail these five before adding anything else. Here's a quick backward-math check: if your quota is $500K, your average deal is $25K, and your win rate is 25%, you need 80 qualified opportunities in the pipeline. Work backward from revenue to deals to demos to leads - that's how you know whether your activity targets make sense.
What Are Sales Metrics?
These are quantifiable data points that measure how your sales process performs, from lead generation through close and expansion. They're the diagnostic layer between "we're selling stuff" and "we understand why revenue moves."
The distinction between metrics and KPIs trips people up. All KPIs are metrics, but not all metrics are KPIs. A KPI is a metric you've promoted to strategic importance because it's tied to a specific goal - like hitting $5M ARR this quarter. You might track 25 metrics but only promote 5-7 to KPI status. Those show up on the exec dashboard and drive weekly decisions.
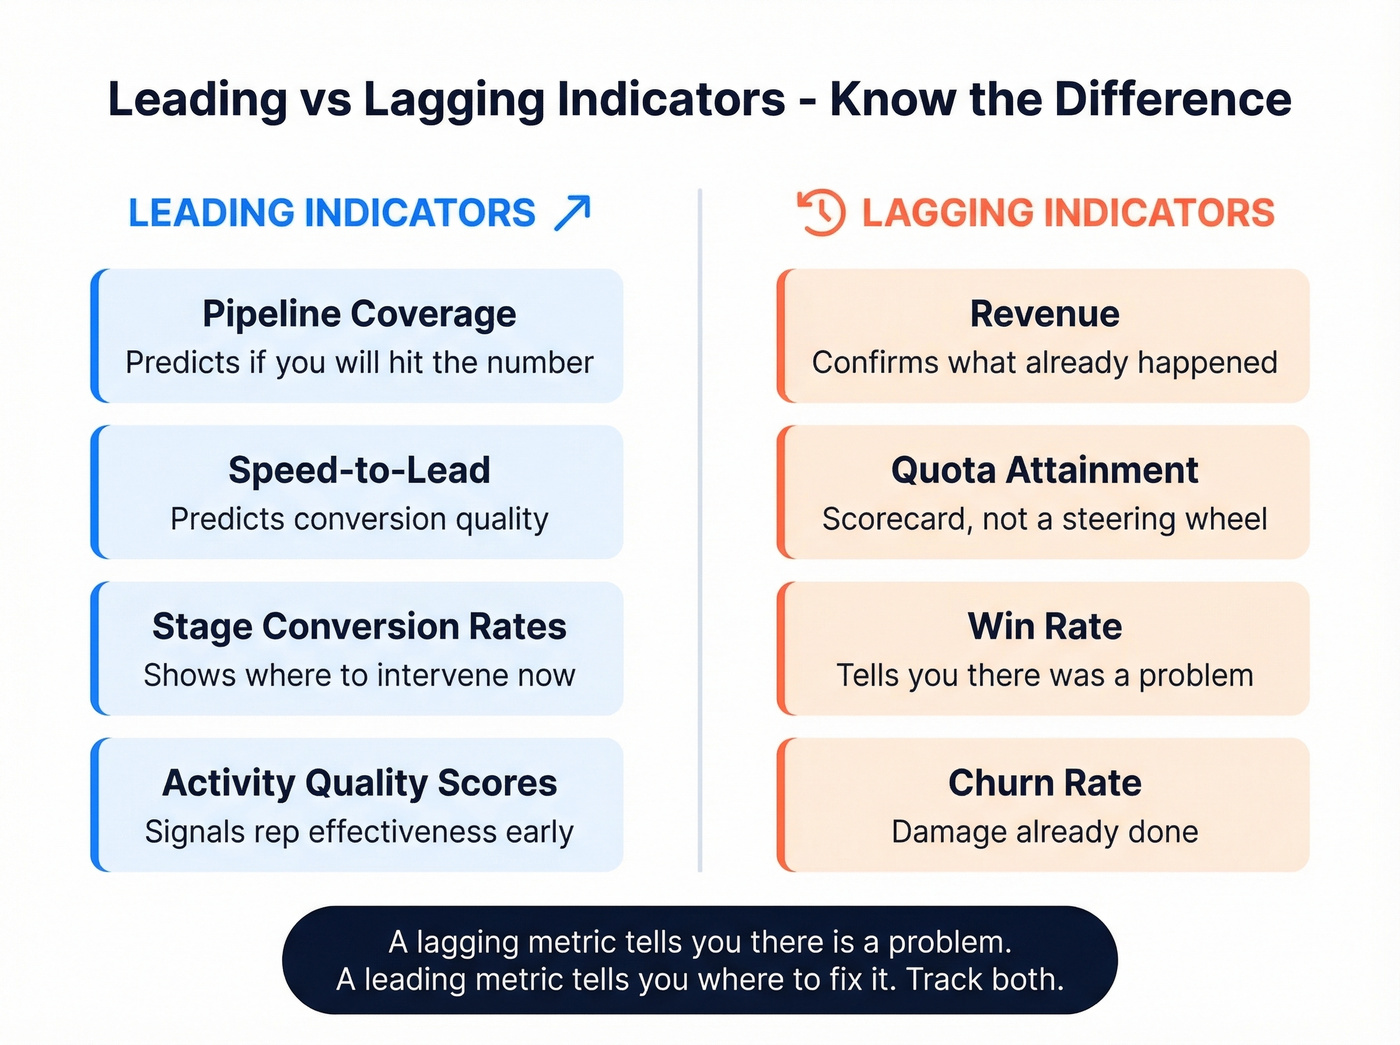
The more useful distinction is leading vs. lagging. Leading indicators predict future outcomes. Lagging indicators confirm what already happened. Most teams over-index on lagging indicators and then wonder why they can't course-correct in time.
| Type | What It Tells You | Examples |
|---|---|---|
| Leading | What's likely to happen | Pipeline coverage, speed-to-lead, activity quality |
| Lagging | What already happened | Revenue, quota attainment, churn rate |
| Leading | Where to intervene now | Stage conversion rates, ramp time |
| Lagging | Whether interventions worked | Win rate, CAC payback, NRR |
A lagging metric tells you there's a problem. A leading metric tells you where to fix it. The best sales orgs track both in tandem - understanding which indicators drive action versus which merely confirm history.
The 25 Metrics That Matter
These are organized into seven diagnostic categories adapted from the Brevet Group's framework. Each category answers a different question about your org's health.
Overall Performance
Revenue growth rate measures year-over-year or quarter-over-quarter top-line growth. Formula: ((Current Period Revenue - Prior Period Revenue) / Prior Period Revenue) x 100. Median SaaS growth sits at 26% annually - if you're below that, you're losing ground relative to peers.
Quota attainment is the percentage of reps hitting their number. Track the distribution, not just the average. If 20% of reps carry 80% of revenue, you don't have a sales team. You have a few closers and a hiring problem.
Forecast accuracy compares predicted revenue to actual closed revenue. Formula: (Actual Revenue / Forecasted Revenue) x 100. Below 80% accuracy means your pipeline stages need recalibration or your reps are sandbagging.
Opportunity Generation
Lead-to-MQL conversion measures how many raw leads become marketing-qualified. Benchmark: 35-45%. Below 35% and your top-of-funnel targeting is off.
MQL-to-SQL conversion is where most funnels hemorrhage prospects. Benchmark: ~15%. This is the largest single drop-off in the B2B funnel, and it's where sales and marketing alignment either works or doesn't.
Cost per lead varies wildly by channel - self-serve can run ~$100 while LinkedIn Ads often exceed $2,000. The number itself matters less than the trend. If CPL rises while conversion holds steady, you're fine. If CPL rises and conversion drops, you're buying worse leads.
Speed-to-lead is the time between a lead's first action and your first response. Responding within 1 minute increases conversion by 391%. Most teams measure this and still take 24 hours to respond.
Opportunity Management
Win rate = Deals Won / Total Opportunities (Won + Lost). Worked example: 30 won out of 150 total = 20% win rate. Always segment by deal size, source, and segment. A blended 25% win rate might hide a 40% SMB rate and a 5% enterprise rate - those require completely different interventions.
Sales cycle length = average days from opportunity creation to close. Enterprise cycles run 3-12 months; SMB can close in days. Track the trend more than the absolute number - a cycle lengthening by 10% quarter-over-quarter signals increasing deal complexity or competitive pressure. The average B2B deal now involves 13 decision-makers, which is a major reason cycles keep stretching.
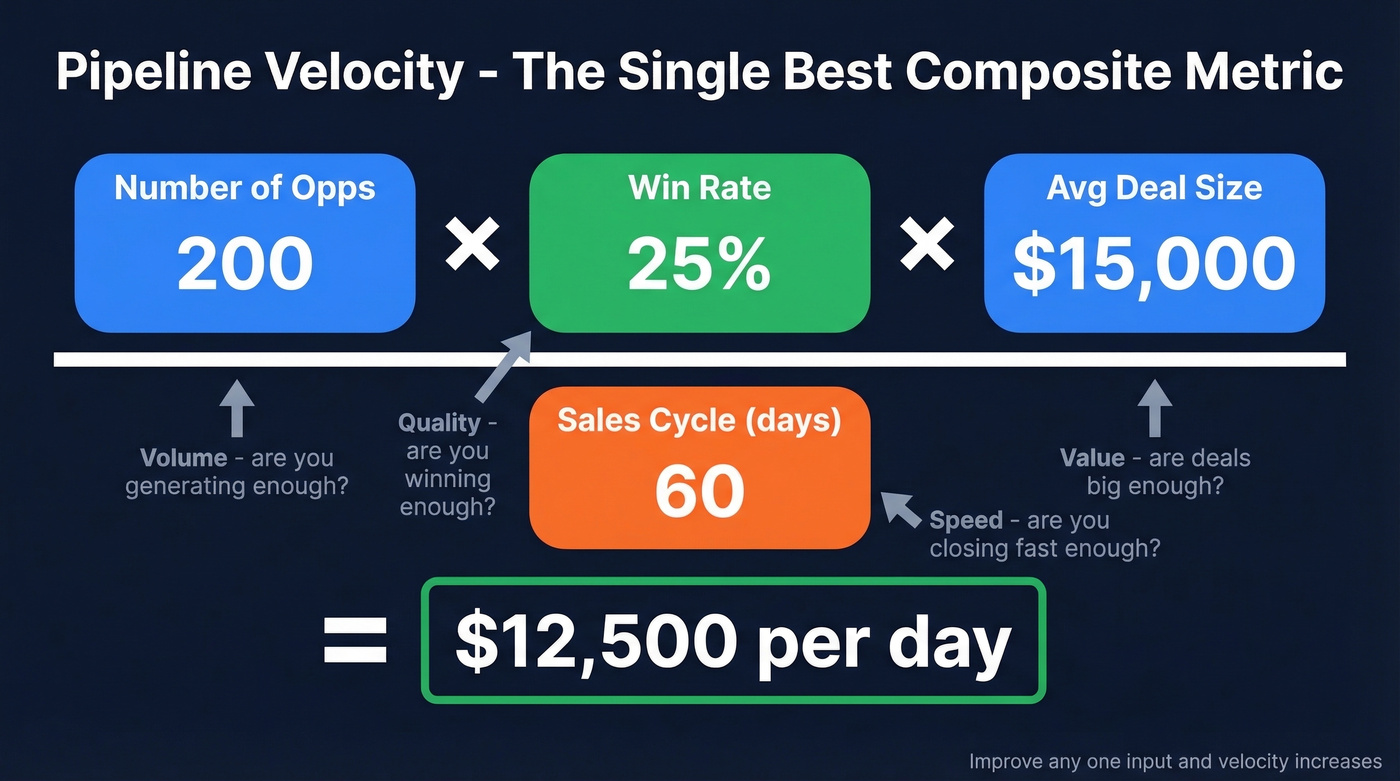
Pipeline velocity tells you how fast revenue moves through your pipeline. Formula: (Number of Opps x Win Rate x Average Deal Size) / Sales Cycle Length. Worked example: (200 opps x 0.25 x $15,000) / 60 days = $12,500/day. This is the single best composite indicator for pipeline health because it captures volume, quality, deal size, and speed in one number.
Deal slippage tracks deals that miss their projected close date. If more than 30% of your committed deals slip each quarter, your reps are either sandbagging or losing control of the buying process. Pair this with sales linearity - if 60%+ of revenue closes in the last two weeks, your team is discount-dependent and your forecasts are fiction.
Average deal size = Total Revenue / Number of Deals. Track by segment and by rep. A rep whose average deal size is growing is likely moving upmarket, which is great unless they're ignoring the bread-and-butter deals that keep the lights on.
Customer Growth
Churn rate = Customers Lost / Total Customers at Start of Period. Target: under 1% monthly (~5% annually). B2B SaaS averages about 4.9% annual churn. If you're above that, fix your post-sale experience before pouring more into acquisition. (If you need a deeper breakdown, see our churn analysis guide.)
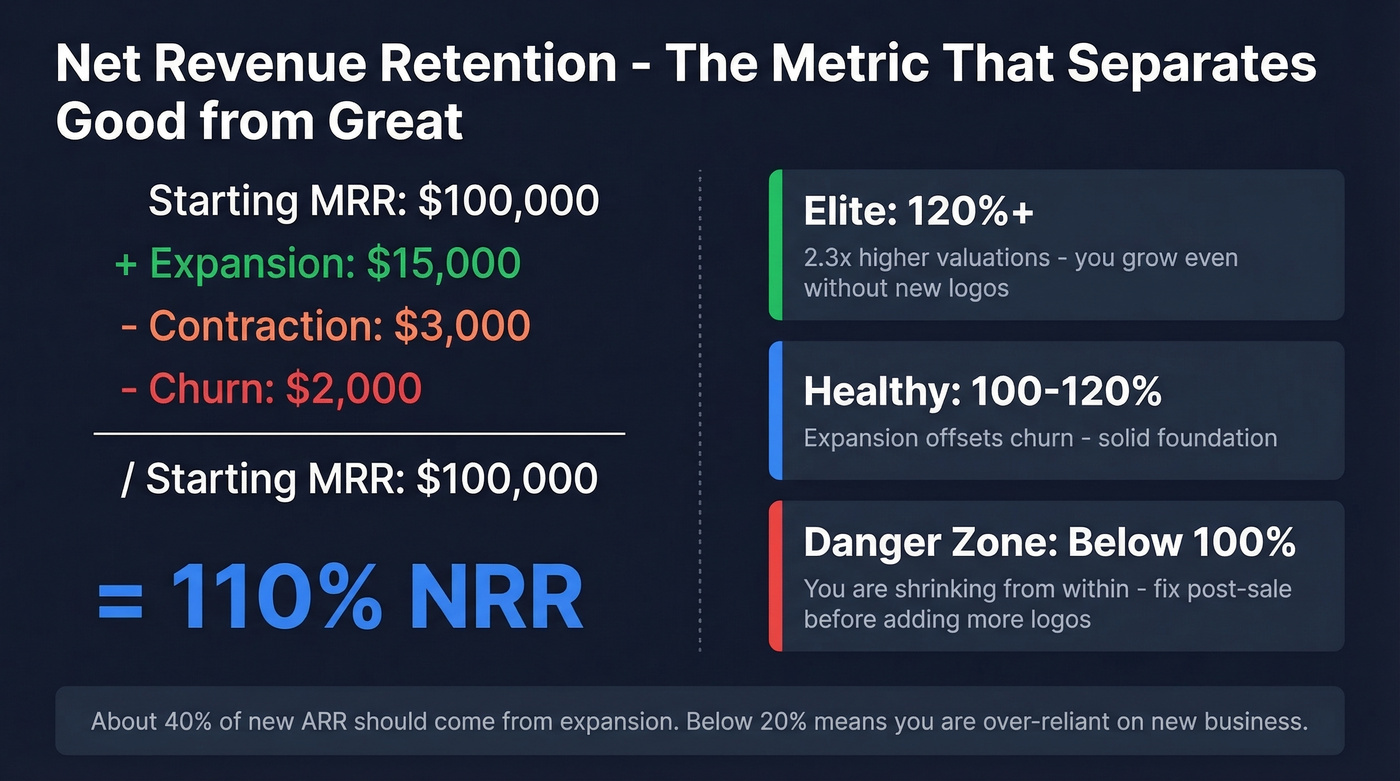
Net revenue retention (NRR) = (Starting MRR + Expansion - Contraction - Churn) / Starting MRR. Worked example: ($100K + $15K - $3K - $2K) / $100K = 110% NRR. Top performers hit 120%+, and companies at that level command 2.3x higher valuations. NRR above 100% means you grow even without new logos.
Expansion revenue % tracks how much new ARR comes from existing customers. Benchmark: ~40% of new ARR should come from expansion. Below 20% means you're over-reliant on new business and under-investing in account growth. (More on this in Cross Selling vs Upselling.)
LTV:CAC = Customer Lifetime Value / Customer Acquisition Cost. Worked example: if LTV is $36,000 and CAC is $9,000, your ratio is 4:1. Healthy range is 3:1 to 5:1. Below 3:1 means you're spending too much to acquire. Above 5:1 might mean you're under-investing in growth. (If you want a CAC-only deep dive, see cost to acquire customer.)
Sales Talent
Ramp time is how long a new rep takes to hit full productivity. If ramp is 8+ months, your onboarding process is the bottleneck, not your hiring. (Use a structured 30-60-90 day plan for sales reps to shorten ramp.)
Rep attainment distribution shows the spread of performance across the team. Plot a histogram. If it's bimodal - a cluster at 40% and another at 120% - you have a coaching problem, not a quota problem.
Open seat % measures unfilled sales positions as a percentage of total headcount. Every open seat is lost pipeline capacity. Above 15% and you're structurally unable to hit the team number regardless of individual performance.
Sales Management
Pipeline coverage = Total Pipeline Value / Quota. Worked example: $4.5M in pipeline against a $1.5M quota = 3x coverage. Target: 3-4x for most B2B orgs. Below 3x and you're relying on heroics. Above 5x and your pipeline is full of stale deals. (For more targets, see sales pipeline benchmarks.)
Coaching time % measures how much of a manager's week goes to actual coaching vs. admin, forecasting, and internal meetings. The best managers spend 40%+ coaching. Most spend under 20%.
Forecast accuracy by manager isolates which managers can actually call their number. If one manager is consistently 90%+ accurate and another is at 60%, the second manager doesn't understand their pipeline - and their team doesn't either. (If forecasting is the pain point, compare sales forecasting solutions.)
Efficiency & Compensation
CAC = Total Sales & Marketing Spend / New Customers Acquired. Average B2B SaaS CAC runs ~$1,200, but enterprise deals can exceed $5,000 per customer. Self-serve models can get CAC under $100.
CAC payback = CAC / Monthly Gross Profit per Customer. Monthly Gross Profit per Customer = Monthly Revenue per Customer x Gross Margin. Worked example: $12,000 CAC / ($1,000 MRR x 0.75 margin) = 16 months. Median is 15-18 months; elite teams hit under 12.
Cost of sales = Total Sales Expense / Total Revenue. If cost of sales is climbing while revenue growth is flat, you're scaling the wrong things.
Benchmarks: What "Good" Looks Like
Numbers without context are useless. Here's what "good" looks like across industries, funnel stages, and SaaS segments.
B2B Conversion Rates by Industry
| Industry | Conversion Rate |
|---|---|
| Legal Services | 7.4% |
| Professional Services | 4.0-6.0% |
| Manufacturing | 3.0-5.0% |
| Finance/Banking | 3.0-4.0% |
| B2B SaaS | 1.1-7.0% |
| B2B E-commerce | 1.8% |
The median B2B conversion rate is 2.9%, with a typical range of 2.0-5.0%. SaaS has the widest variance because "SaaS" covers everything from self-serve $9/mo tools to six-figure enterprise platforms. (If you want a dedicated breakdown, see sales conversion rate.)
Funnel Stage-to-Stage Conversion
| Stage Transition | Benchmark |
|---|---|
| Lead to MQL | 35-45% |
| MQL to SQL | ~15% |
| SQL to Opportunity | 25-30% |
| Opportunity to Closed-Won | 6-9% |
| Lead to Customer (overall) | 1.5-2.5% |
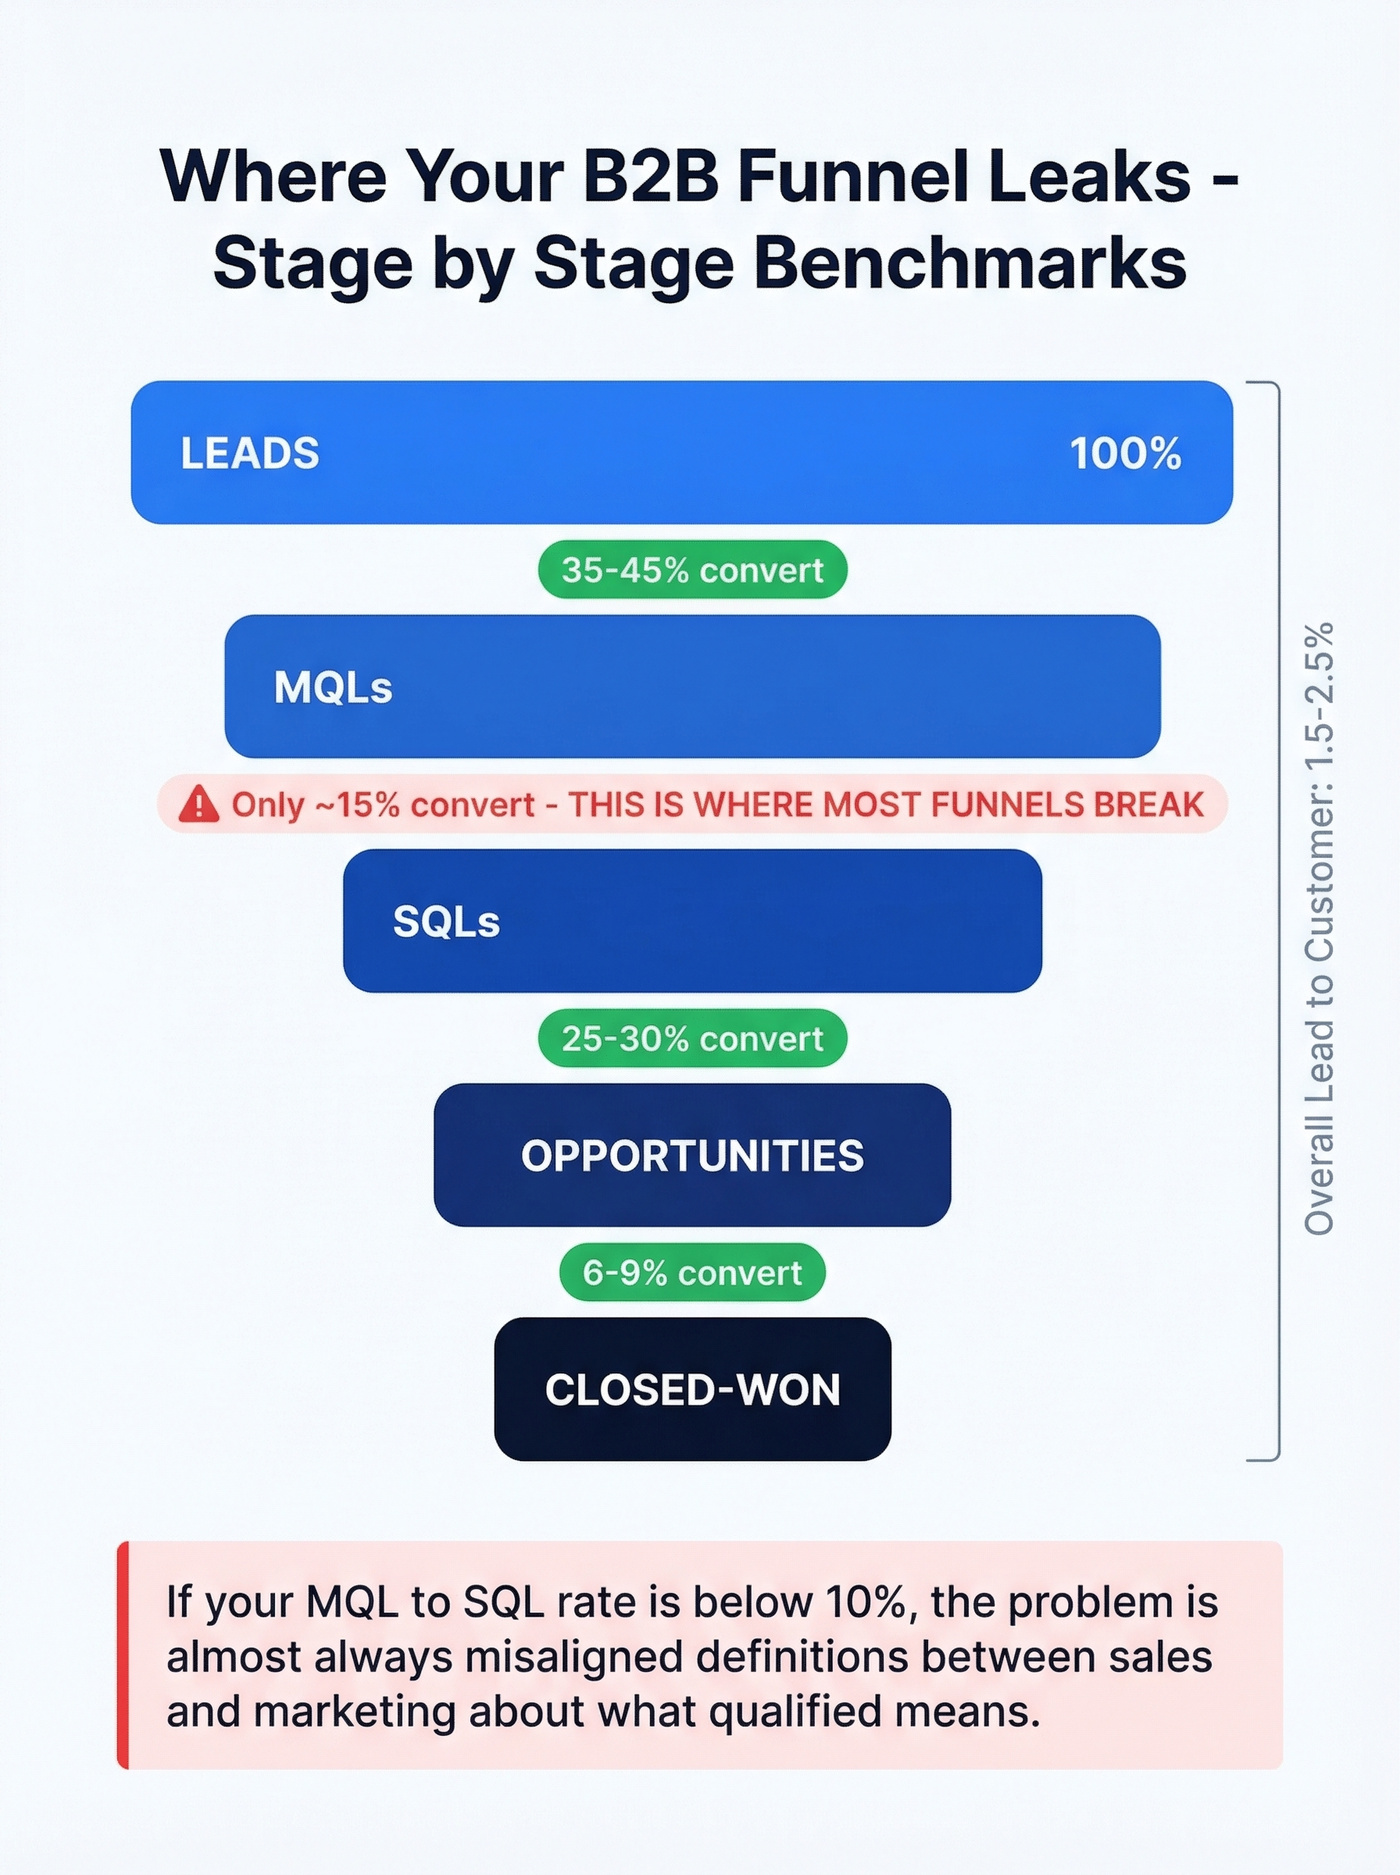
The MQL-to-SQL handoff is where most funnels break. If your number is below 10%, the problem is almost always misaligned definitions between sales and marketing about what "qualified" means. (A full framework is in our AIDA sales funnel guide.)
SaaS Segment Benchmarks
| Metric | SMB | Mid-Market | Enterprise |
|---|---|---|---|
| ACV | < $15K | $15K-$100K | > $100K |
| Sales Cycle | Days-weeks | 1-3 months | 3-12 months |
| CAC Payback | 8-12 months | 14-18 months | 18-24 months |
LTV:CAC should land between 3:1 and 5:1 regardless of segment. NRR of 120%+ is the gold standard - companies at that level don't just retain customers, they grow them. Churn targets are universal: under 1% monthly, under 5% annually.
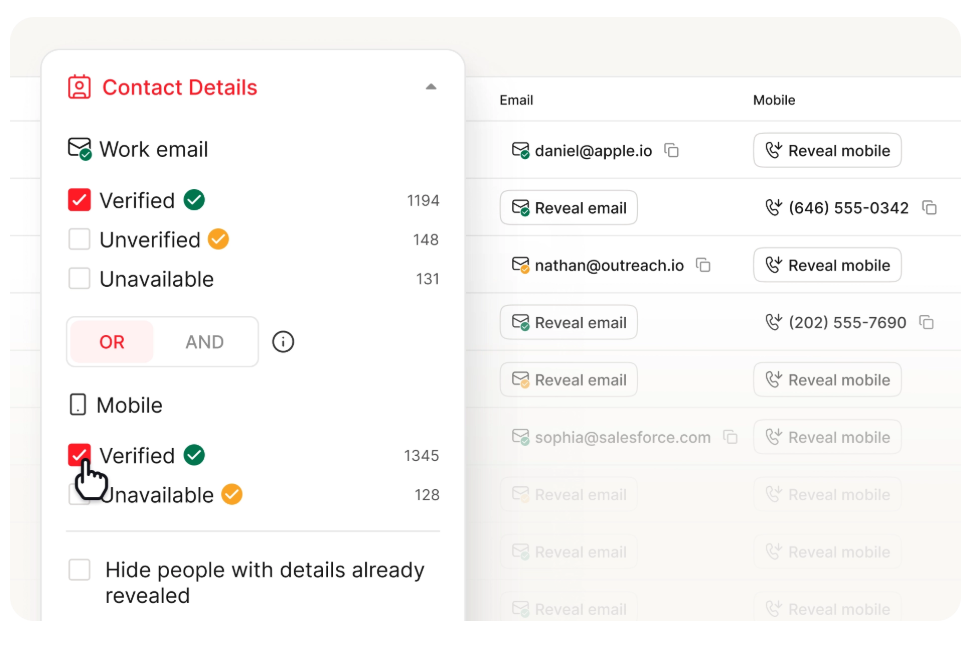
Pipeline velocity depends on four variables - but none of them matter if your contact data is wrong. Bad emails kill speed-to-lead, inflate sales cycles, and tank conversion rates. Prospeo delivers 98% email accuracy with a 7-day refresh cycle, so every metric in your funnel starts on solid ground.
Stop diagnosing pipeline problems caused by bad data.
SaaS-Specific Metrics
SaaS businesses live and die by a handful of indicators rarely seen in other models. If you're selling subscriptions, these are non-negotiable.
MRR and ARR are your baseline. MRR x 12 = ARR. Simple, but the decomposition matters - break ARR into new, expansion, contraction, and churned components. That decomposition tells you whether growth is healthy or masking problems.
NRR vs. GRR - NRR includes expansion revenue; GRR doesn't. GRR target is 85-95% for B2B SaaS, with above 90% being strong. GRR below 85% means your core product isn't sticky enough, and expansion revenue is papering over a retention problem.
ARPU (Average Revenue Per User/Account) tells you whether you're moving upmarket or down. If ARPU is declining while customer count grows, you're winning more deals at lower price points - which has CAC payback implications.
About 40% of new ARR) at healthy SaaS companies comes from existing customers. ARR per employee should land between $150K and $250K - below that signals operational inefficiency. Gross margins should exceed 75% (median is 77%). And median ARR growth across SaaS sits at 26%, down from 47% in 2024. The era of growth-at-all-costs is over; efficient growth is the new benchmark.
AI-Era Sales Metrics for 2026
89% of revenue organizations now use AI, up from 34% in 2023. And 61% already use AI specifically for sales performance. But most teams still measure the old way - counting activities instead of outcomes.
The shift is from volume to relevance. 72% of buyers ignore generic outreach. Activity-based comp plans drive 43% more spam complaints. The KPIs sales leaders rely on need to catch up.
| Old Metric | AI-Era Replacement |
|---|---|
| Calls Made | Message Relevance Score |
| Emails Sent | Buyer Response Index |
| Meetings Held | Decision-Maker Attendance % |
| Generic Coverage | Stakeholder Coverage Score |
Message Relevance Score uses AI to evaluate whether outreach is personalized and contextually appropriate - not just whether it was sent. Buyer Response Index measures (replies + meetings booked) / total outreach, rewarding quality over volume. Decision-Maker Attendance % tracks whether the right people are in the room, not just whether a meeting happened. Stakeholder Coverage Score measures what percentage of the average 13 decision-makers per deal you've actually engaged. (If you're rebuilding outbound, start with sales prospecting techniques.)
Here's the thing: if your average deal is under $25K, you probably don't need half the indicators in this article. Focus on pipeline velocity, win rate, and CAC payback. The rest is optimization theater until you've nailed the fundamentals.
McKinsey's data on AI-enabled sales teams shows 10-15% efficiency improvements, up to 10% sales uplift, and 20-25% freed rep capacity. Forrester adds that top sellers spend 68% more time per account and target 40% fewer accounts - achieving 18% higher win rates and 35% faster deal cycles. The teams capturing that value aren't just adding AI tools. They're changing what they measure. If your comp plan still rewards "50 calls a day," you're incentivizing spam, not selling.
Why Sales Metrics Backfire
Teams build beautiful dashboards with 40+ metrics and still miss their number by 30%. The problem isn't measurement. It's measurement without discipline.
The r/sales community nails this: managers use dashboards as a crutch because they don't have time for real coaching. They see a number dip, react with a mandate ("more calls!"), and never investigate why the number dipped. The result is gaming. An SDR celebrates 500 calls in a week while their meeting-to-opportunity rate tanks to 5%. The activity metric looks great. The business outcome is terrible.
The "tension metrics" concept from that same thread is worth internalizing. Every measurement exists in tension with quality, time, and resources. Push speed-to-lead too hard and reps skip qualification. Push deal size too hard and cycle length explodes. Push activity volume and quality craters. The fix isn't more metrics - it's pairing every metric with its natural counterweight.
Stop adding metrics. Start subtracting. If a metric doesn't change a decision you'll make this quarter, remove it from the dashboard. Five you act on beat 25 you glance at.
Data Quality Is Metric Zero
Let's be honest: every metric on this page is fiction if it's built on bad contact data. Gartner pegs the average cost of poor data quality at $12.9M per year. That's not abstract - it shows up as inflated pipeline numbers, bounced email sequences, and conversion rates calculated against contacts who never existed. (If you're seeing high bounces, start with email bounce rate.)
We've seen this play out firsthand. One team's bounce rate sat at 35%, which meant their pipeline coverage, conversion rates, and CAC calculations were all built on garbage. After switching to Prospeo's 98%-accuracy verified emails on a 7-day refresh cycle, their bounce rate dropped under 4% and pipeline tripled from $100K to $300K per week. The metrics didn't change. The data underneath them did.
Dashboards That Drive Decisions
The stats on dashboard adoption are brutal. 72% of users regularly export data to Excel. 43% of SaaS professionals believe dashboards are dying. And when dashboards show stale data, 67% of users lose confidence in analytics entirely.
The problem isn't the concept - effective dashboards enable decisions 5x faster and cut reporting time by 80%. The gap between "effective" and "typical" is enormous, and in our experience it comes down to four principles:
5-second comprehension rule - if someone can't grasp the headline insight in 5 seconds, simplify. Role-based views - a CRO and an SDR manager need different dashboards. 6-8 widgets max per view. Real-time or near-real-time updates - stale data is worse than no data because it creates false confidence.
Match your review cadence to the metric type. Pipeline coverage and activity metrics deserve weekly reviews. Win rate, cycle length, and CAC payback are monthly metrics. NRR, LTV:CAC, and forecast accuracy by manager belong in quarterly deep-dives. Reviewing everything at the same cadence guarantees you'll drown in noise.
Skip the fancy BI tool if your team is under 20 reps. A well-structured CRM dashboard in HubSpot or Salesforce does 90% of the job. Tableau and Looker start earning their keep when you're stitching together data from multiple systems or need custom visualizations for board reporting. (If you're standardizing ops, see sales operations metrics.)
Sales Tracking Tools Worth Considering
| Tool | Starting Price | Best For |
|---|---|---|
| Prospeo | Free tier; ~$0.01/email | Contact data accuracy |
| Salesforce | ~$25/user/mo | Full CRM + reporting |
| HubSpot | Free tier; ~$20/user/mo | SMB, marketing alignment |
| Pipedrive | ~$15-25/user/mo | Pipeline-focused teams |
| Zoho CRM | ~$14-23/user/mo | Budget-conscious orgs |
| Tableau | ~$15/user/mo | Advanced visualization |
| Gong/Clari | Custom pricing | Revenue intelligence |
Prospeo sits in a different category than the CRMs and analytics tools above - it's the data foundation layer. With 98% email accuracy, 125M+ verified mobile numbers, and CRM enrichment returning 50+ data points per contact, it ensures the numbers flowing into your dashboards reflect reality. Free tier available, no contracts required. (If you're evaluating vendors, start with data enrichment services.)
Tracking CAC payback and cost per lead? At ~$0.01 per verified email, Prospeo is 90% cheaper than ZoomInfo - and teams book 26% more meetings. That's not a metric improvement. That's a structural advantage across your entire funnel.
Better data in, better metrics out. Every single time.
FAQ
What's the difference between sales metrics and KPIs?
All KPIs are metrics, but not all metrics are KPIs. A KPI is a metric tied to a specific strategic goal - like hitting $5M ARR this quarter. Track many data points; promote 5-7 that directly drive weekly decisions to KPI status.
How many metrics should a team track?
Five to seven core metrics across the diagnostic categories above. More than that creates dashboard clutter and decision paralysis. Pick indicators that change a decision this quarter and cut the rest.
Why do my metrics look good but revenue is flat?
You're likely tracking activity volume without quality indicators that reveal leakage - stage conversion rates, win rate by segment, and deal slippage. Bad contact data also inflates pipeline numbers; we've seen teams triple pipeline after cleaning their CRM with verified data and recalculating from accurate baselines.
What are the most important SaaS sales metrics?
Net revenue retention is the single most important - top performers hit 120%+ and command 2.3x higher valuations. Then CAC payback (under 18 months), LTV:CAC (3:1+), and monthly churn (under 1%).