The Only Sales Pipeline Template You Actually Need in 2026
84% of sales reps missed quota in 2024. Not because they couldn't sell - because they couldn't see. Their pipeline was a mess of stale deals, ghost contacts, and probability percentages someone made up in 2019. A solid sales pipeline template fixes that by giving every deal a stage, an owner, and a next step.
Here's the thing: 77% of sellers struggle to complete their tasks efficiently. Reps aren't lazy. They're drowning in admin because their pipeline system creates work instead of eliminating it, and with B2B buyers now splitting time equally between in-person, remote, and digital self-serve channels, the deals sitting in your pipeline are more complex and harder to track than they've ever been.
Just need the template? Grab our free pipeline spreadsheet below - no email required. Need the right numbers? We include default probability percentages and real conversion benchmarks for every stage. Need a system? Keep reading for the pipeline velocity formula, a weekly review framework, and five mistakes that kill forecasts.
What Is a Sales Pipeline?
Three terms get used interchangeably, and they shouldn't be.
A sales pipeline is seller-side and opportunity-centric. It tracks what your reps are doing to move deals forward - activities, stages, next steps. A sales funnel is prospect-side and conversion-centric, measuring how leads narrow through your marketing and qualification process. A forecast is a projection built from your pipeline: the output, not the system.
Your pipeline template needs to track deals, stages, owners, and next actions. Not visitor-to-lead conversion rates. Those belong in your marketing dashboard.
Free Templates for Google Sheets & Excel
No email gate. No paywall. The consensus on r/sales and r/Notion is clear: people want something they can open and use in two minutes, not something that requires a 14-day trial.
Some sites offer five or six separate downloads - a funnel template, a dashboard template, an analysis template. That's overkill. Both templates below consolidate pipeline tracking, weighted forecasting, and deal hygiene into a single sheet.
Both include these fields:
| Field | Why It Matters |
|---|---|
| Deal name | Identify the opp |
| Stage | Where it sits now |
| Value ($) | Revenue at stake |
| Probability % | Weighted forecast (deal value x stage probability) |
| Close date | Timeline pressure |
| Owner | Accountability |
| Next step | Drives action |
| Last activity | Spots stale deals |
Google Sheets Template
Best for teams that need real-time collaboration. Multiple reps can update simultaneously, and you can connect it to 2,000+ apps via Zapier. Built-in conditional formatting highlights stale deals and overdue next steps.
Download the Google Sheets template →
Excel Template
Better for offline work, heavy pivot table analysis, and environments where IT locks down cloud tools. Same fields, same structure, plus a pre-built pivot table for pipeline value by stage and by rep. Works in Excel 2016+.
Which Format to Pick
Use Google Sheets if your team is remote, collaborative, or already lives in Google Workspace. The real-time sync alone is worth it.
Use Excel if you need offline access, advanced pivot tables, or your company mandates Microsoft tools.
Skip Notion. The r/Notion community is full of people who built elaborate pipeline databases, then abandoned them because the maintenance felt like "constant repetitive work." A template that requires upkeep to function defeats the purpose.
The 7 Pipeline Stages (With Default Probability %)
Most B2B sales motions fit a seven-stage model. You can collapse or expand stages later, but this is a strong starting point - especially when buying committees average seven people in mid-sized firms, and clear stage definitions keep everyone aligned.
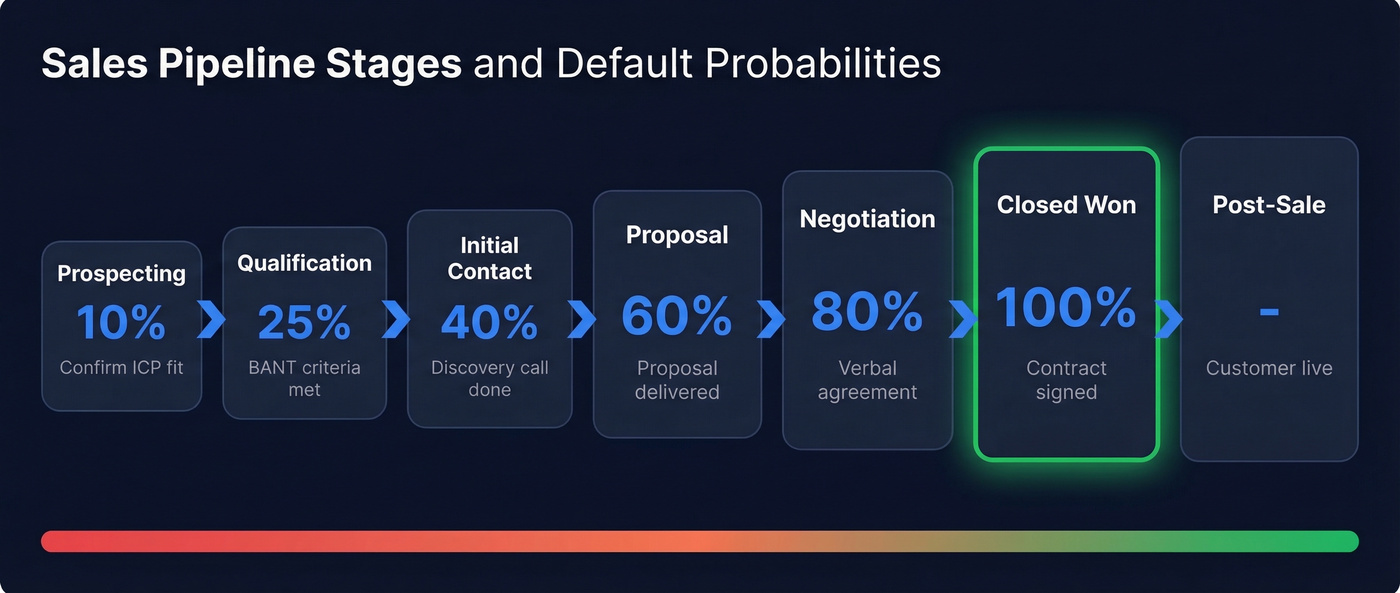
| Stage | What Happens | Exit Criteria | Default Prob. % |
|---|---|---|---|
| Prospecting | Identify potential buyers | Confirmed ICP fit | 10% |
| Qualification | Assess need, budget, authority, timeline | BANT criteria met | 25% |
| Initial Contact | First meaningful conversation | Discovery call completed | 40% |
| Proposal | Present solution and pricing | Proposal delivered + acknowledged | 60% |
| Negotiation | Handle objections, terms, procurement | Verbal agreement or redline | 80% |
| Closed Won | Deal signed | Contract executed | 100% |
| Post-Sale | Onboarding and handoff | Customer live + handoff complete | - |
These probability defaults are starting points, not gospel. A 60% at the proposal stage assumes your proposals are reasonably well-targeted. If you're sending proposals to everyone who takes a discovery call, your real probability is much lower. Calibrate using your own historical win rates after 2-3 quarters of data.
The exit criteria column is the most important and most ignored part of any pipeline template. Without clear criteria, reps advance opportunities based on vibes - and that's how you end up with a pipeline full of "80% probability" deals that never close. If your team already uses a CRM like HubSpot or Pipedrive, map these exit criteria to your CRM stage definitions so the spreadsheet and system stay in sync. (If you’re evaluating tools, see examples of a CRM.)
Pipeline Benchmarks
Stage-by-Stage Conversion Rates
These benchmarks come from Digital Bloom's analysis of 40+ benchmark studies. They're directional, but they give you a baseline to measure against. For more context, compare against our sales pipeline benchmarks.
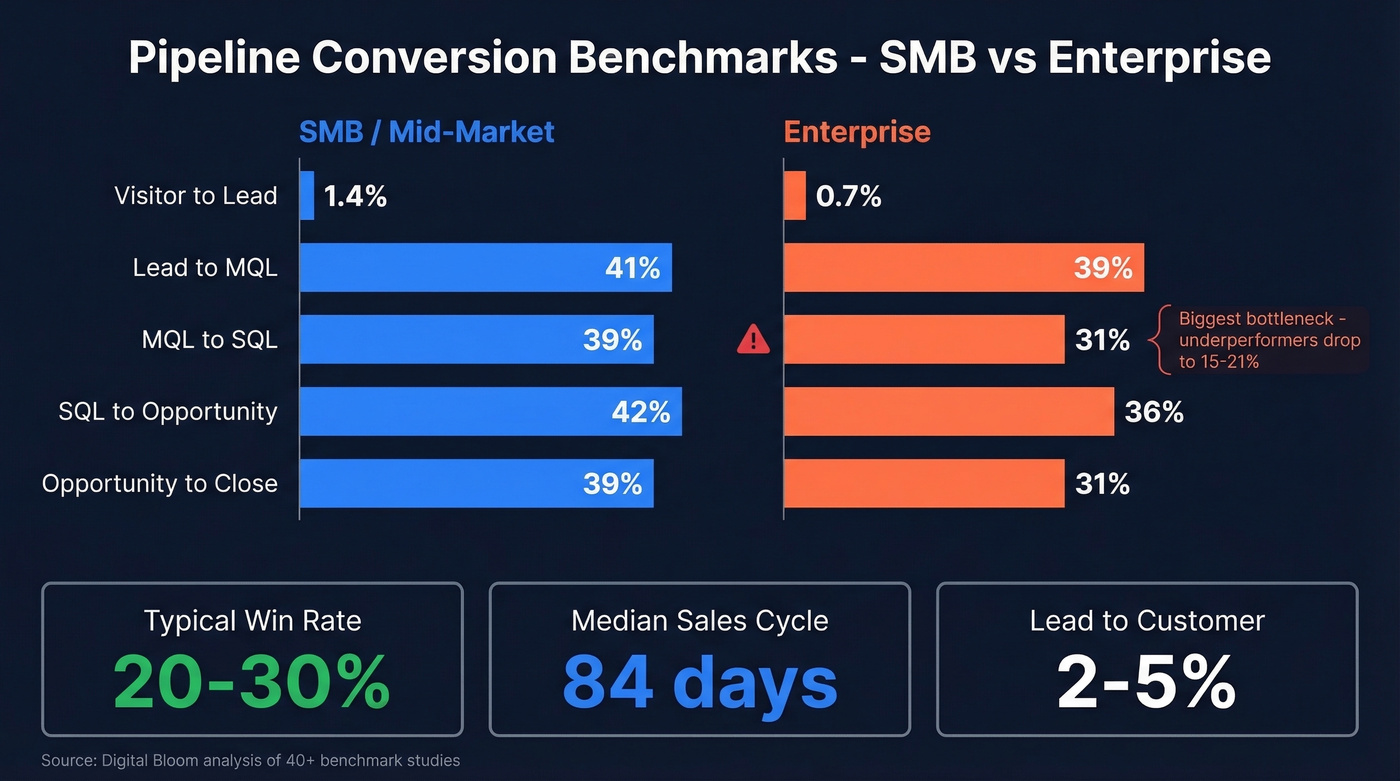
| Stage Transition | SMB/Mid-Market | Enterprise |
|---|---|---|
| Visitor → Lead | 1.4% | 0.7% |
| Lead → MQL | 41% | 39% |
| MQL → SQL | 39% | 31% |
| SQL → Opportunity | 42% | 36% |
| Opportunity → Close | 39% | 31% |
The biggest bottleneck across the board is MQL → SQL. Enterprise and SMB benchmarks sit in the 31-39% range, while underperforming organizations drop to 15-21%. If your pipeline feels thin, this is usually where the leak is - not lead generation, but lead qualification. (Related: lead scoring.)
Other benchmarks worth knowing: typical win rates land at 20-30%, median sales cycle runs 84 days (optimal is 46-75), and average lead-to-customer conversion sits at 2-5%. If you want a deeper breakdown, see sales conversion rate.
Pipeline Velocity Formula
Pipeline velocity tells you how much revenue moves through your pipeline per day. It's the single number that connects activity to revenue. If you want to track leading indicators, use a pipeline health checklist alongside this.
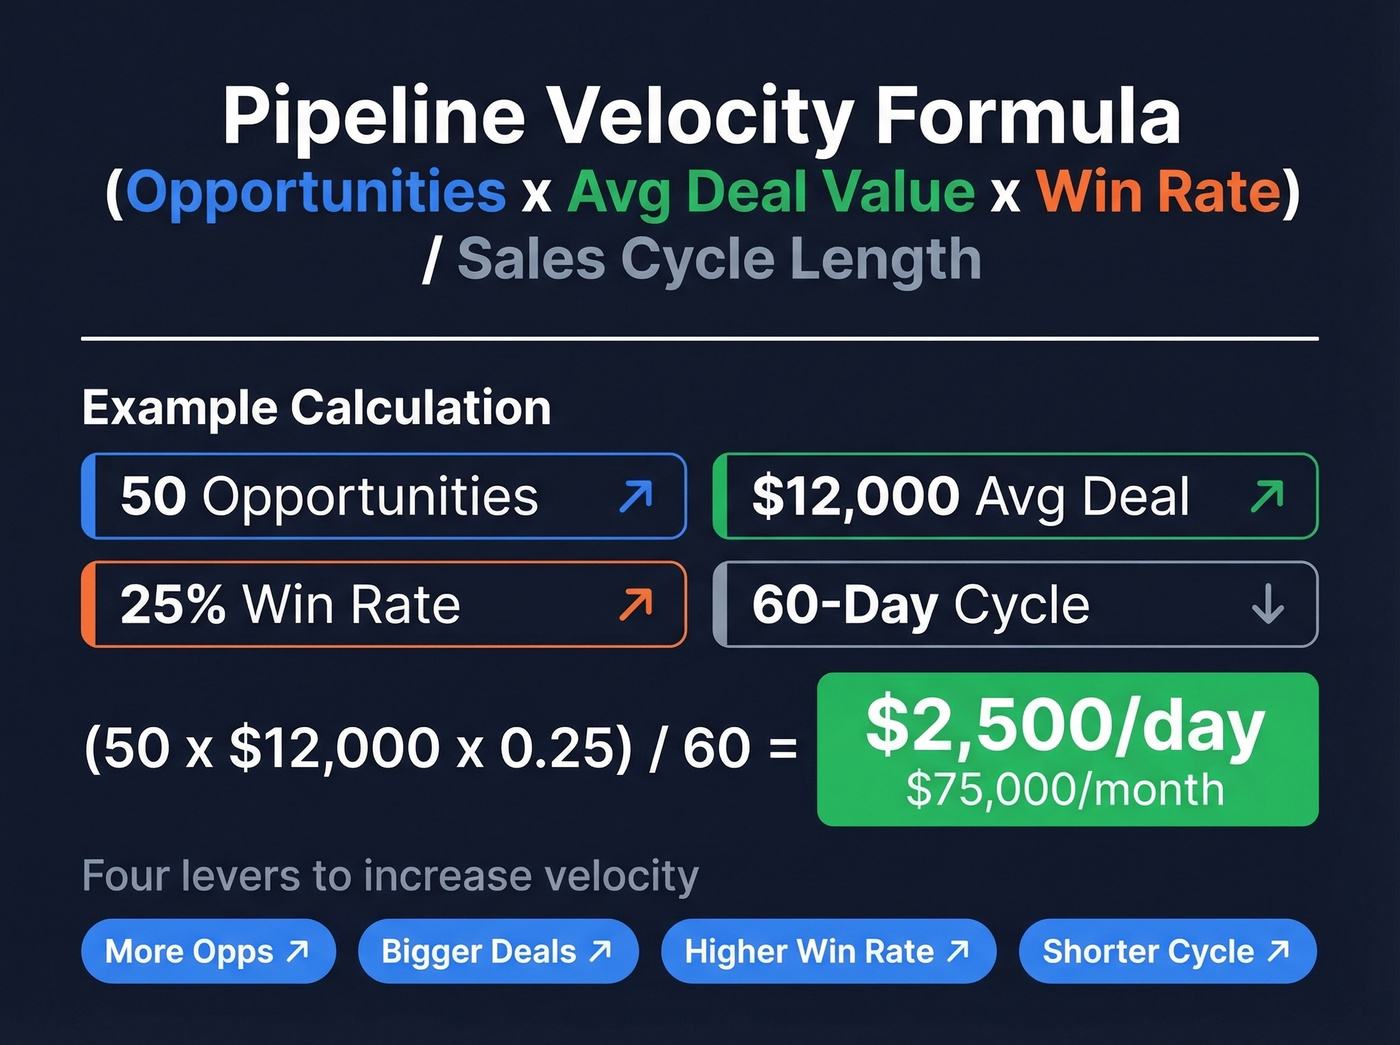
Velocity = (Opportunities x Avg Deal Value x Win Rate) / Sales Cycle Length
Say you've got 50 qualified opportunities, a $12,000 average deal value, a 25% win rate, and a 60-day sales cycle:
Velocity = (50 x $12,000 x 0.25) / 60 = $2,500/day
That's $75,000/month in expected closed revenue. If your monthly target is $100,000, you know exactly where the gap is - and you can pull four levers to close it: more opportunities, bigger deals, higher win rate, or shorter cycle.
A pipeline full of ghost contacts and bounced emails kills your forecast before it starts. Prospeo gives you 98% verified emails and 125M+ direct dials so every row in your template connects to a real buyer.
Stop tracking dead deals. Fill your pipeline with verified contacts.
How to Customize the Template
The template works out of the box, but a few adjustments make it yours.
Match stages to your sales motion. A SaaS company with a free trial might add a "Trial Active" stage between Initial Contact and Proposal. An agency selling retainers might collapse Proposal and Negotiation into one stage. The seven-stage model is a skeleton - dress it for your business. If you’re standardizing end-to-end, use a sales process optimization framework.
Calibrate probability using historical data. Pull your last 6-12 months of closed deals. What percentage of deals that reached each stage actually closed? Those are your real probabilities. We've seen teams discover their "Proposal" stage was really 35%, not 60%, which completely changed their forecast accuracy overnight. If forecasting is a priority, compare sales forecasting solutions.
Add custom fields sparingly. Lead source, ICP score, deal tags (new business vs. expansion), and competitor involved are all worth tracking. Don't add more than 3-4 custom fields - every column you add is a column reps have to fill out. Start with an ideal customer profile so reps aren’t guessing.
Adapt it as a business development pipeline template. For teams that separate business development from closing, add a "BDR Handoff" stage between Qualification and Initial Contact. This gives BDRs their own view of pipeline health and makes the handoff to account executives explicit rather than informal. (If you’re building the stack, see SDR tools.)
5 Mistakes That Kill Your Forecast
1. Inconsistent Prospecting
Reps prospect when the pipeline looks thin and stop when it looks full. This creates a boom-bust cycle that shows up in revenue 60-90 days later. The fix: block 60-90 minutes of prospecting daily, regardless of how healthy the pipeline looks today. Consistency beats intensity, every time. If you need a repeatable routine, use these sales prospecting techniques.
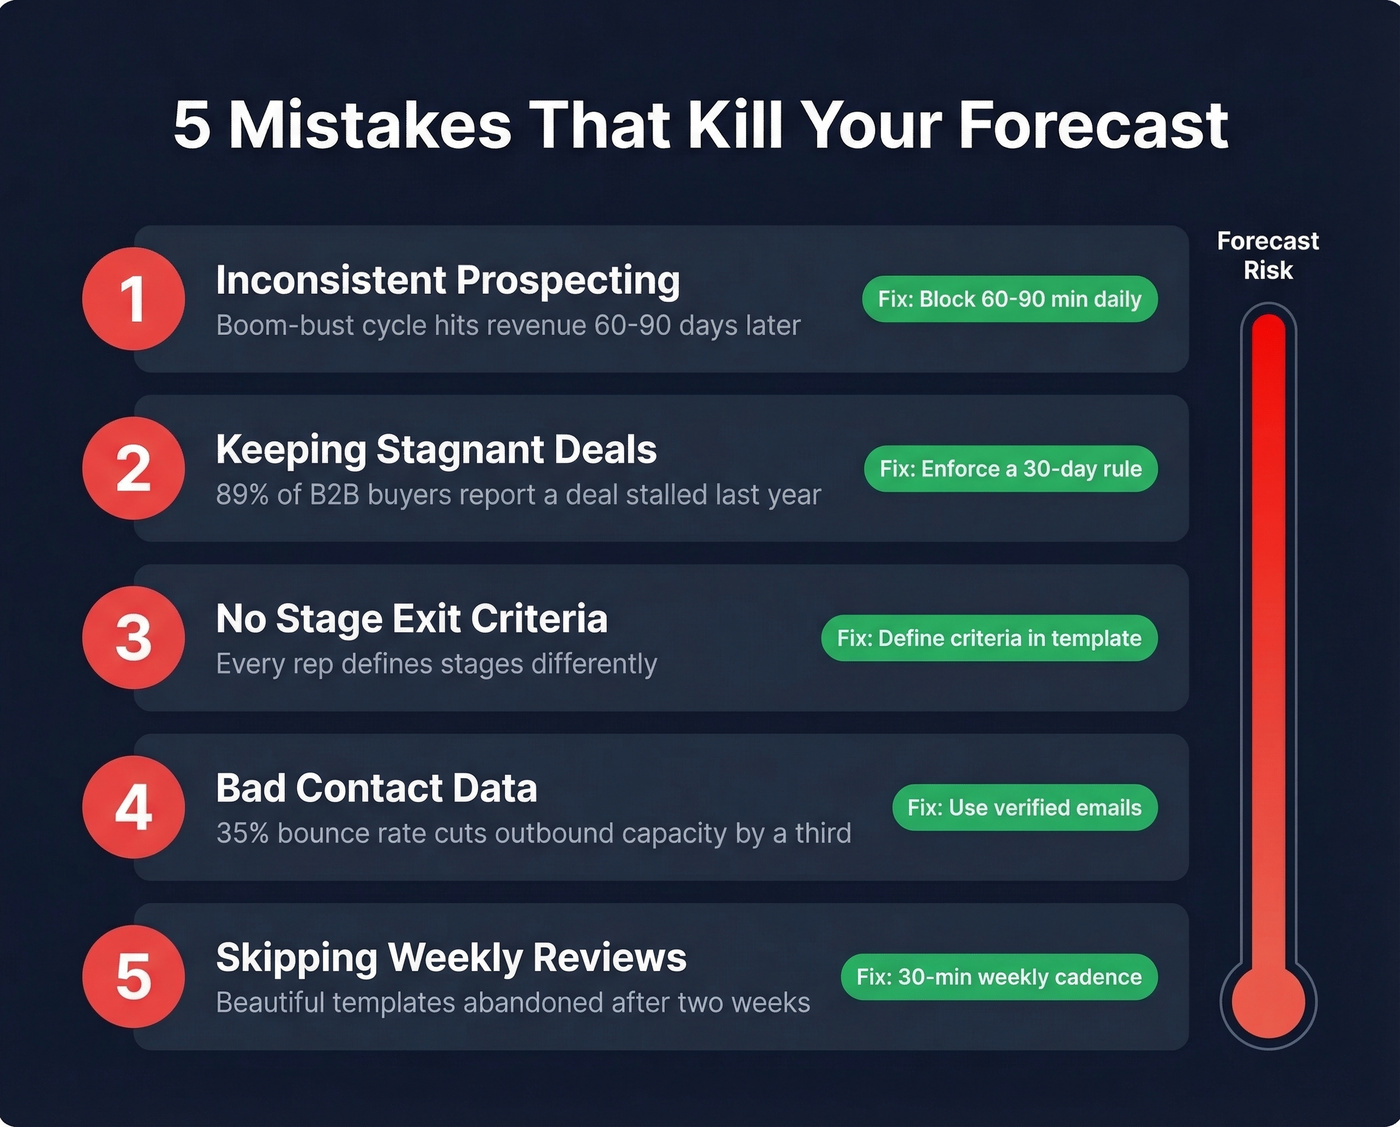
2. Keeping Stagnant Deals
That deal sitting at "Negotiation" for 47 days with no next step isn't a deal. It's a wish.
And it's not rare - 89% of B2B buyers report a purchase deal stalled in the past year. Stagnant opportunities distort your data and inflate your forecast. Enforce a 30-day rule: if a deal hasn't advanced and has no clear, dated next step, move it to "On Hold" or remove it.
Let's be honest: most teams would close more revenue by cutting their pipeline in half. A lean pipeline with 30 real deals beats a bloated one with 80 ghosts. The psychological weight of phantom pipeline actually slows reps down - they spend time "nurturing" dead deals instead of opening new ones.
3. No Stage Exit Criteria
Without explicit criteria for advancing deals, every rep defines stages differently. One rep's "Qualification" is another rep's "Proposal." This makes pipeline reporting meaningless and forecasting impossible. Define exit criteria once, put them in the template, and hold reps accountable during reviews.
4. Bad Contact Data Inflating Pipeline
If 35% of your emails bounce, your outbound capacity gets cut by a third or more. Every deal attached to a dead email or wrong phone number is phantom pipeline - it looks real in the spreadsheet but has zero chance of closing. Snyk's 50-person AE team saw bounce rates drop from 35-40% to under 5% after switching to verified data, driving a 180% increase in AE-sourced pipeline and 200+ new opportunities per month. (More on this: email bounce rate.)

5. Skipping Weekly Reviews
A pipeline you don't review is a pipeline you don't manage. In our experience, teams build beautiful templates, populate them diligently for two weeks, then never look at the data again. The template is infrastructure. The weekly review is the system.
How to Run a Weekly Pipeline Review
A pipeline review isn't a status update meeting. It's a 30-45 minute diagnostic session using four lenses.
Volume: Do you have enough deals? Count qualified opportunities by stage. Empty early stages mean trouble in 60 days.
Value: Is the total weighted pipeline sufficient? Multiply each deal's value by its stage probability and sum everything - that's your weighted pipeline number.
Coverage: Maintain 4-6x your quota in active pipeline. A quarterly target of $200K means you need $800K-$1.2M in qualified opportunities. Below 3x is danger territory.
Velocity: Are deals moving? Check average days-in-stage against your benchmarks. Deals stuck longer than your average cycle length are at risk.
For each deal reviewed, enforce one rule: the next step must be buyer-driven, specific, and dated. "Follow up next week" isn't a next step. "Send revised proposal addressing procurement's security questions by Thursday" is. If you need ready-to-use language, keep sales follow-up templates handy.
When to Ditch the Spreadsheet
Around 40% of salespeople still use spreadsheets to manage customer data. That's fine - until you hit these walls:
- Your sheet has 2,000+ rows and takes 10 seconds to load
- Three reps have three different versions of the file
- You're setting manual calendar reminders for follow-ups
- You need access controls and audit trails that Sheets can't provide
- Pulling a pipeline report takes 45 minutes of pivot table wrestling
Most teams hit these pain points around 6-10 reps or ~$1M in revenue. At that point, CRM adoption can increase sales by up to 29%. With Gartner projecting that 80% of B2B sales interactions will happen in digital channels by 2026, the complexity only grows from here.
Plenty of reps keep a personal spreadsheet alongside their company CRM. That's normal and often smart. The spreadsheet becomes your thinking tool; the CRM becomes the system of record. If you’re choosing a system, start with contact management software.
| Tool | Starting Price | Best For |
|---|---|---|
| Google Sheets | Free | Solo reps and teams under 5 |
| HubSpot Free CRM | Free | First CRM for growing teams |
| Pipedrive | ~$15-$30/mo/user | Visual pipeline management |
| Close CRM | ~$49-$149/mo/user | Inside sales and cold outreach |
| Monday.com | Starts at $39/month | Teams already using Monday for PM |
Sales Pipeline Template FAQ
What should a sales pipeline template include?
At minimum: deal name, stage, value, probability %, close date, owner, next step, and last activity date. These eight fields cover weighted forecasting, deal hygiene, and weekly reviews. Skip anything that doesn't directly inform a decision or action.
How many pipeline stages do I need?
Five to seven for most B2B teams. Fewer than five creates blind spots between qualification and close; more than seven kills rep adoption because updating stages becomes a chore.
What's a good pipeline coverage ratio?
Maintain 4-6x your quota in active, qualified opportunities. A $200K quarterly target means $800K-$1.2M in pipeline. Below 3x? You're one lost deal away from missing the number.
How do I keep contact data accurate in my pipeline?
Verify emails before importing contacts. Prospeo's 5-step verification catches invalid addresses, spam traps, and catch-all domains at 98% accuracy - the free tier covers 75 emails per month. Hunter and NeverBounce also offer verification, but lack the integrated mobile number database.
Can I use this as a business development pipeline template?
Yes. Add a "BDR Handoff" stage between Qualification and Initial Contact, then assign ownership to your business development reps. The same structure - stages, exit criteria, probability defaults - applies whether you're running a full-cycle or split-role sales motion.
Your pipeline velocity formula only works when the opportunities are real. Prospeo's 300M+ profiles with 30+ filters - including buyer intent and job changes - let you fill the prospecting stage with ICP-fit leads, not guesses.
Turn your empty template into a $2,500/day pipeline machine.