Sales Planning: The Practitioner's Guide for 2026
It's November. You're staring at a spreadsheet with 14 tabs, three of which reference circular formulas you didn't build. Finance wants the plan by Friday. Marketing's conversion assumptions don't match yours. RevOps just changed the definition of "Stage 3."
That's what sales planning actually looks like for most B2B teams. One practitioner on r/b2b_sales described it as "lots of tabs, conflicting formulas, missed dependencies, and way too much overtime." And here's the kicker: 94% of spreadsheets contain errors. Your plan is almost certainly built on at least one broken formula right now.
This guide won't fix your spreadsheet. It'll replace the need for one.
What You Need (Quick Version)
Your sales plan needs five things: revenue targets backed by funnel math, a capacity model that accounts for ramp and non-selling time, shared definitions across Sales/Marketing/Finance/RevOps, a 90-day review cadence, and clean prospect data. Skip the 40-page deck. A one-page plan with correct assumptions beats a beautiful document built on broken formulas every time.
What Is Sales Planning?
Sales planning translates revenue goals into operational reality - targets, territories, capacity, timelines, and metrics. It's the bridge between "we need $12M this year" and "here's exactly how many reps, deals, and pipeline dollars that requires, quarter by quarter."
The sales performance and planning software market hit $15B in 2025 and is projected to reach roughly $45B by 2033 at a 12% CAGR. Meanwhile, 57% of sales professionals say cycles are getting longer, and reps spend 60% of their time on non-selling tasks. The margin for error in your plan is shrinking while execution complexity grows.
A good sales plan doesn't just set targets. It creates the shared playbook that lets Sales, Marketing, Finance, and RevOps execute against the same assumptions - and adjust when those assumptions break.
Types of Sales Plans
Not every plan serves the same purpose:
| Plan Type | Scope | Cadence | Owner |
|---|---|---|---|
| Annual | Company-wide revenue | Yearly | CRO / VP Sales |
| Quarterly | Team-level targets | Every 90 days | Sales leadership |
| Territory | Geo/vertical/segment | Quarterly or annual | RevOps |
| Account | Named accounts | Ongoing | AEs / AMs |
| Capacity | Headcount + productivity | Quarterly | RevOps + Finance |
| Compensation | Quota + incentive design | Annual (adjust quarterly) | RevOps + Finance |
Here's the thing: stop planning for 12 months. Set annual direction - you need a north star. But the operational plan that drives daily execution should recalibrate every quarter. With 47% of companies citing market uncertainty as their top challenge, an annual plan that doesn't flex is fiction by March.
How to Build a Sales Plan
Set Revenue Targets With Funnel Math
Most sales plans start with a revenue number and stop there. "We need $4M in Q1." Great. But how many deals is that? How many opportunities? How many SQLs, MQLs, and raw leads? And how much traffic or outbound activity does that require?
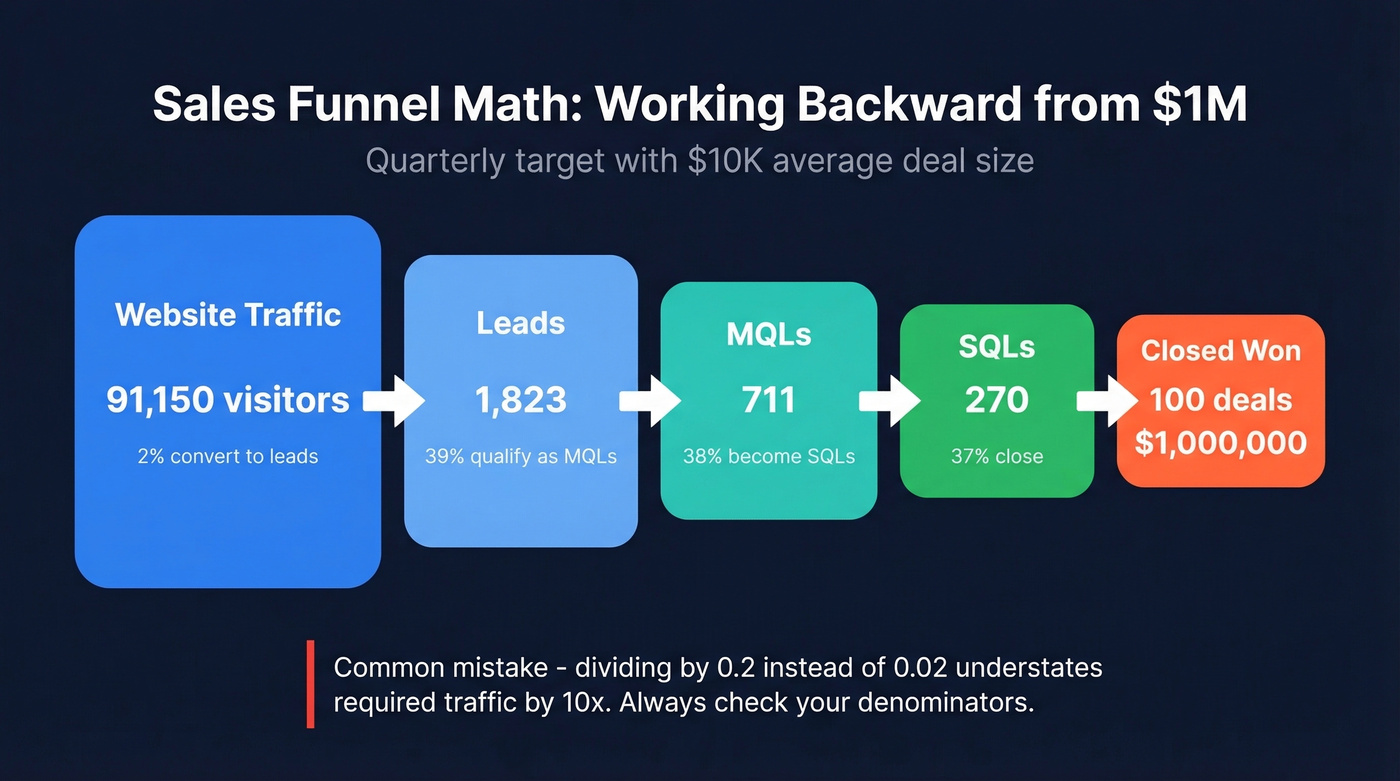
Let's work through it. Say your quarterly target is $1,000,000 in new revenue and your average deal size is $10,000. That's 100 closed deals.
Now work backward using First Page Sage's B2B SaaS benchmarks:
| Stage | Conversion Rate | Required Volume |
|---|---|---|
| Closed Won | - | 100 deals |
| SQL to Closed | 37% | 270 SQLs |
| MQL to SQL | 38% | 711 MQLs |
| Lead to MQL | 39% | 1,823 leads |
| Traffic to Lead | 2% | 91,150 visitors |
The math error nobody catches: One popular funnel walkthrough uses a 2% traffic-to-lead conversion but divides by 0.2 (20%) instead of 0.02 (2%), understating required traffic by 10x. Using the same inputs correctly - 6,666 leads divided by 0.02 = roughly 333,300 visitors. Always check the denominators.
These benchmarks are averages. Your actual conversion rates will vary by segment, channel, and deal size. The point is to force the conversation: when marketing says "we'll generate 500 MQLs" and sales says "we need 270 SQLs," you can immediately see whether the math works.
If you want a more structured way to define and measure each stage, use an AIDA Sales Funnel or a B2B Sales Funnel Template to standardize the handoffs.
One number worth anchoring on: deals closed within 50 days have a 47% win rate, but beyond 50 days that drops to 20%. Build your funnel math around the velocity your team actually achieves, not the velocity you wish for.
Build Your Capacity Model
You've got your deal targets. Now: do you have enough reps to close them?
A capacity model answers this by working from observed productivity, not wishful thinking:
| Input | Typical Range | Why It Matters |
|---|---|---|
| Ramped rep headcount | Current + planned hires | Only ramped reps carry full quota |
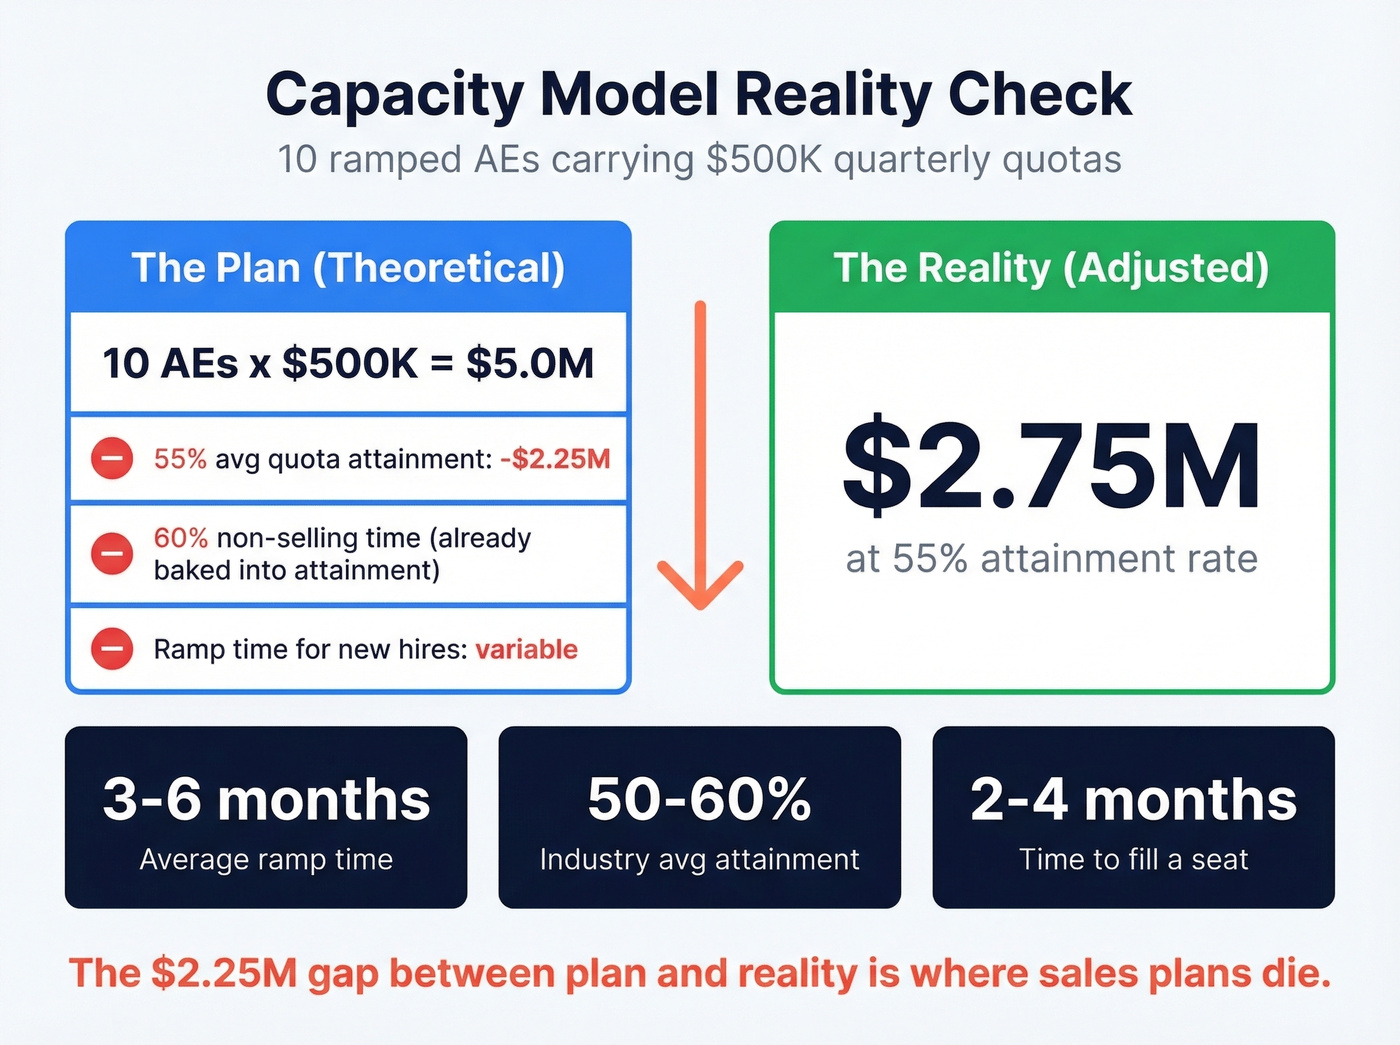
| Ramp time | 3-6 months | New hires produce roughly 25-50% during ramp |
| Quota attainment rate | About 50-60% industry average | Not every rep hits 100% |
| Non-selling time | 60% of rep time | Admin, CRM, meetings eat capacity |
| Hiring timeline buffer | 2-4 months to fill a seat | Req-to-start isn't instant |
We've seen teams build capacity models that assume 100% quota attainment and zero ramp time. That's not a plan - it's a prayer. If you have 10 ramped AEs carrying $500K quarterly quotas, your theoretical capacity is $5M. Apply a 55% attainment rate and you're looking at $2.75M. That gap is where plans die.
Build in the ramp. Build in the attrition. Build in the reality that your Q2 hire won't be fully productive until Q4.
Align Sales, Marketing, Finance, and RevOps
A practitioner on r/SaaS nailed this: planning isn't the hard part. Alignment is what "literally causes stress." The headline numbers get agreed on in a meeting. Then assumptions diverge silently. Sales staffs for aggressive growth. Marketing models off last year's conversion rates. Finance locks a budget that assumes flat headcount. Nobody catches the mismatch until Q2 pipeline reviews reveal a 30% gap.
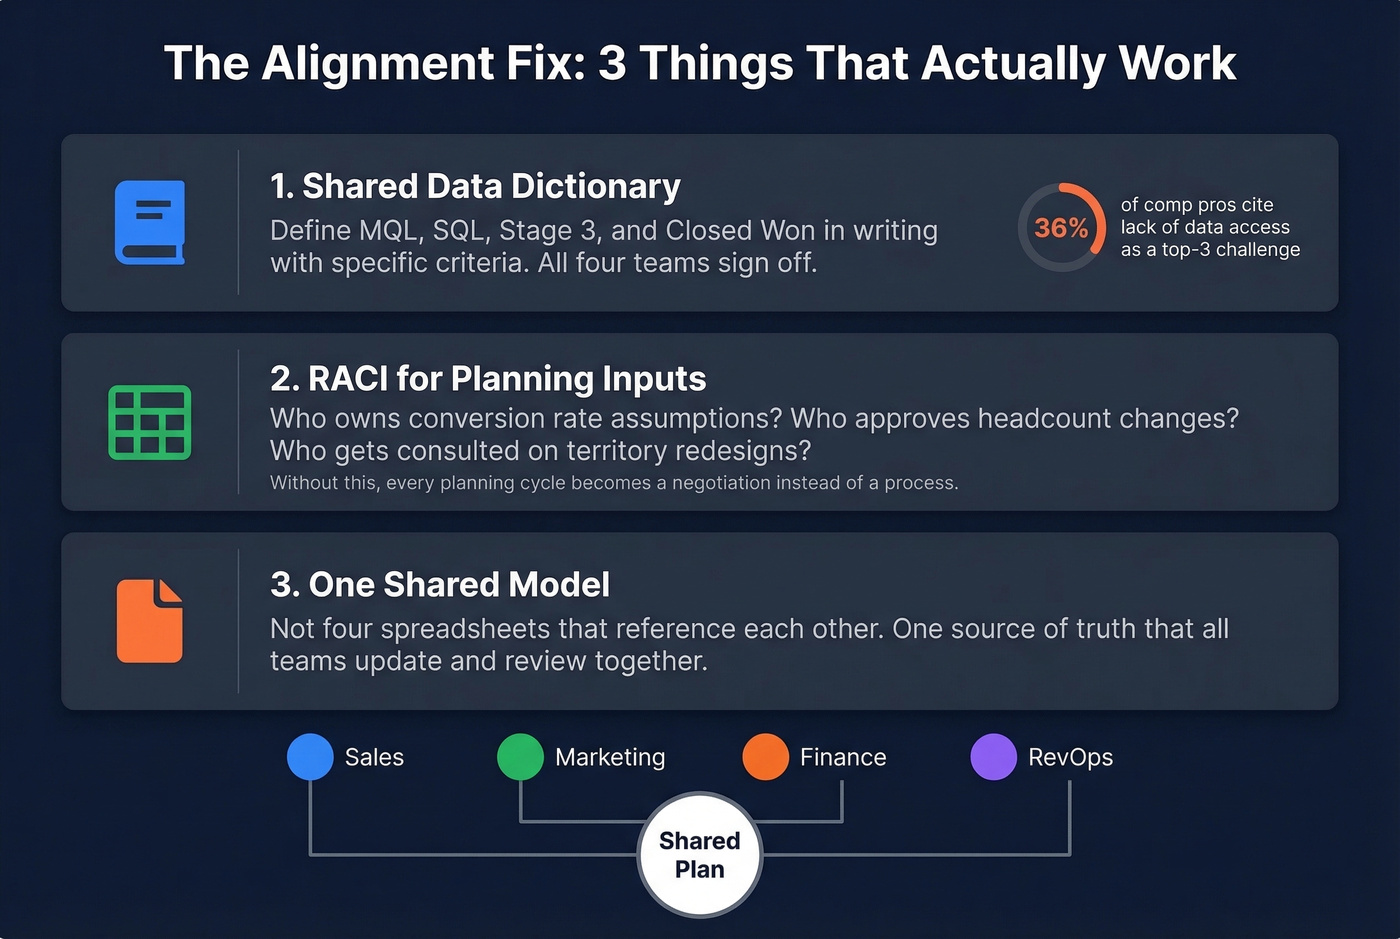
The fix isn't more meetings. It's three things:
A shared data dictionary. Define what "MQL," "SQL," "Stage 3," and "closed-won" mean - in writing, with criteria, agreed to by all four functions. When 36% of compensation professionals cite lack of data access as a top-3 challenge, the problem often isn't access. It's that everyone's looking at different definitions of the same metric. (If you're formalizing RevOps ownership, this is a core RevOps Manager responsibility.)
A RACI for planning inputs. Who's responsible for conversion rate assumptions? Who approves headcount changes? Who gets consulted on territory redesigns? Without this, every planning cycle becomes a negotiation instead of a process.
One shared model. Not four spreadsheets that reference each other. One source of truth that all teams update and review together.
Set Your Review Cadence
A plan that doesn't change is a plan that doesn't work.
- Annual: Set direction, strategic priorities, and north-star targets
- Quarterly: Recalibrate assumptions, adjust territories, update capacity
- Monthly: Review pipeline health, coverage ratios, conversion trends
- Weekly: Forecast calls, deal inspection, activity metrics
Your Q1 actuals should reshape your Q2 plan. Your monthly pipeline review should surface whether your funnel math assumptions are holding. If they aren't, adjust now - not in the next annual cycle. To make those reviews more actionable, track pipeline health alongside your sales operations metrics.
Your funnel math falls apart when 20% of emails bounce. Prospeo delivers 98% email accuracy with a 7-day refresh cycle, so the pipeline numbers in your sales plan actually hold up in execution.
Build your sales plan on data that doesn't break by Q2.
Sales Plan Template
You don't need a 40-page document. You need a modular plan that covers the right components and can be updated without rebuilding from scratch. Here's the outline, drawing from Xactly's 2026 template framework and Smartsheet's structural approach:
1. Executive summary - North-star revenue goals, business context, key assumptions. One page max.
2. ICP and target market - Segments by industry, company size, buying triggers. Prioritize by TAM and win rate. This drives territory design and quota allocation. (If you need a starting point, use an Ideal Customer Profile Template.)
3. GTM motion - Inbound/outbound/partner/PLG blend with expected conversion rates per channel.
4. Revenue goals and quota planning - Targets by segment, product line, and team. Include best-case, expected, and downside scenarios.
5. Territories and capacity - Territory design factors, role clarity, capacity model with ramp time and lead volume constraints.
6. Pipeline and forecasting methodology - Stage definitions, forecasting cadence, coverage ratio targets, inspection criteria. If you're tightening definitions, it helps to align on sales forecast vs sales goal and document the process in a sales process optimization playbook.
7. 12-month grid - Monthly targets by product line with previous year performance and current goals. This is your tracking layer.
8. Compensation alignment - How comp plans reinforce the behaviors your plan requires. Only 27% of organizations have fully automated end-to-end commissions, so document the manual exceptions too.
Copy this outline into a Google Doc, fill in your numbers, and you have a working plan. Smartsheet also offers free downloadable templates in Excel and Word if you want a pre-formatted starting point.
Why Sales Plans Fail
Plans don't fail because they're bad documents. They fail because of four specific breakdowns.
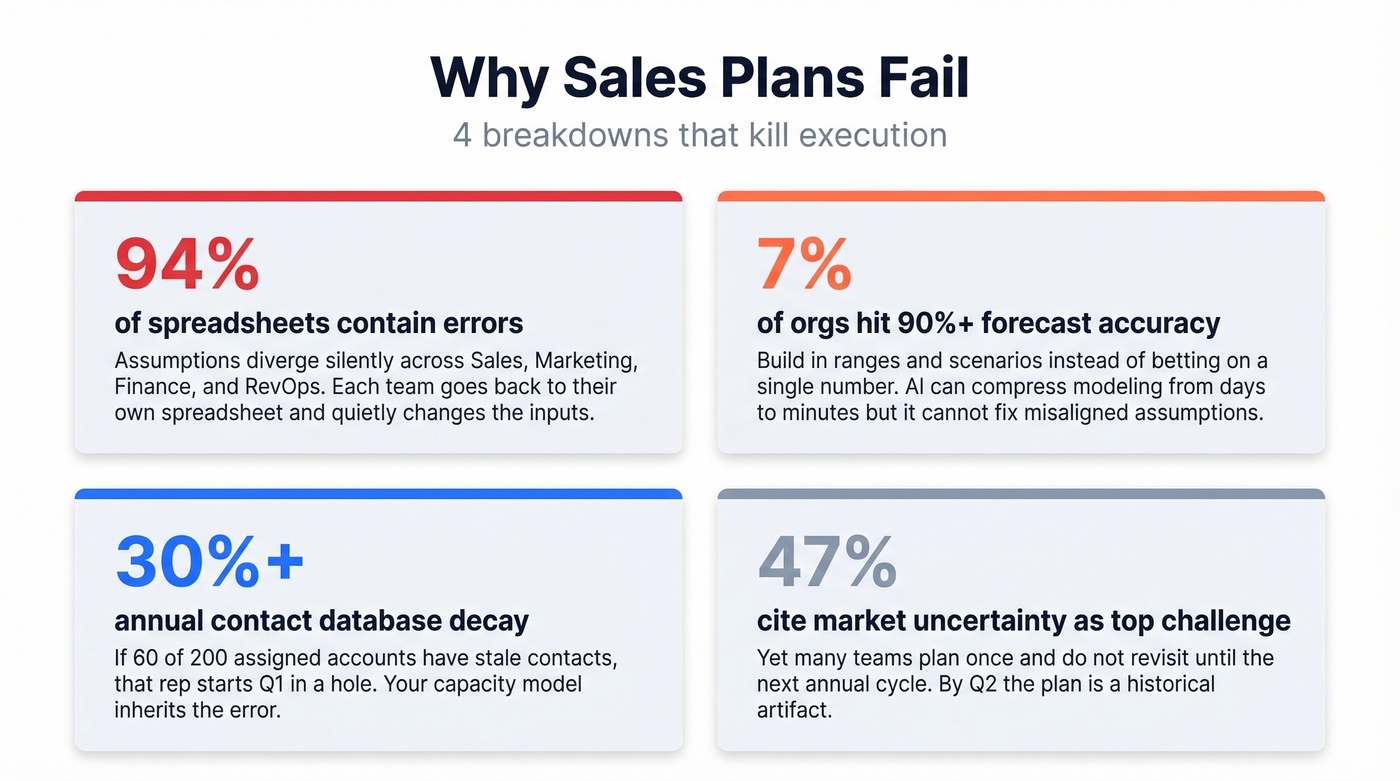
Assumptions diverge across teams. Sales staffs for 40% growth. Marketing models off 15% growth conversion rates. Finance locks a budget that assumes flat headcount. Nobody catches the mismatch until Q2 pipeline reviews reveal a 30% gap. We've watched this happen at three different companies in the past year alone, and the pattern is always the same: the numbers get agreed on in a room, then each team goes back to their own spreadsheet and quietly changes the inputs.
Forecast accuracy is worse than you think. Only 7% of sales organizations achieve 90%+ forecast accuracy. AI-powered tools can compress scenario modeling from days to minutes, but they can't fix misaligned assumptions between teams. Build in ranges and scenarios instead of betting on a single number. (If you're evaluating tooling, compare sales forecasting solutions against your actual planning requirements.)
Pipeline is built on stale data. Contact databases decay 30%+ annually. If your territory plan assigns 200 accounts to a rep and 60 of those contacts have gone stale, that rep is starting Q1 in a hole. This is where data quality stops being an abstract concern and becomes a planning problem - your capacity model, your coverage ratios, and your forecast all inherit the error.
No review cadence. 47% of companies cite market uncertainty as their top challenge, yet many plan once and don't revisit until the next annual cycle. By Q2, the plan is a historical artifact.
Data Quality as a Planning Input
Your Q1 forecast said $2.4M. You closed $1.7M. The pipeline was there on paper, but the inputs were wrong: contacts changed jobs, emails bounced, phone numbers went nowhere.
Here's the logic chain most teams miss: plan leads to targets, targets lead to pipeline, pipeline leads to outbound activity, outbound activity depends on contact data, and contact data depends on data quality. Every upstream planning decision - your capacity model, your territory assignments, your coverage ratios - ultimately depends on whether your reps can actually reach the people in their pipeline.
Look, if your average deal size exceeds $10K, bad contact data is a more expensive problem than bad planning software. A $50K+ planning platform with 30% email decay will underperform a spreadsheet plan backed by verified contacts every single time. Fix the data layer first. Tools like Prospeo, with its 98% email accuracy and 7-day refresh cycle, exist specifically to keep that foundation solid so your downstream numbers don't rot. If you're building the data layer, start with data enrichment services and a repeatable lead enrichment workflow.

Capacity models assume reps spend time selling, not chasing bad contact data. Prospeo gives your team 300M+ verified profiles with 30+ filters - intent, technographics, headcount growth - so reps connect with real buyers instead of dead ends.
Stop planning around non-selling time. Cut it instead.
How to Choose Planning Software
Before you spend $50K+ on a planning platform, run your demo through these ten questions - pulled from what practitioners on r/SalesOperations say breaks in real implementations:
- Can it handle overlapping territories from historical deals?
- What happens when ramp assumptions change mid-quarter?
- How does it manage undocumented comp exceptions?
- Can leadership run an urgent scenario request and get results by morning?
- Does it integrate with your CRM's actual data model, not a demo instance?
- How does it handle hiring delays when a req is approved but the seat stays unfilled for three months?
- Can you model multiple scenarios simultaneously - best, expected, and downside?
- What does the implementation timeline actually look like?
- How granular is the territory modeling across geo, vertical, and account density?
- What breaks when you change a quota mid-quarter?
Skip tools that can't answer questions 2, 6, and 10 clearly. Those are the scenarios that blow up real plans. If you're pressure-testing the inputs before buying anything, start by documenting your sales pipeline challenges and the exact metrics you need to fix.
| Tool | Typical Price Range | Best For |
|---|---|---|
| Anaplan | $50K-$150K+/yr | Enterprise, complex modeling |
| Xactly | $30K-$100K+/yr | Comp + territory + forecasting |
| Pigment | Mid five-figures/yr | Modern FP&A + sales planning |
| Salesforce Sales Planning | $25-$75/user/mo add-on | Salesforce-native shops |
| Cube | $1,250/mo | Mid-market FP&A |
| Workday Adaptive | $50K-$200K+/yr | Large enterprise, finance-led |
Key Benchmarks Reference
Bookmark these. They're the numbers you'll need when building or pressure-testing your plan.
B2B SaaS Funnel Conversion Benchmarks (via First Page Sage):
| Stage | Conversion Rate |
|---|---|
| Lead to MQL | 39% |
| MQL to SQL | 38% |
| SQL to Opportunity | 42% |
| SQL to Closed Won | 37% |
Operational Benchmarks:
| Metric | Benchmark |
|---|---|
| Cycles getting longer | 57% of reps say yes |
| Non-selling time | 60% of rep time |
| Win rate within 50 days | 47% |
| Win rate beyond 50 days | 20% |
| 1-2 quarter cycle length | 34% of sales teams |
| 90%+ forecast accuracy | Only 7% of orgs |
| Reps meeting quota | Roughly 50-60% |
FAQ
What's the difference between a sales plan and a sales strategy?
A strategy defines your market positioning, ICP, and competitive approach - the high-level decisions about where and how you'll compete. A sales plan operationalizes that strategy into targets, territories, capacity, timelines, and metrics. Strategy is the "what and why." The plan is the "how, when, and how many." You need both, but the plan is what your team executes against daily.
How often should you update your sales plan?
Set annual direction, recalibrate quarterly, review pipeline monthly, and run forecast calls weekly. The quarterly recalibration is the most critical - it's where you catch broken assumptions before they compound. In our experience, teams that review quarterly consistently outperform those that plan once and revisit annually.
What's a good pipeline coverage ratio?
Most B2B teams target 3x-4x pipeline coverage - three to four dollars in pipeline for every dollar of quota. Adjust higher if your win rates are below 25% or your average deal cycle exceeds 90 days. Coverage ratios below 2.5x are a red flag that your team will miss the quarter.
Can small teams plan without enterprise software?
Absolutely. A spreadsheet with correct assumptions beats a $100K platform with wrong ones. Start with funnel math, a capacity model, and a shared definitions doc. Layer in tools as complexity grows - typically when you hit 15+ reps or need multi-territory scenario modeling.
How does data quality affect sales planning?
If 30% of your contact database is stale, your territory assignments, capacity models, and pipeline forecasts are all built on bad inputs. Contact databases decay fast, and that decay doesn't just hurt outbound - it corrupts every number your plan depends on. Keeping your data current with regular verification and refresh cycles is the single cheapest way to improve forecast accuracy.