The Best Sales Reporting Software for 2026: 10 Tools That Actually Deliver
It's Monday morning. The VP of Sales pulls up the pipeline report, sees $2.4M in Stage 3, and tells the board they're on track. By Friday, $900K has gone dark - contacts bounced, champions changed jobs, two deals were duplicates. The report wasn't wrong. The data underneath it was.
Here's the uncomfortable number: 84% of sales reps missed quota last year, and average quota attainment sits at just 43%. The sales performance management market is projected to hit $6.58B by 2030, growing at a 17.43% CAGR - companies are throwing serious money at this problem. Whether they're spending it on the right sales reporting software is another question entirely.
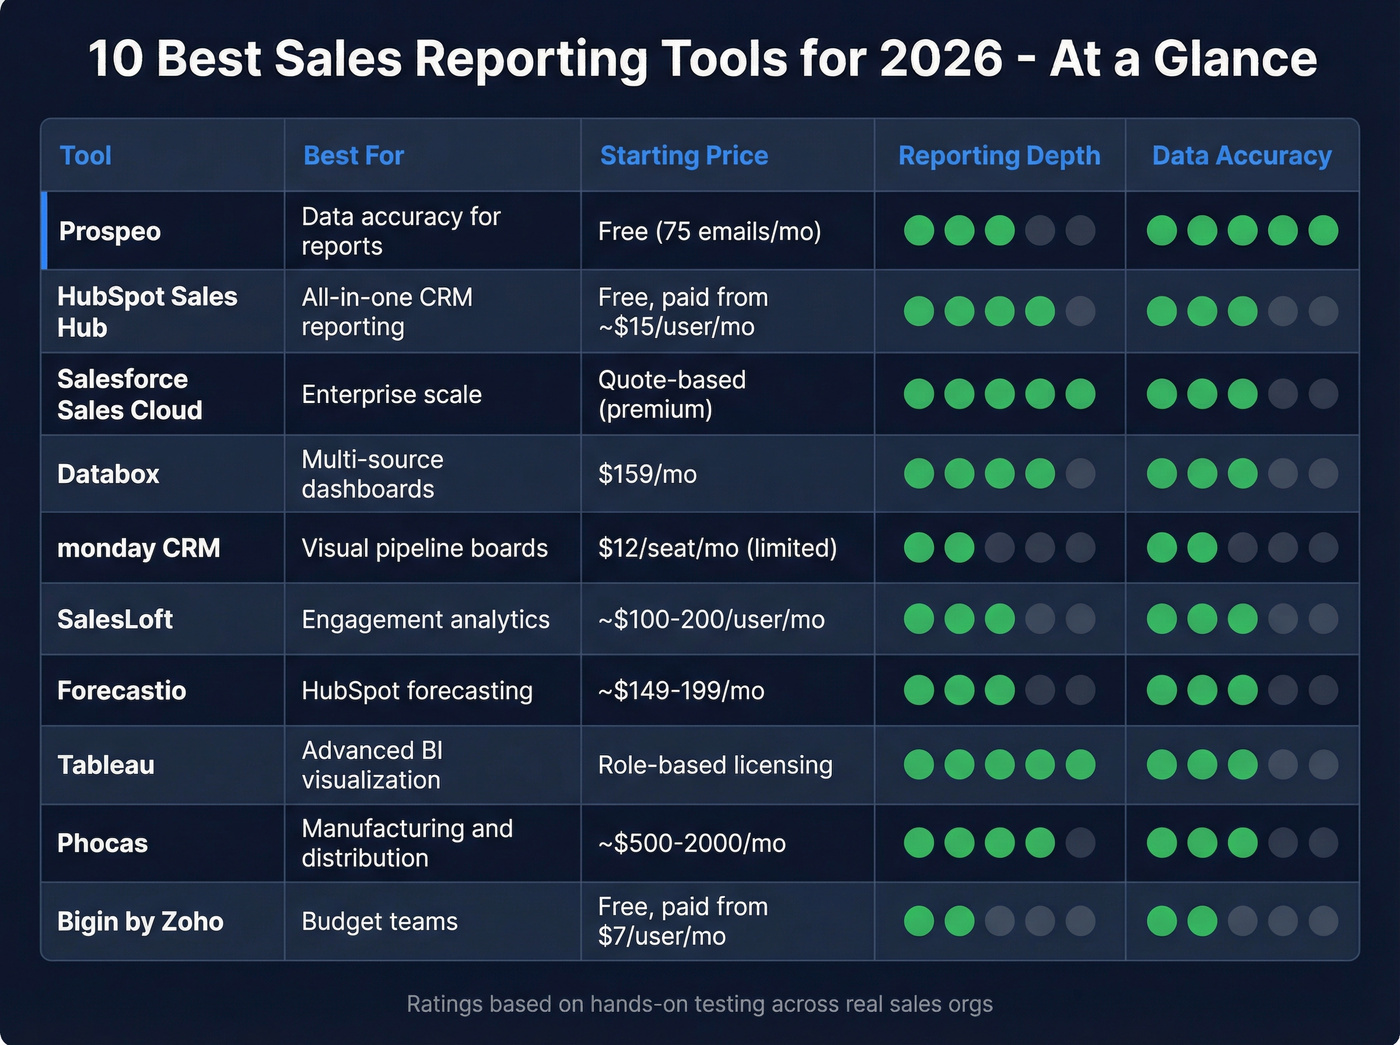
We've tested and tracked these 10 tools across real sales orgs. They're sorted by what matters most: data accuracy, reporting depth, and whether the price tag matches the value.
Our Picks (TL;DR)
| Pick | Best For | Starting Price | Key Differentiator |
|---|---|---|---|
| Prospeo | Clean data feeding reports | Free (75 emails/mo) | 98% email accuracy, 7-day refresh |
| HubSpot Sales Hub | All-in-one CRM reporting | Free tools; paid from ~$15/user/mo | Native dashboards scale with tier |
| Databox | Multi-source dashboards | $159/mo (annual) | Unlimited users, 100+ integrations |
Prospeo isn't a dashboard - it's the reason your dashboards tell the truth. HubSpot is the best starting point for teams that want reporting baked into their CRM without a six-month implementation. Databox is the play when you need to pull data from five or six different tools into one view.
What Sales Reports Should Track
Most teams track too many metrics or the wrong ones. The best reporting tools focus on a handful of KPIs that actually drive decisions.
The Core KPIs
Pipeline value by stage is the foundation. Layer on win rate - the cross-industry average is 21% - average deal size, and sales cycle length, which typically runs one to two full quarters for B2B. Quota attainment should be front and center on every monthly review, especially given that only 28% of sales professionals believe their teams will hit 100%.
If you're building a repeatable KPI set, it helps to map metrics to stages in your sales pipeline (not just your funnel).
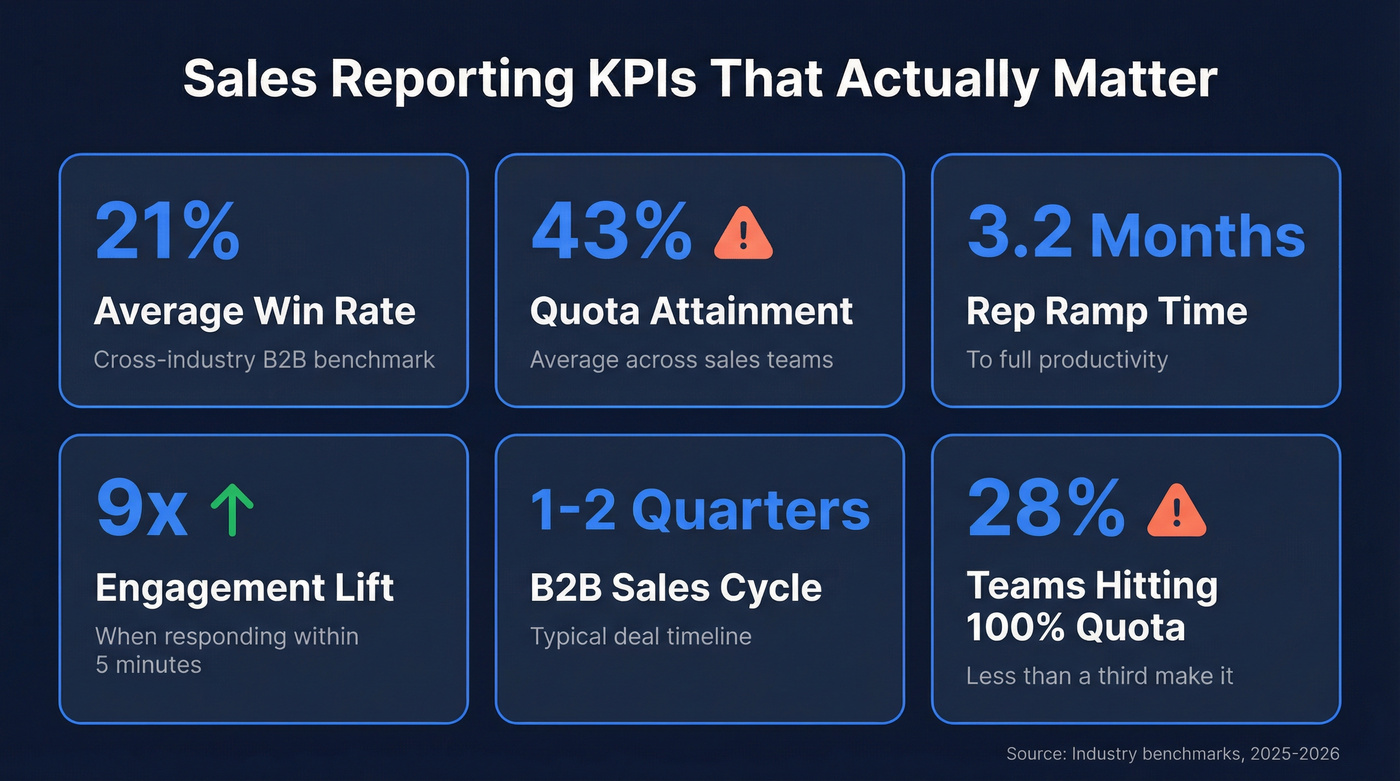
Rep ramp time matters more than most leaders realize. The average is 3.2 months for new salespeople to reach full productivity. If your reports don't track ramp separately, you're blending new-hire performance with tenured reps and getting a number that describes nobody.
Then there's lead response time - the most underreported metric in sales. Responding within five minutes increases engagement likelihood by 9x. More than 99% of companies don't hit that window.
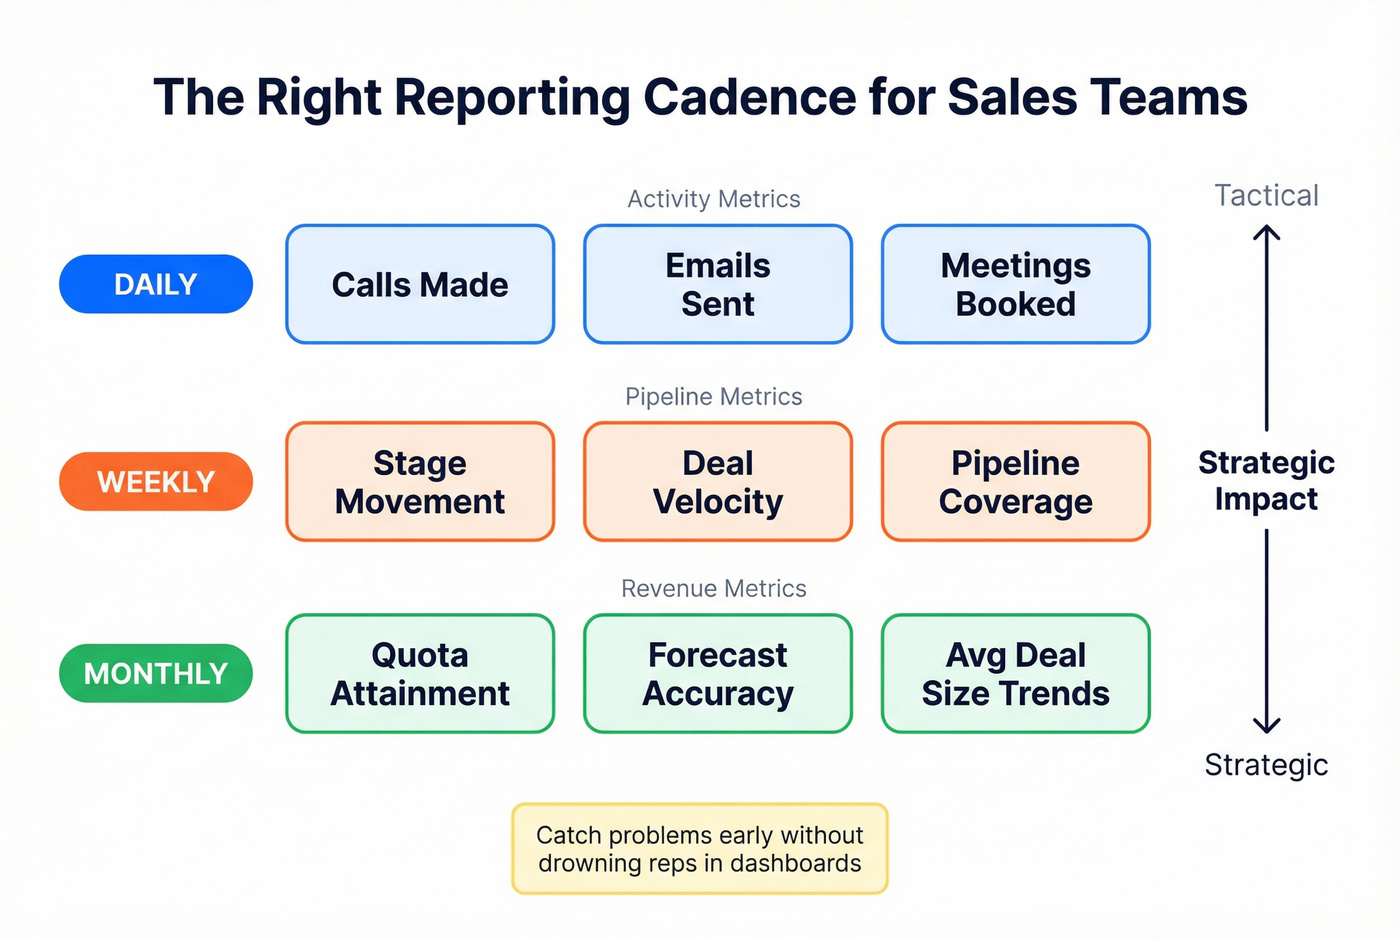
Reporting Cadence
Activity metrics - calls, emails sent, meetings booked - should be reviewed daily. Pipeline metrics like stage movement and deal velocity belong in the weekly review. Revenue metrics like quota attainment, forecast accuracy, and average deal size trends are monthly. This cadence catches problems early without drowning reps in dashboards they'll ignore.
If you want a tighter operating rhythm, borrow the structure from an Internal QBR and make reporting cadence non-negotiable.
Outbound-Specific KPIs
For outbound teams, standard CRM metrics aren't enough. Track dials per day, conversations per day, call disposition, and contact attempts per account. These are early pipeline health indicators that surface problems long before your next QBR.
If conversations per day are dropping but dials are steady, you've got a data quality problem - not a rep effort problem. Reliable reporting at this level requires clean, frequently refreshed contact information, which is where most stacks quietly fall apart.
If you're diagnosing why outbound is stalling, start with the usual sales pipeline challenges before you blame reps.
10 Best Sales Reporting Tools for 2026
1. Prospeo - Clean Data That Makes Reports Trustworthy
Use this if: Your CRM data is stale and every report you pull feels unreliable.
Prospeo's database covers 300M+ professional profiles with 98% email accuracy and a 7-day data refresh cycle, compared to the 6-week industry average. Native CRM enrichment for Salesforce and HubSpot keeps existing records current automatically, with 83% of leads returning contact data and 50+ data points per enrichment.
This is the same upstream fix you need for CRM hygiene and long-term reporting accuracy.
The results speak for themselves. Snyk's team of 50 AEs had 35-40% bounce rates before switching. After deploying Prospeo, bounces dropped below 5%, AE-sourced pipeline jumped 180%, and they now generate 200+ new opportunities per month. Intent data tracking across 15,000 topics via Bombora adds another layer - you're not just reporting on what happened, you're seeing which accounts are actively researching your category.
If bounce rates are part of your reporting problem, it’s worth understanding what a hard bounce actually signals (and how to prevent it).
Free tier includes 75 verified emails per month. Paid plans run ~$0.01 per email with no contracts.
2. HubSpot Sales Hub - All-in-One CRM Reporting
HubSpot is the default recommendation for a reason, but the reporting experience varies dramatically by tier.
What works: Free tools include basic dashboards and contact management - genuinely usable for small teams. Paid plans start around ~$15/user/month and scale up. The native integration ecosystem means less duct tape between your tools, and forecasting features expand on higher tiers.
If you're deciding between ecosystems, see the deeper breakdown in HubSpot vs Salesforce.
What doesn't: Custom reporting is gated to Professional and above. Costs climb fast once you add Marketing Hub, Service Hub, and Operations Hub on top.
Verdict: For teams of 5-50 reps who want reporting inside their CRM without managing a separate BI platform, HubSpot's higher tiers are usually where reporting becomes truly flexible. Budget for the tier you actually need, not the one on the landing page.
3. Salesforce Sales Cloud - Enterprise Reporting at Scale
Salesforce Sales Cloud pricing is quote-based, and most teams doing serious reporting end up on higher-tier editions that cost materially more than entry plans - especially once you factor in admin time, customization, and consulting.
The report builder is powerful but notoriously unintuitive. Einstein AI adds predictive forecasting and opportunity scoring, which genuinely helps large teams prioritize, but it takes months to train on your data before predictions become useful. Cross-object reporting and dashboard flexibility are unmatched at scale. There's also a 30-day free trial with no credit card required.
Here's the thing: Salesforce reporting is only as good as the data hygiene your team maintains. If reps aren't logging activities or updating stages, the most sophisticated dashboard in the world shows you garbage. For enterprise orgs with dedicated RevOps, it's still the standard. For everyone else, the total cost of ownership makes HubSpot or a lighter stack more practical.
If forecasting is the main pain point, start by measuring deal forecast accuracy before you buy more tooling.
4. Databox - Multi-Source Dashboards
Databox solves a specific problem well: pulling metrics from your CRM, marketing automation, ad platforms, and spreadsheets into one unified view. Unlimited users on every plan is a genuine differentiator when per-seat tools are bleeding your budget.
The Professional plan at $159/month includes 3 data sources - enough for a CRM, marketing tool, and one more. Additional sources cost $5.60/month each on annual plans, which adds up fast if you're connecting 10+ tools. Growth jumps to $399/month, Premium to $799/month.
Real users aren't shy about the limitations. "Very expensive for what you get... hard to customize" is a recurring Trustpilot theme, and G2 reviewers flag recurring issues with templates breaking and metrics stopping. Capterra reviewers note that "just about every basic feature, integration, or branding will cost you additional money."
Verdict: Excellent for 3-5 data sources in one view. Once you're connecting 8+ sources, the costs rival enterprise tools. Do the math on your specific stack before committing.
5. monday CRM - Visual Pipeline Boards
Use this if: You want a highly visual, drag-and-drop pipeline view and your team thinks in boards rather than tables.
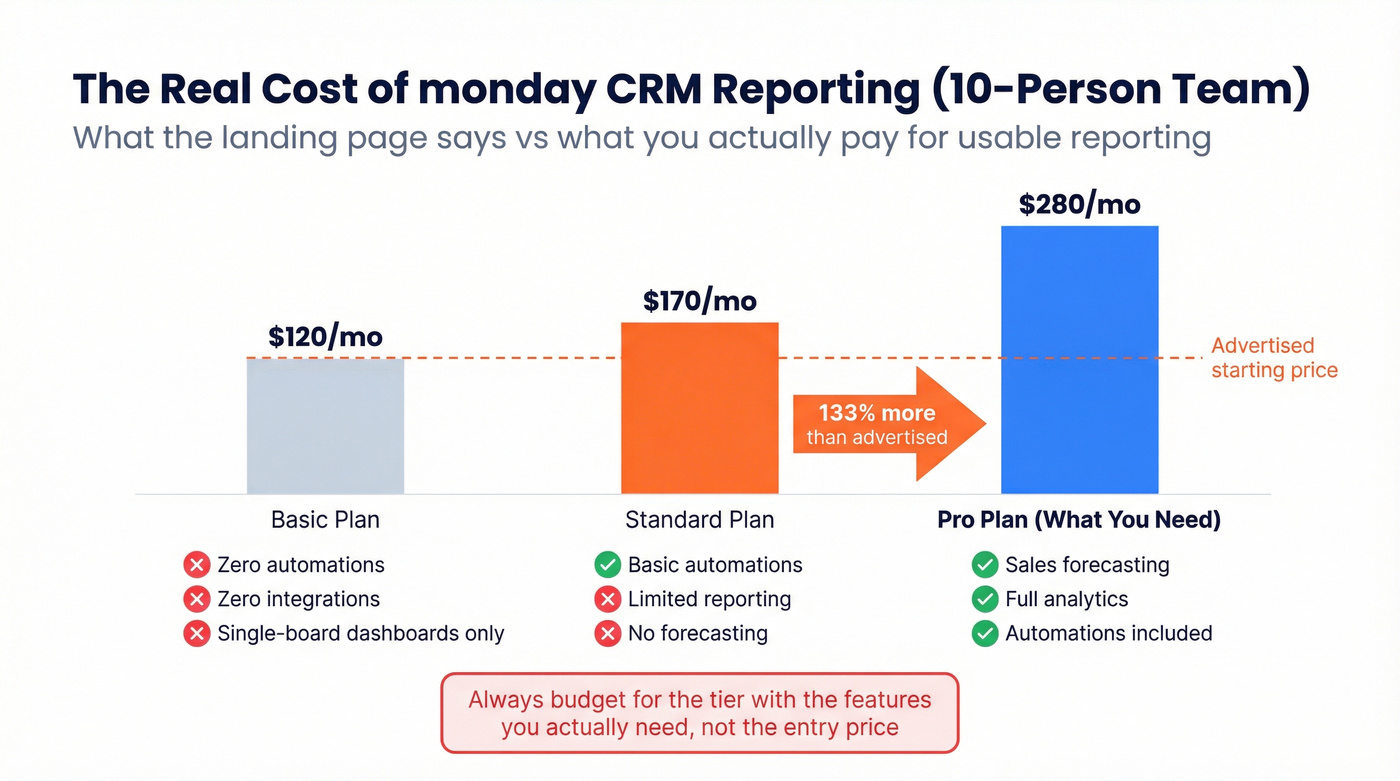
Skip this if: You need actual reporting on a budget. The Basic plan at $12/seat/month (minimum 3 seats) includes zero automations, zero integrations, and dashboards limited to a single board. Sales forecasting and analytics don't unlock until the Pro tier at $28/seat/month. That's a 133% price jump from the advertised starting price to get the features most teams actually need. For a 10-person team, you're looking at $280/month minimum for usable reporting - not the $120/month the landing page implies.
6. SalesLoft - Engagement Analytics
Salesloft doesn't publish pricing. Expect ~$100-$200/user/month depending on your contract, with two packages: Advanced and Premier. Forecasting is only available in Premier, so make sure you're quoted on the right tier.
The engagement analytics are genuinely strong - email open rates, call outcomes, cadence performance, and rep activity tracking are all native. But the dialer isn't included by default. It's an add-on, with LocalDial numbers running $1/number/month.
For teams already running Salesloft for sequences, the reporting is a natural extension. As a standalone reporting platform, the price-to-value ratio doesn't compete with HubSpot or Databox. Salesloft is leaning hard into AI agents for 2026, which could change the calculus - but today, you're paying a premium for engagement-layer analytics.
If you're standardizing outreach activity reporting, align it to a documented sales cadence example so reps don’t game the numbers.
7. Forecastio - Forecasting for HubSpot Teams
Forecastio is a sleeper pick for HubSpot shops that want forecasting without paying for top-tier CRM bundles. Pricing starts around $149-$199/month depending on seats and billing cycle.
Implementation takes about 2 minutes if you're already on HubSpot. Pipeline stage probabilities are calculated automatically, with what-if scenario modeling built in. The Capterra rating is a perfect 5.0, though it's based on just 2 reviews - take that with a grain of salt. Reviewers have flagged that you can't save forecast history yet, and the team says it's coming. Only works with HubSpot, so Salesforce teams are out of luck. A young product, but a sharp one.
8. Tableau - Advanced BI Visualization
Tableau isn't sales reporting software in the traditional sense - it's a BI platform that happens to be very good at visualizing sales data. It uses role-based per-user licensing with Creator, Explorer, and Viewer tiers. You'll need at least one Creator seat to build dashboards; everyone else can view them on cheaper seats.
The AI/ML capabilities are impressive for teams with a data analyst who can build custom visualizations. Tableau integrates natively with Salesforce CRM, making it a natural BI layer for Salesforce shops that've outgrown native reports. For teams without a dedicated analyst, it's overkill.
9. Phocas - Manufacturing and Distribution
Phocas serves 45,000+ daily users, almost exclusively in manufacturing, distribution, and retail. Its Sales Insights module uses RFM segmentation to categorize customers from "champions" to "at-risk," with documented results of up to 20% cost-to-serve reduction and up to 15% revenue lift per rep. Pricing is available upon request - expect roughly $500-$2,000/month depending on deployment size.
If you're in those verticals, it's worth a demo. Everyone else can skip it.
10. Bigin by Zoho CRM - Best Budget Option
Bigin starts with a free plan and paid tiers from just $7/user/month on annual billing. It's a lightweight CRM with basic pipeline reporting - perfect for teams under 10 reps who don't need enterprise features. A 15-day free trial lets you test before committing. Don't expect advanced analytics, but for the price, nothing else comes close.
Snyk's 50 AEs saw bounce rates drop from 35-40% to under 5% after switching to Prospeo. AE-sourced pipeline jumped 180%. Your sales reports can't fix stale data - but 300M+ profiles refreshed every 7 days can.
Stop reporting on ghost pipeline. Start with data you can trust.
Pricing Comparison
Watch the feature-gating column. The advertised price and the price for usable reporting are often very different numbers.
| Tool | Starting Price | Model | Free Tier? | Gating Warning |
|---|---|---|---|---|
| Prospeo | Free (75 emails/mo) | Credit-based | Yes | None |
| HubSpot Sales Hub | Free; paid from ~$15/user/mo | Per-seat, tiered | Yes | Custom reports: Pro+ |
| Salesforce | Quote-based | Per-seat, tiered | No | Higher tiers for advanced reporting |
| Databox | $159/mo (annual) | Per-source | 14-day trial | $5.60/extra source |
| monday CRM | $12/seat/mo (3 min) | Per-seat, tiered | No | Analytics: $28/seat |
| Salesloft | ~$100-200/user/mo | Quote-based | No | Forecasting: Premier only |
| Forecastio | ~$149-199/mo | Flat rate | No | HubSpot only |
| Tableau | Role-based per-user | Per-seat, role-based | No | Creator seat needed to build |
| Phocas | ~$500-2,000/mo | Quote-based | No | Vertical-specific |
| Bigin by Zoho | $7/user/mo (annual) | Per-seat | Yes (free plan) | Basic reporting only |
SaaS pricing keeps climbing, and these tools are no exception. The sticker price rarely tells the full story - monday CRM's $12/seat headline becomes $28/seat the moment you need forecasting, and Databox's $159/month becomes $300+ once you connect your full stack.
If you’re trying to keep spend sane, it helps to benchmark against the real cost of sales tech stack by team size.
How to Choose the Right Tool
Most teams need a stack of 2-3 tools, not one magic platform. Before picking, understand the four categories:
CRM-native reporting covers HubSpot, Salesforce, monday, and Bigin. Your CRM already has built-in dashboards - the question is whether they're deep enough. Dashboard aggregators like Databox pull metrics from multiple sources into one view. Standalone BI tools like Tableau and Phocas handle heavy-duty visualization for teams with dedicated analysts or vertical-specific needs. Forecasting and engagement tools like Forecastio and Salesloft specialize in pipeline prediction and activity analytics.
Let's break down the decision:
Start with your CRM. For teams under 20 reps with straightforward pipelines, CRM-native reporting usually covers 80% of what you need.
Add a dashboard aggregator when you're pulling from multiple sources. If your data lives in five different tools and leadership wants one view, that's where Databox earns its keep.
Layer in specialized tools for specific needs. Forecastio for HubSpot forecasting. Salesloft for engagement analytics. Tableau for advanced BI. Phocas if you're in manufacturing or distribution.
Our hot take: if your average deal size is under $15k, you probably don't need Salesforce-level reporting. A practical stack for a team on a ~$500/month budget - Prospeo for data accuracy and CRM enrichment, a lightweight CRM tier for pipeline management, and Databox Professional for multi-source dashboards - can come in under $400/month total and cover the full reporting workflow from clean data to executive dashboards.
One trend worth watching: AI agents are reshaping this category fast. Salesforce is pushing them heavily, and Salesloft is building them into its workflow. If you're evaluating sales reporting software today, ask every vendor what their AI roadmap looks like. The tools that automate insight generation - not just display data - will pull ahead within the next 12 months.
If you want to go deeper on this shift, map your stack against AI sales analytics use cases (not vendor demos).
The Data Quality Problem Nobody Talks About
A recurring theme on r/sales and in sales ops communities: teams spend more time building reports than acting on them. And when they do act, the data underneath is stale.
We've seen this play out dozens of times. An SDR books 40 meetings in a quarter. Twelve convert to opportunities. The report says 30% conversion - not bad. But half those meetings were booked with the wrong persona because the contact data in the CRM was outdated. The VP of Engineering left six months ago. The "Head of Marketing" is now at a different company. The report showed activity. It didn't show that the activity was pointed at ghosts.
No dashboard tool solves this upstream problem. Your win rate metric is meaningless if 20% of your pipeline was built on contacts who've changed roles. Snyk's team discovered this firsthand - bounces dropped from 35-40% to under 5% once they fixed the data layer, and suddenly their pipeline reports started telling the truth.
If you want the benchmarks and fixes behind this, start with B2B contact data decay and work backward into your reporting stack.
The sexiest dashboard in the world is worthless if the data feeding it is six weeks old. Fix the input first. The reports will follow.
If conversations per day are dropping but dials are steady, your reporting software isn't the problem - your contact data is. Prospeo enriches CRM records with 50+ data points at 83% match rate, so every metric in your dashboard reflects reality.
Clean data in, accurate reports out. It starts at $0.01 per email.
FAQ
What's the difference between CRM reporting and standalone sales reporting software?
CRM reporting uses data already inside your CRM - deals, stages, activities, rep logs. Standalone tools pull from multiple sources like CRM, email, calls, and marketing platforms into unified dashboards. Most teams outgrow CRM-native reports within a year as they add tools to their stack and need a consolidated view.
What's the best free option?
HubSpot's free CRM includes basic dashboards, and Bigin by Zoho starts at $7/user/month with a free plan available. For data quality - the layer that makes reports trustworthy - Prospeo offers 75 free verified emails per month with 98% accuracy, enough to audit whether your CRM data is even worth reporting on.
How often should I review sales reports?
Activity metrics like calls, emails, and meetings booked should be reviewed daily. Pipeline metrics including stage movement, deal velocity, and coverage ratios belong in the weekly review. Revenue metrics - quota attainment, forecast accuracy, average deal size - are monthly. This cadence catches problems early without drowning reps in dashboards they'll ignore by week two.
What reporting features matter most?
At minimum, look for customizable dashboards, real-time pipeline views, and the ability to segment by rep, team, or territory. Forecasting accuracy, drill-down capability, and multi-source data integration separate good tools from great ones. If you can't filter and slice data by the dimensions that matter to your business, you'll outgrow the tool within a quarter.
Why do my sales reports feel inaccurate?
Usually because the CRM data feeding them is stale. If contacts have outdated job titles, bounced emails, or wrong company associations, every report built on that data is fiction. Fix the input first - tools with weekly data refresh cycles prevent the drift that makes Monday's pipeline report unrecognizable by Friday.