Sales ROI Calculator: How to Calculate Without Lying to Your CFO
Budget season. Finance wants the ROI on your 30-person sales team, and the only number you've got is a revenue figure that ignores ramp costs, tool overlap, and the fact that 84% of your reps missed quota. You need a sales ROI calculator - and all you find are retirement planning tools and vendor demos designed to make their platform look like a money printer.
Here's what actually works: a formula grounded in gross margin, a complete cost taxonomy, and benchmarks that reflect reality rather than wishful thinking.
What You Need (Quick Version)
The formula: ROI = (Gross Margin from Sales-Attributed Revenue - Total Sales Costs) / Total Sales Costs x 100
The three biggest mistakes:
- Using top-line revenue instead of gross margin makes ROI look dramatically better than the business reality
- Ignoring ramp time (3.2 months average) and turnover creates a phantom workforce
- Tool overlap waste - 73% of teams waste $2,340/rep/year on redundant software
Bookmark the complete cost taxonomy and the spreadsheet framework below.
The Sales ROI Formula Explained
The basic formula is simple:
ROI = (Gain - Cost) / Cost x 100
The problem is what people put into "Gain." Most teams plug in top-line revenue. That's wrong. Your sales team didn't generate revenue - they generated gross margin. The difference between a $10M revenue line at 70% margin and one at 30% margin is enormous, but the lazy version treats them identically.
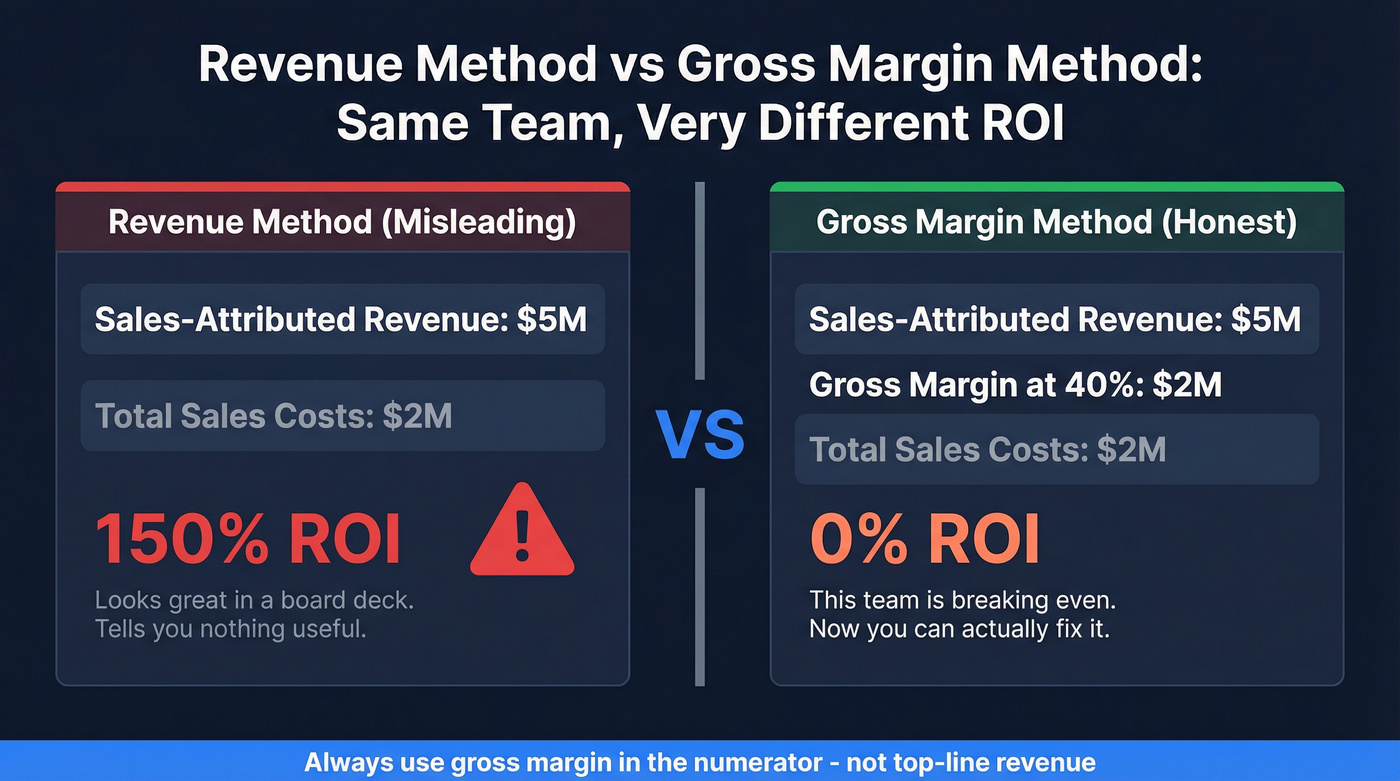
Same team, same costs, two very different stories:
| Metric | Revenue Method | Gross Margin Method |
|---|---|---|
| Sales-attributed revenue | $5M | $5M |
| Gross margin (40%) | - | $2M |
| Total sales costs | $2M | $2M |
| Calculated ROI | 150% | 0% |
That 150% ROI looks great in a board deck. It's also misleading. The gross margin method tells the truth: this team is breaking even. Many vendor calculators lean on revenue-based math because it makes the output look like a guaranteed win. Don't fall for it.
For teams with sales cycles longer than a quarter, discount future cash flows to net present value. A deal closing in 14 months isn't worth the same as one closing in 30 days.
Complete Sales Cost Taxonomy
Most ROI calculations fail in the denominator. Teams include base salary and maybe commissions, then call it done.
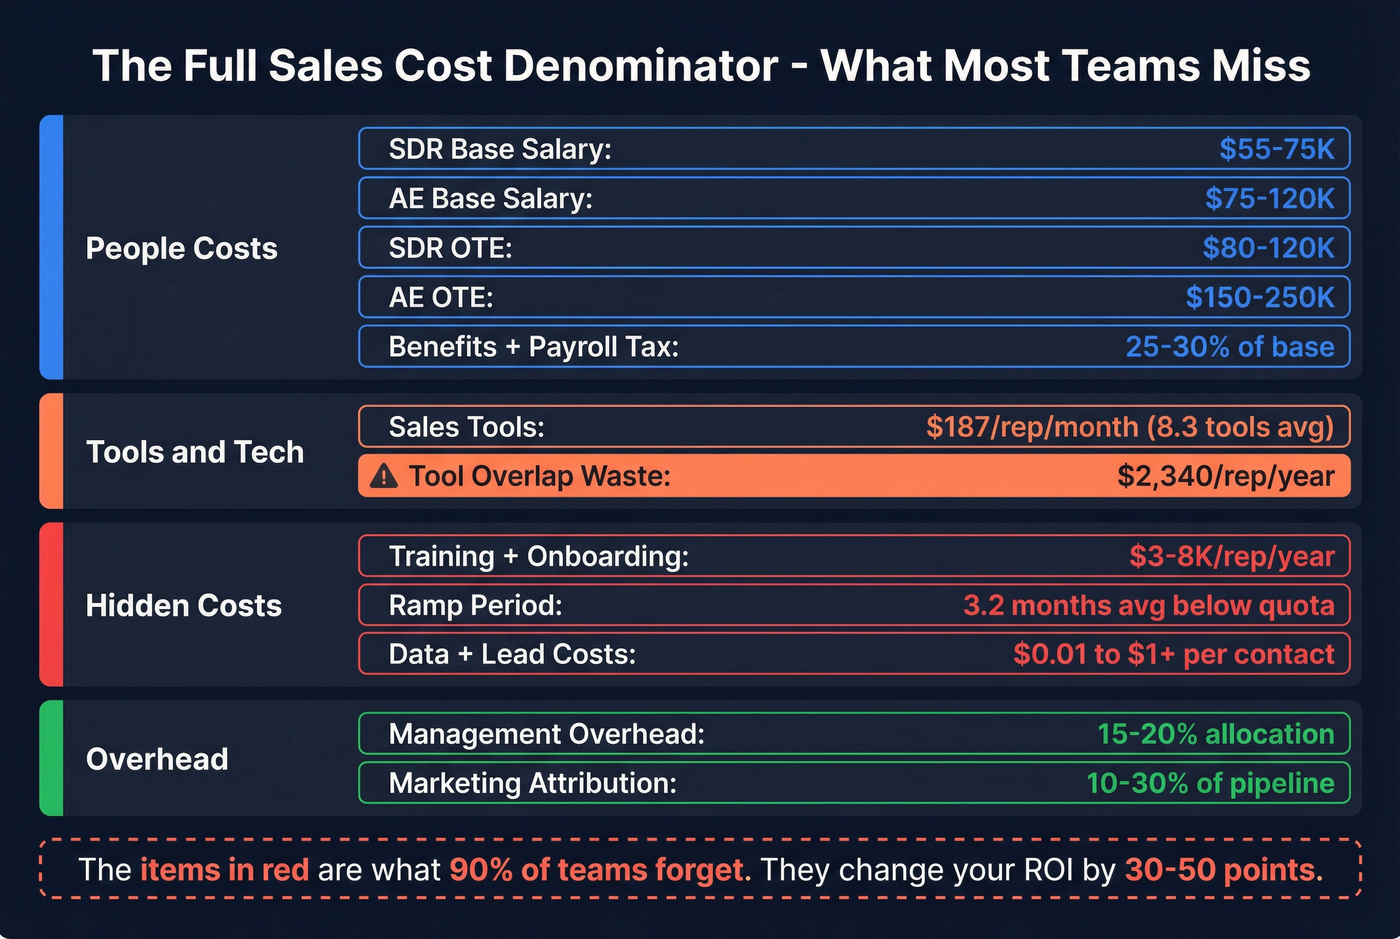
| Line Item | Typical Range | Notes |
|---|---|---|
| SDR base salary | $55-75K | Varies by market |
| AE base salary | $75-120K | Mid-market range |
| Variable comp (SDR OTE) | $80-120K total | 50/50 or 60/40 split |
| Variable comp (AE OTE) | $150-250K total | Includes accelerators |
| Benefits + payroll tax | ~25-30% of base | Health, 401k, FICA |
| Sales tools | $187/rep/month | 8.3 tools avg |
| Training + onboarding | $3-8K/rep/year | Ramp programs, sales coaching, coaching |
| Management overhead | 15-20% allocation | Frontline managers |
| Marketing attribution | 10-30% of pipeline | Agree with CMO pre-budget |
| Ramp-period cost | 3.2 months avg | Rep producing below quota |
| Data + lead costs | $0.01-1+/contact | Verified email providers vs. enterprise platforms |
That last row matters more than most teams realize. The gap between $0.01 and $1+ per contact compounds fast at outbound scale - a 50-rep team running 500 contacts/rep/month is looking at the difference between $3,000/year and $300,000/year for the same data.
Add every line item. If it touches the sales function, it belongs in the denominator. Leaving things out doesn't make your ROI higher. It makes your model wrong.
Worked Examples by Stage
Startup: 3 reps, $500K revenue
Total cost: ~$350K (compensation, benefits, tools, and overhead combined). Gross margin at 65%: $325K. ROI = ($325K - $350K) / $350K x 100 = -7%. Not a crisis - it's a team still ramping. But the revenue method would've shown 43% ROI and masked the reality entirely.
Mid-market: 30 reps, $8M revenue
This is where hidden costs bite. Thirty reps at $187/mo in tools is $67,320/year. But with 73% of teams reporting overlap waste at $2,340/rep/year, that's another $70,200/year burned on redundant software nobody audited.
Add ramp costs for the 7-8 reps you replace this year (a common planning assumption is ~25% annual turnover), and your denominator climbs fast before you've even argued about comp plans. At 50% gross margin, your $8M in revenue is $4M in margin. If your fully loaded sales costs are ~$3.5M, ROI is ~14% - a very different story than a revenue-based model would tell.
Enterprise: 200 reps, $80M revenue
At this scale, small improvements create massive returns. If 84% of reps miss quota, moving that number even a few points creates meaningful incremental margin - but you'll only see it if your model captures the real baseline. The enterprise trap is assuming your model is sophisticated because it's big. We've seen 200-rep models that still miss ramp costs.
That $300K vs $3K data cost gap in your denominator? It's real. Prospeo delivers verified emails at $0.01 each with 98% accuracy - 90% cheaper than enterprise platforms. A 50-rep team saves $297K/year on the same contact volume, directly improving your sales ROI.
Fix the denominator before you present to your CFO.
What's a Good Sales ROI?
Forecastio's calculator puts 100%+ as "efficient." Outreach pegs a healthy range at 3:1 to 5:1 return per dollar invested in a salesperson. These numbers are meaningless without defining the denominator.
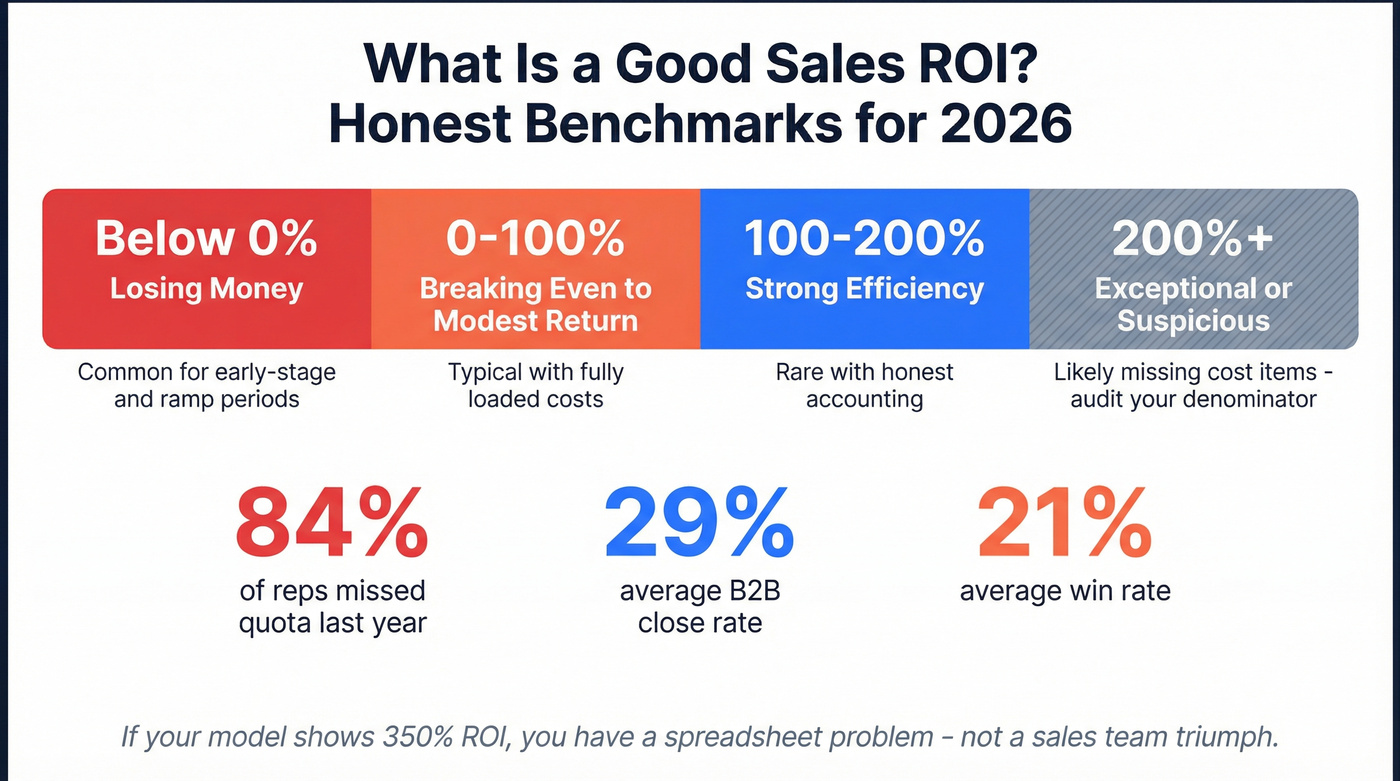
| ROI Range | What It Means | Reality Check |
|---|---|---|
| < 0% | Losing money | Common for early-stage/ramp |
| 0-100% | Breaking even to modest return | Typical with fully loaded costs |
| 100-200% | Strong efficiency | Rare with honest accounting |
| 200%+ | Exceptional | Likely missing cost items |
Here's the thing: when 84% of reps miss quota, the average B2B close rate sits around 29%, and win rates hover around 21%, a 200% ROI with honest inputs is genuinely impressive. If your model shows 350%, you've got a spreadsheet problem, not a sales team triumph.
Let's be honest - most teams calculating 200%+ ROI aren't running elite sales orgs. They're running incomplete spreadsheets. We've built this model for dozens of teams, and the tool overlap and ramp cost lines surprise people every single time. A realistic 80-120% ROI with honest accounting beats a fantasy 300% that falls apart under CFO scrutiny.
5 Mistakes That Wreck Your Numbers
1. Revenue instead of gross margin
Plugging revenue into the numerator inflates everything. A SaaS company at 80% gross margin gets away with less distortion. A services firm at 35% margin? Living in fantasy.
2. The phantom workforce problem
Your VP just presented a 350% ROI slide. Beautiful. But the model assumes all 30 reps are fully productive from January 1. In reality, you replaced 8 reps last year. Each took 3.2 months to ramp. That's 25.6 months of sub-quota production - over two full rep-years - that your model pretends doesn't exist. The consensus on r/sales is that ramp time is the single most underestimated cost in sales planning, and the threads back it up with painful specifics.
3. Tool overlap waste
If you're paying for 8.3 tools per rep on average, you almost always have redundancy. Sequencers, data providers, call recording, forecasting, intent, enrichment, and "AI" layers that do the same job. Audit quarterly or accept the leak. (If you want a baseline, start with your cost of sales tech stack.)
4. Assuming plan attainment
Your model assumes quota. Reality: 84% of reps missed it last year, and 67% don't expect to hit it this year. Build on actual attainment. If your team averages 72% of quota, your numerator just dropped 28%.
5. Measuring too early
One company spent ~$500K on a sales methodology implementation. Year one: $200K in accretive revenue at 35% margin = $70K gross profit. ROI: negative $430K. Major initiatives take 6-36 months to show real lift. Measuring at month three is measuring noise. Skip the early check-in if you want a number that means anything.
Why Vendor Calculators Lie
Every vendor ROI calculator is a sales pitch disguised as a spreadsheet.
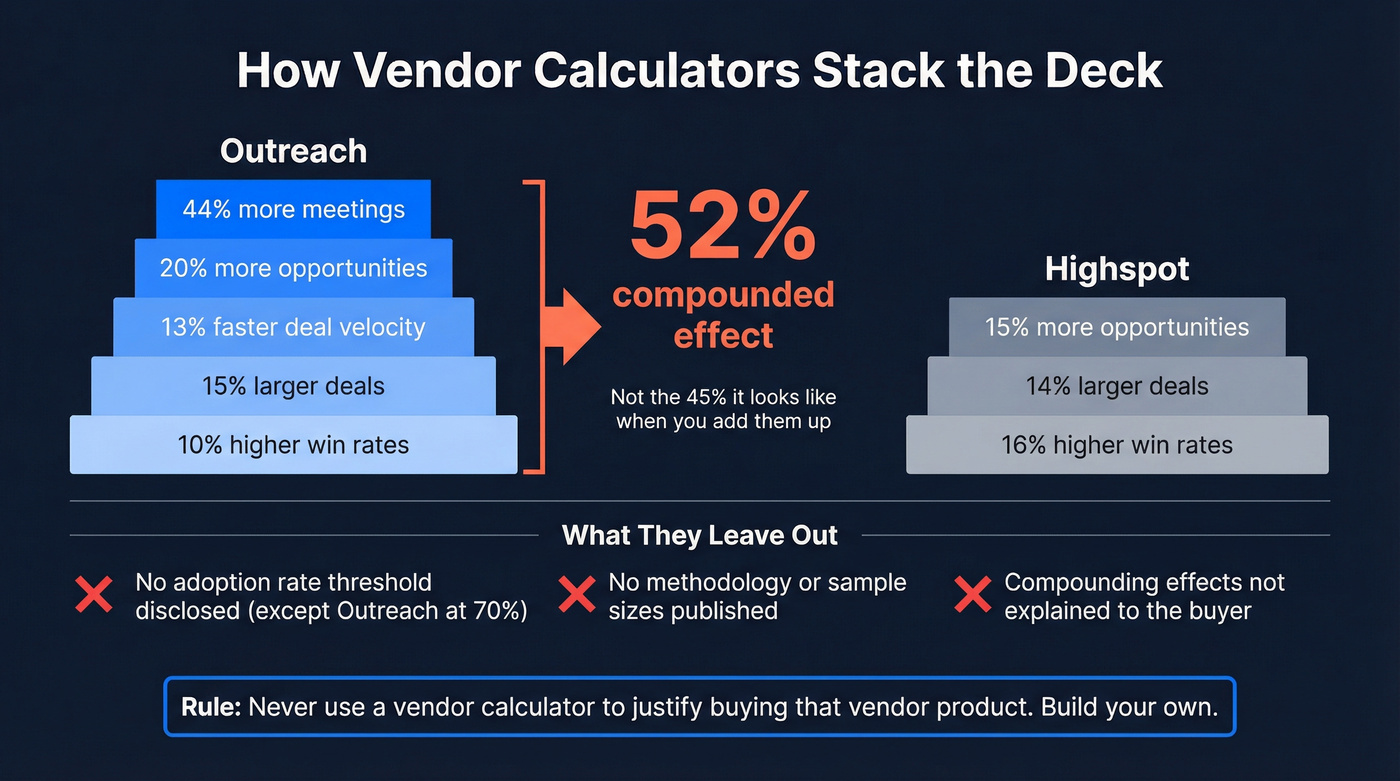
Outreach's calculator applies these benchmark improvements to your inputs: 44% more meetings, 20% more opportunities, 13% faster deal velocity, 15% larger deals, and 10% higher win rates. They call these 25th-percentile results from 5,000+ customers and assume a 70% adoption rate. Sounds conservative - until you realize they're stacking multiple compounding improvements simultaneously. A 10% win rate bump x 15% deal size bump x 20% more opportunities isn't a 45% improvement. It's ~52% compounded.
Highspot bakes in 15% more opportunities, 14% larger deals, and 16% higher win rates. GTMBuddy markets enablement outcomes like 67% faster ramp and 35% higher win rates with no visible methodology or sample size.
| Vendor | Assumptions | What's Missing |
|---|---|---|
| Outreach | Multiple compounding lifts | Assumes 70% adoption; compounding effects |
| Highspot | 3 compounding lifts | No adoption threshold disclosed |
| Most others | "Industry benchmarks" | No methodology, no sample size |
Never use a vendor's calculator to justify buying that vendor's product. Build your own.
How to Build Your Own Calculator
Here's the tab structure that works:
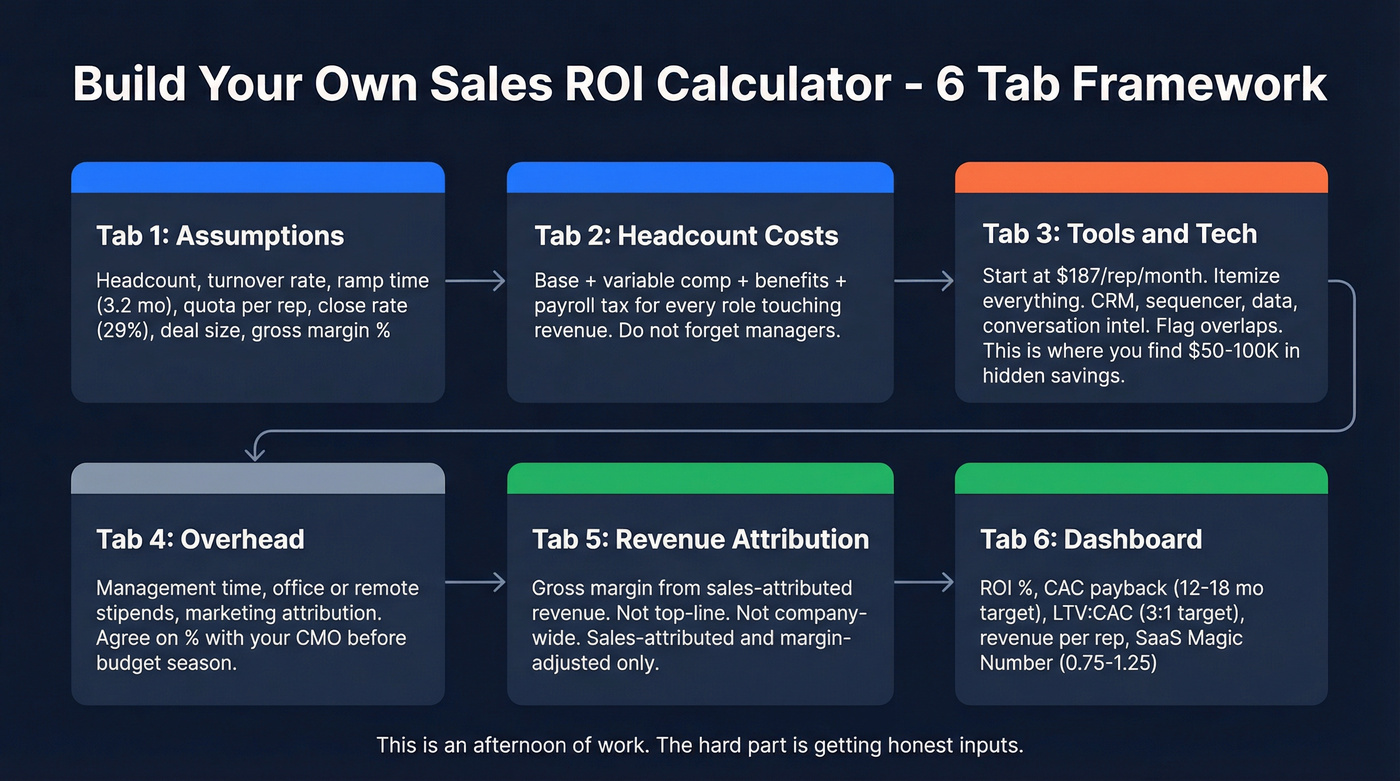
Tab 1 - Assumptions. Headcount, annual turnover rate, average ramp time (start with 3.2 months), quota per rep, close rate (29% B2B average), average deal size, gross margin percentage.
Tab 2 - Headcount Costs. Base + variable comp + benefits/payroll taxes for every role touching revenue. Don't forget managers.
Tab 3 - Tools & Tech. Start with $187/rep/month as your baseline, then itemize. CRM, sequencer, data provider, conversation intelligence, forecasting - list them all. Flag overlaps. In our experience, this tab is where teams find $50-100K in annual savings they didn't know existed. It's also where you'll see the starkest difference between paying $0.01/contact for verified data versus $1+ for enterprise platforms that aren't necessarily more accurate. (Use a sales tools checklist to audit faster.)
Tab 4 - Overhead. Management time, office/remote stipends, marketing attribution (agree on a percentage with your CMO before budget season, not during it). If attribution is a recurring fight, align it in a Revenue Operations Alignment doc.
Tab 5 - Revenue Attribution. Gross margin from sales-attributed revenue. Not top-line. Not company-wide. Sales-attributed, margin-adjusted.
Tab 6 - Dashboard. ROI percentage, CAC payback (12-18 months is healthy for growth-stage SaaS), LTV:CAC ratio (3:1 is the standard target), revenue per rep, and the SaaS Magic Number (0.75-1.25 means efficient growth). (If you need the ratio math, see CAC LTV Ratio.)
This is an afternoon of work. The hard part isn't the spreadsheet - it's getting honest inputs from people who have incentives to fudge them.
The Hidden ROI Lever: Data Quality
If a third of your emails bounce, that's not a deliverability problem - it's an ROI problem. Every bounced email represents wasted rep time, burned sender reputation, and pipeline that never materializes. If you’re diagnosing the root cause, start with hard bounce definitions and fixes.
Snyk's 50-person AE team was running bounce rates of 35-40%. After switching to Prospeo's verified data, bounces dropped below 5%, AE-sourced pipeline jumped 180%, and the team generated 200+ new opportunities per month. GreyScout saw a similar pattern: bounces fell from 38% to under 4%, pipeline grew 140%, and rep ramp time was cut from 8-10 weeks down to 4.
For your ROI model, clean data means the "data/lead costs" line stays low while the numerator grows because reps actually reach real people. At $0.01 per verified email with 98% accuracy, the math is hard to argue with. If you want a framework for ongoing hygiene, use a CRM hygiene process.
Tool overlap waste costs $2,340/rep/year. Prospeo replaces your data provider, email finder, mobile finder, and enrichment tool in one platform - with 143M+ verified emails, 125M+ mobile numbers, and a 7-day refresh cycle. Fewer tools, lower denominator, honest ROI.
Consolidate your stack and stop inflating your sales costs.
FAQ
Sales ROI vs. Marketing ROI?
Sales ROI isolates revenue attributed to the sales team against sales-specific costs - compensation, tools, management overhead, ramp time. Marketing ROI covers campaign spend and marketing-sourced pipeline. The overlap lives in attribution: when a marketing-generated lead closes, both teams want credit. Agree on attribution rules before you calculate, not after the numbers come back looking weird.
How often should you calculate?
Quarterly is the minimum for any team making resource decisions. Monthly makes sense during high turnover or active ramp periods - the denominator shifts fast when you're replacing reps every six weeks. Annual works for board reporting but misses the dynamics that drive real decisions.
Does data quality affect sales ROI?
Directly. If 30%+ of your contact data bounces, you're paying full salary for reps chasing dead addresses while burning your sender domain. Clean, verified data at scale is one of the cheapest ways to move the numerator without touching headcount or comp plans.
What's a good CAC payback period?
For growth-stage SaaS, 12-18 months is healthy. Under 12 months means you're likely underinvesting in growth. Over 24 months signals your sales costs are too high relative to deal value. Track this alongside your sales ROI calculator output - a team can show positive ROI while still having unsustainable unit economics if payback stretches too long.
How do I calculate revenue per rep?
Total sales-attributed revenue divided by the number of fully ramped reps. The key word is "fully ramped." Including reps in their first 3 months drags the average down and makes your productive reps look worse than they are. Segment by tenure for a clearer picture.