SDR Activity Metrics: Stop Tracking 15 KPIs - You Need These 5
Your VP of Sales just asked why the team hit 120% of activity targets last quarter but pipeline is flat. You pull up the dashboard: dials are up, emails are up, "touches" are through the roof. None of it moved the number. We've audited dozens of these dashboards, and the pattern is always the same - SDRs average 104 activities per day, yet only 18% produce a meaningful conversation. That's 85 wasted motions for every 19 that matter.
Dials per day is the most overrated metric in sales development. Here are the five that actually predict pipeline, with benchmarks you can steal today.
5 SDR KPIs That Predict Pipeline
Every competing guide lists 8-12 metrics and treats them equally. They're not equal. Bridge Group data across 351 B2B companies confirms that teams tracking full-funnel metrics see 22% higher meeting-to-opportunity conversion and 34% shorter sales cycles. Only 28% of sales teams have complete visibility into their prospecting-to-revenue pipeline, according to HubSpot's State of Sales report. The other 72% are flying blind.
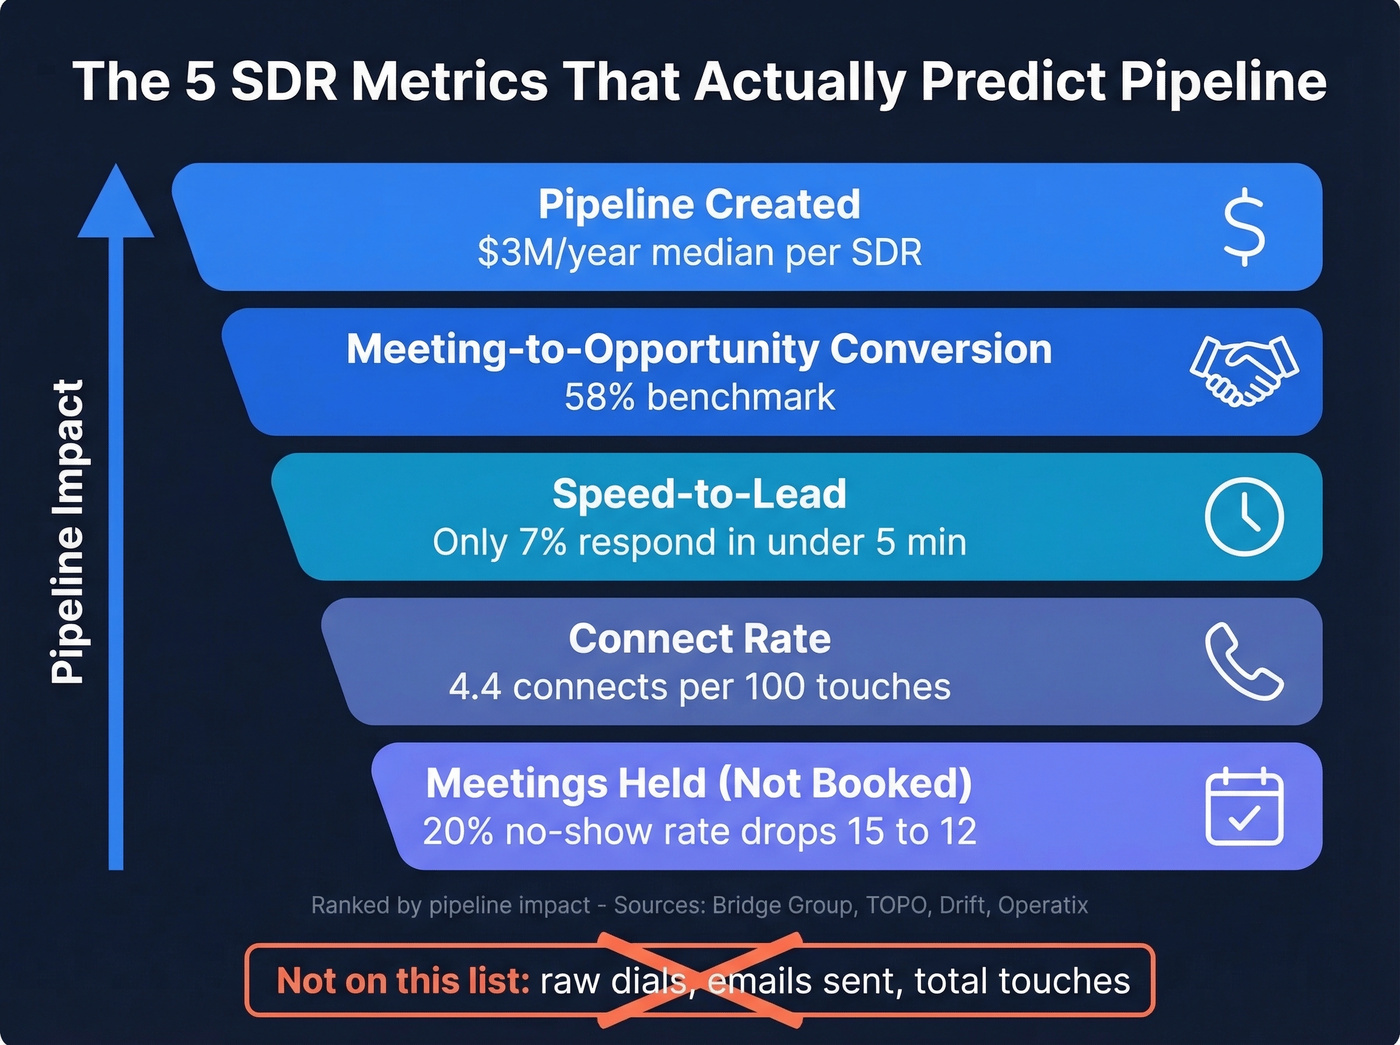
These five metrics, ranked by pipeline impact, are the ones worth building your dashboard around.
1. Pipeline Created
This is the only metric that connects SDR work to revenue. The Bridge Group study found a median of $3M/year in pipeline generated per SDR. If your reps aren't measured on dollars created, you're optimizing for motion instead of outcomes. (If you want a broader scorecard, start with these B2B Sales KPIs.)
2. Meeting-to-Opportunity Conversion
Booking meetings is easy to game. Converting them isn't. TOPO's benchmark puts this at 58%, meaning roughly 4 in 10 SDR-sourced meetings go nowhere. Track it weekly. It tells you whether reps are qualifying properly or just filling calendars with anyone who'll say yes.
3. Speed-to-Lead
Here's the thing: only 7% of companies respond to inbound leads within 5 minutes. The average response time? 42 hours. And 55% of teams never respond within 5 business days. Speed-to-lead is the single most impactful metric most teams ignore, and it's the cheapest one to fix. (More inbound-specific tracking: inbound SDR metrics.)
4. Connect Rate
The benchmark is 4.4 connects per 100 touches, with a typical range of 3-7%. Gartner puts it at 18+ dials to reach a single person, with callback rates below 1%. If your connect rate is below 3%, the problem isn't your reps - it's your data or your targeting. If you're still building the outbound motion, use an SDR outbound baseline.
5. Meetings Held (Not Booked)
An Operatix study of 150 SDRs found 15 meetings booked per month for outbound, but a 20% no-show rate drops that to 12 held. Inbound SDRs typically hold 15-25. If you're only tracking "booked," you're inflating the number by 20% before it even reaches an AE.
Notice what's missing from this list: raw activity volume. Calls per day, emails sent, "touches" - these are inputs, not outcomes. They belong on a coaching dashboard, not an executive one. (If you need a clean exec view, map these into your types of sales reports.)
SDR Benchmark Quick Reference
| Metric | Benchmark | Source |
|---|---|---|
| Pipeline created/year | $3M median | Bridge Group |
| Meeting-to-opp rate | 58% | TOPO |
| Speed-to-lead (< 5 min) | Only 7% of teams | Drift |
| Avg lead response time | 42 hours | HBR |
| Never respond within 5 biz days | 55% | Drift |
| Connect rate | 3-7% | 11x |
| Connects per 100 touches | 4.4 | Bridge Group |
| Meetings held/mo (outbound) | 12 | Operatix |
| Meetings held/mo (inbound) | 15-25 | 11x |
| SQL rate (outbound) | 15-25% | 11x |
| SQL rate (inbound) | 25-35% | 11x |
| Quota attainment | 56-68% of SDRs | Tenbound / Blossom |
Inbound vs Outbound Benchmarks
You can't hold inbound and outbound SDRs to the same numbers. The motions are different enough that blending them into one dashboard hides problems in both.
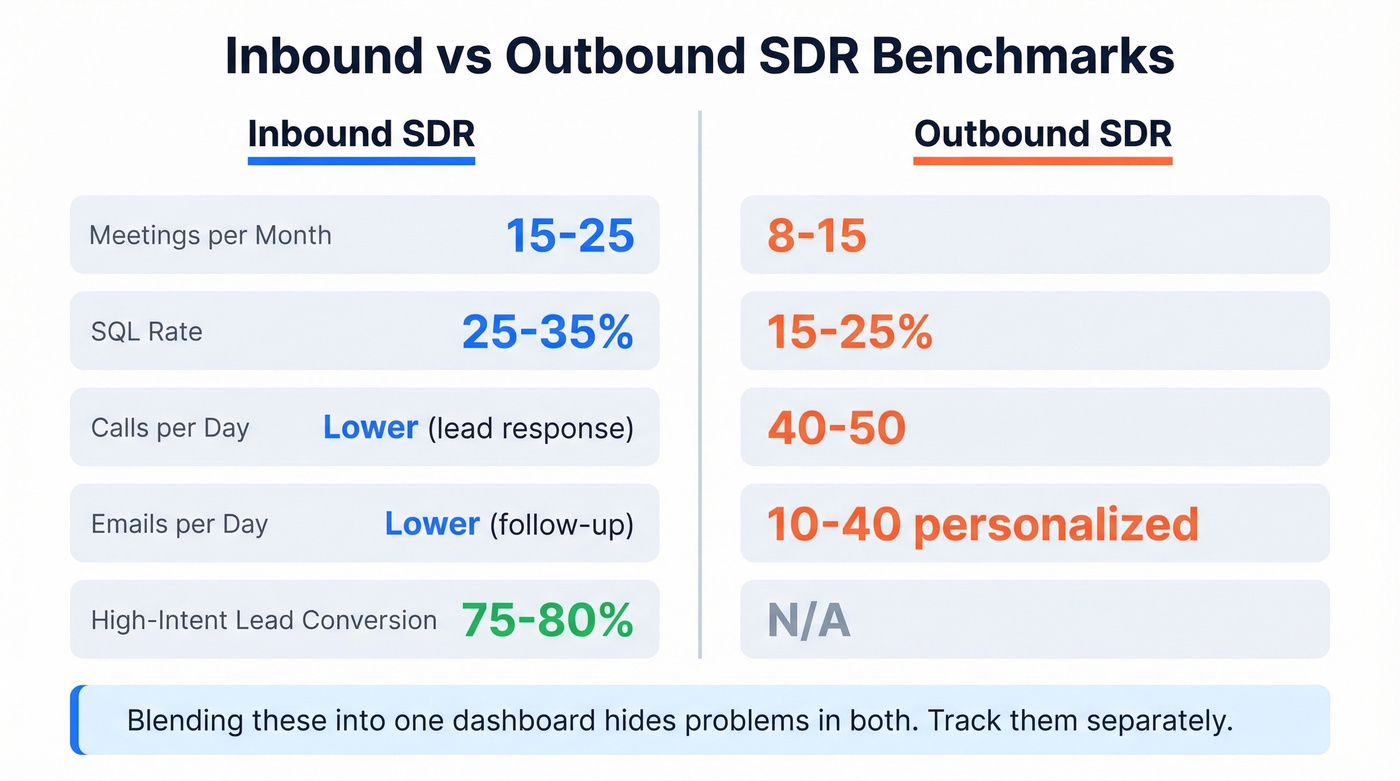
Outbound reps run 40-50 calls and emails per day, splitting time between cold dials and personalized outreach sequences. Inbound reps handle lead response at lower volume but convert high-intent leads at 75-80%. Low-intent inbound - ebook downloads, webinar attendees - converts at just 5-10%. Treating those the same guarantees bad forecasts.
High-volume dial targets (100+ per day) usually trade quality for burnout and lower conversion. Teams that win long-term tend to cap volume and push better lists, tighter ICPs, and stronger talk tracks instead. (If you're tightening targeting, start with an ICP sales strategy.)
| Metric | Inbound SDR | Outbound SDR |
|---|---|---|
| Meetings/month | 15-25 | 8-15 |
| SQL rate | 25-35% | 15-25% |
| Calls/day | Lower (lead response) | 40-50 |
| Emails/day | Lower (follow-up) | 10-40 personalized |
| High-intent lead-to-meeting | 75-80% | N/A |
| Low-intent lead-to-meeting | 5-10% | N/A |
A 3% connect rate isn't a rep problem - it's a data problem. Prospeo delivers 98% email accuracy and 125M+ verified mobile numbers with a 30% pickup rate. Teams using Prospeo book 26% more meetings than ZoomInfo users, not by dialing more, but by reaching real buyers.
Stop wasting 85 out of 100 touches on bad data.
The "4% Pipeline" Trap
A Soma Metrics case study lays it out: a team booking ~40 meetings per month, but only 4% entered pipeline. That's 1.6 real opportunities per month from a full SDR team. At roughly $55K/year per SDR in base pay, benefits, and licenses, you're paying real money for almost nothing. The meeting quota was green. The pipeline was red.
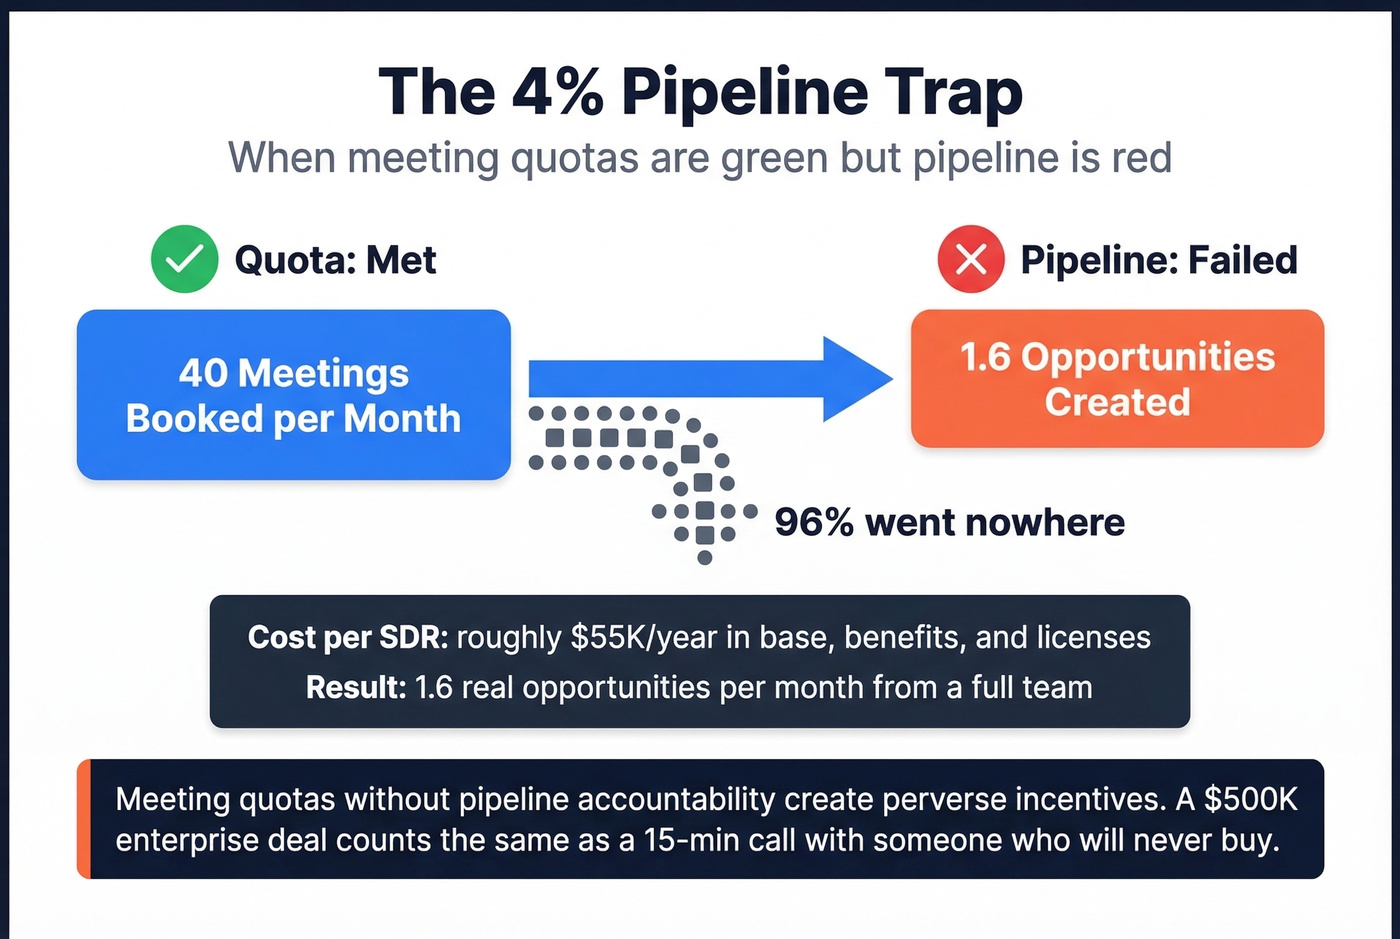
Meeting quotas without pipeline accountability create perverse incentives. Reps learn to book anything that breathes. A $500K enterprise opportunity counts the same as a 15-minute call with someone who'll never buy. (If you're redesigning comp/targets, sanity-check with an OTE to quota ratio.)
Let's break down a quick filter before you promote any metric to your dashboard. We call it the Three A's: is it Actionable (can reps change it?), Accessible (can the team understand it without a data analyst?), and Auditable (can you verify the calculation isn't gamed?). "Dials per day" passes Accessible but fails Actionable in any meaningful sense. Pipeline created passes all three. If you need a bigger menu of what to track, use these sales effectiveness metrics.
Set Daily Targets by Deal Size
A 100-dials-per-day target for an enterprise SDR is malpractice.
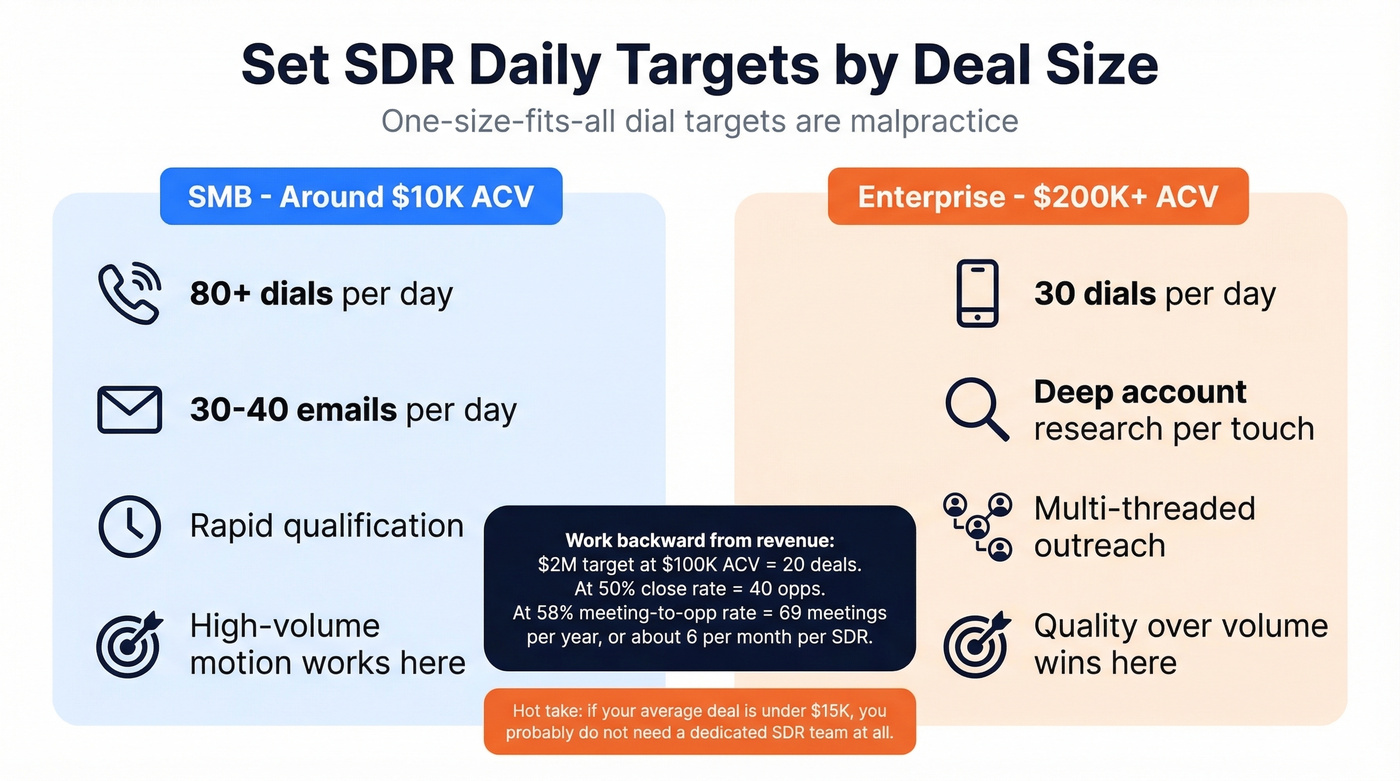
For SMB teams selling deals around $10K ACV, high-volume motions work: 80+ dials per day, 30-40 emails, rapid qualification. For enterprise teams working $200K+ deals, 30 dials per day with deep account research per touch is more realistic - and more productive. Aligning daily activity goals to your deal size prevents burnout on one end and underperformance on the other. (For enterprise scorecards, see enterprise sales metrics.)
Hot take: if your average deal is under $15K, you probably don't need a dedicated SDR team at all. A well-configured sequencing tool and clean data will outperform two undertrained reps every time.
Work the math backward from revenue. Say your target is $2M in pipeline: at $100K ACV, that's 20 deals. At a 50% close rate, you need 40 opportunities. At 58% meeting-to-opportunity conversion, that's 69 meetings per year - roughly 6 per month per SDR. Now you've got a target rooted in outcomes, not vibes. Track these in Salesforce, HubSpot, or your Outreach/Salesloft dashboards, wherever your reps already live. (If you want a repeatable system for this, use a sales quota calculator.)
The average company runs 1 SDR for every 2.4 AEs, ramps new SDRs in 3 months, and pays $80K OTE. If your ramp time is double that or your SDR-to-AE ratio is 1:5, recalibrate your targets before you blame rep performance. (For ramping, use a BDR onboarding framework.)
Why Data Quality Makes or Breaks Every Metric
If your bounce rate is above 5%, your activity metrics are fiction.
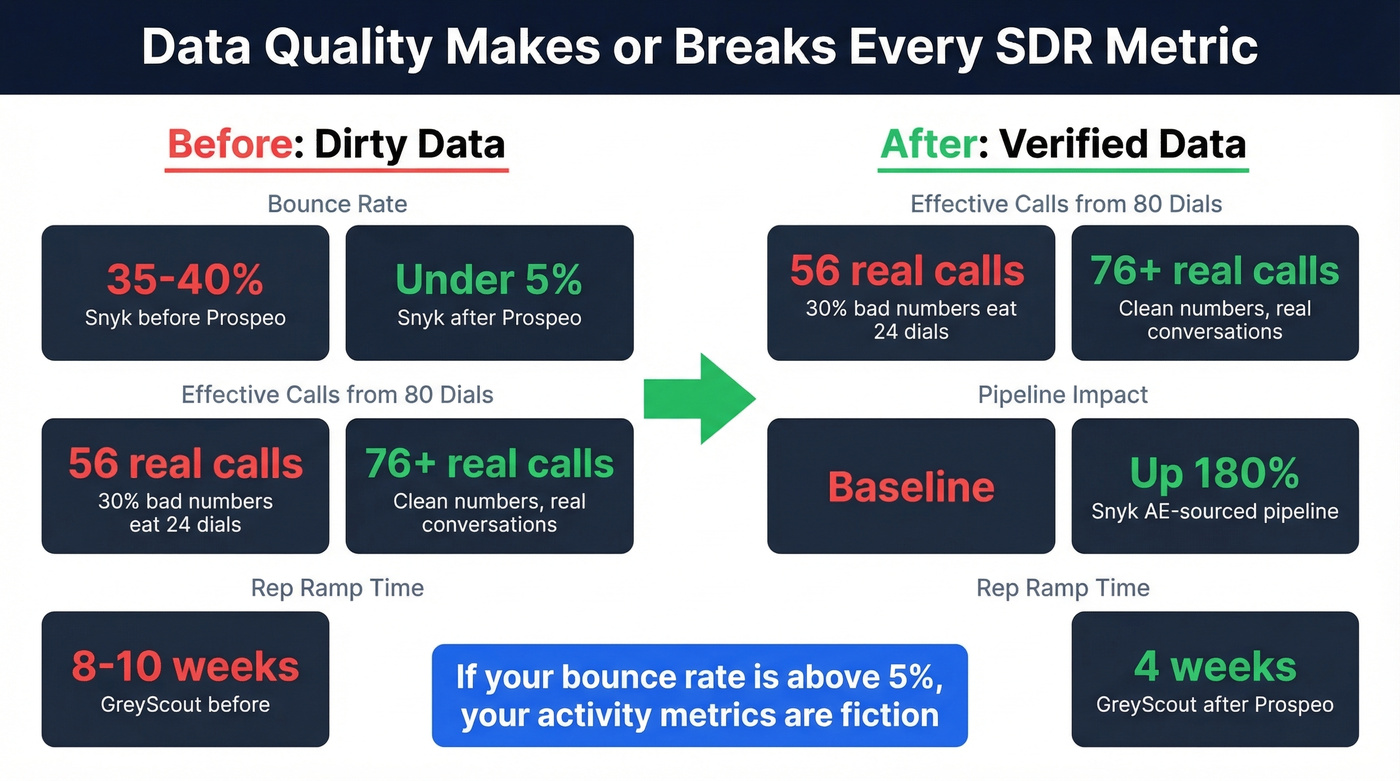
An SDR making 80 calls per day on a list with 30% bad numbers is effectively making 56 calls. Their connect rate looks terrible, their meetings-per-dial looks terrible, and none of it is their fault. It's the data. Without clean contact information, even the most disciplined SDR performance KPIs become meaningless - you're measuring noise, not signal. (If you're auditing deliverability, start with an email verification checker.)

We've seen this play out with real teams. Snyk had 50 AEs prospecting 4-6 hours per week with bounce rates running 35-40%. After switching to Prospeo for verified emails and direct dials, their bounce rate dropped under 5% and AE-sourced pipeline jumped 180%. GreyScout saw a similar pattern: bounce rate from 38% to under 4%, pipeline up 140%, and rep ramp time cut from 8-10 weeks to 4.
In our experience, teams that fix their data see metric improvements within the first 30 days. It's the highest-ROI change you can make before touching anything else on the scorecard.
Look - before you redesign your SDR scorecard, audit your contact data. Clean data doesn't just improve deliverability. It makes every metric on your dashboard trustworthy. When your sales development metrics finally reflect reality instead of garbage-in data, you can coach reps on what actually needs fixing. (If you want a deeper breakdown of what bad records cost, see bad leads.)
You just did the math: 69 meetings per year means every dial counts. Prospeo's 7-day data refresh means your SDRs never call a number that went stale six weeks ago. At $0.01 per email, cleaning up your lists costs less than one wasted hour of prospecting.
Give your SDRs lists worth dialing - starting today.
FAQ
How many calls should an SDR make per day?
The outbound benchmark is 40-50 calls per day. Connect rate matters more than volume - at 18+ dials per connect, an SDR on a clean list at 50 dials outperforms one grinding 100 on stale data. Fix the data first, then optimize volume.
What's a good SDR meeting quota?
Outbound SDRs should target 8-15 meetings per month; inbound, 15-25. Track meetings held and meeting-to-opportunity conversion, not just booked. A 20% no-show rate means 15 booked is really 12 held.
Why are my SDR connect rates below benchmark?
The most common culprit is stale contact data. If 20-40% of your phone numbers are dead, your connect rate denominator is inflated and your reps look worse than they are. Teams using verified data routinely see connect rates double within the first month after cleaning their lists. Skip this if your bounce rate is already under 5% - the problem is likely targeting or messaging instead.