How to Run a Target Market Analysis That Produces a Real Deliverable
Nearly 76% of businesses rate their sales organization as "Poor" according to Sales Xceleration's State of Sales report surveying 3,686 clients - and almost half haven't even defined a target market. That's not a strategy problem. It's a foundation problem.
This target market analysis framework gives you the deliverable most guides skip: a structured, defensible document you can hand to your exec team, your board, or your sales org and actually act on.
Market Analysis vs. Audience vs. Persona
People use these terms interchangeably and they shouldn't. Your target market is the broadest group - every potential customer who could buy your product. Your target audience is the narrower slice you're actively marketing to right now. A buyer persona is a semi-fictional profile of an individual within that audience, complete with job title, pain points, and buying behavior.
Each drives different decisions. Your target market shapes product strategy. Your target audience shapes campaign spend. Your personas shape messaging and content.
Here's the thing: 50% of marketers now use audience segmentation refinement as their top optimization technique, with CRO right behind it at 50%. Yet most teams skip the foundational market research that makes segmentation possible. They jump straight to personas based on gut feel, then wonder why campaigns underperform.
The 7-Step Analysis Framework
This framework mirrors how consultants actually structure market analyses - seven building blocks that are MECE (mutually exclusive, collectively exhaustive). No gaps, no overlap. Each block feeds the next. Skip one and your final deliverable has a hole in it.
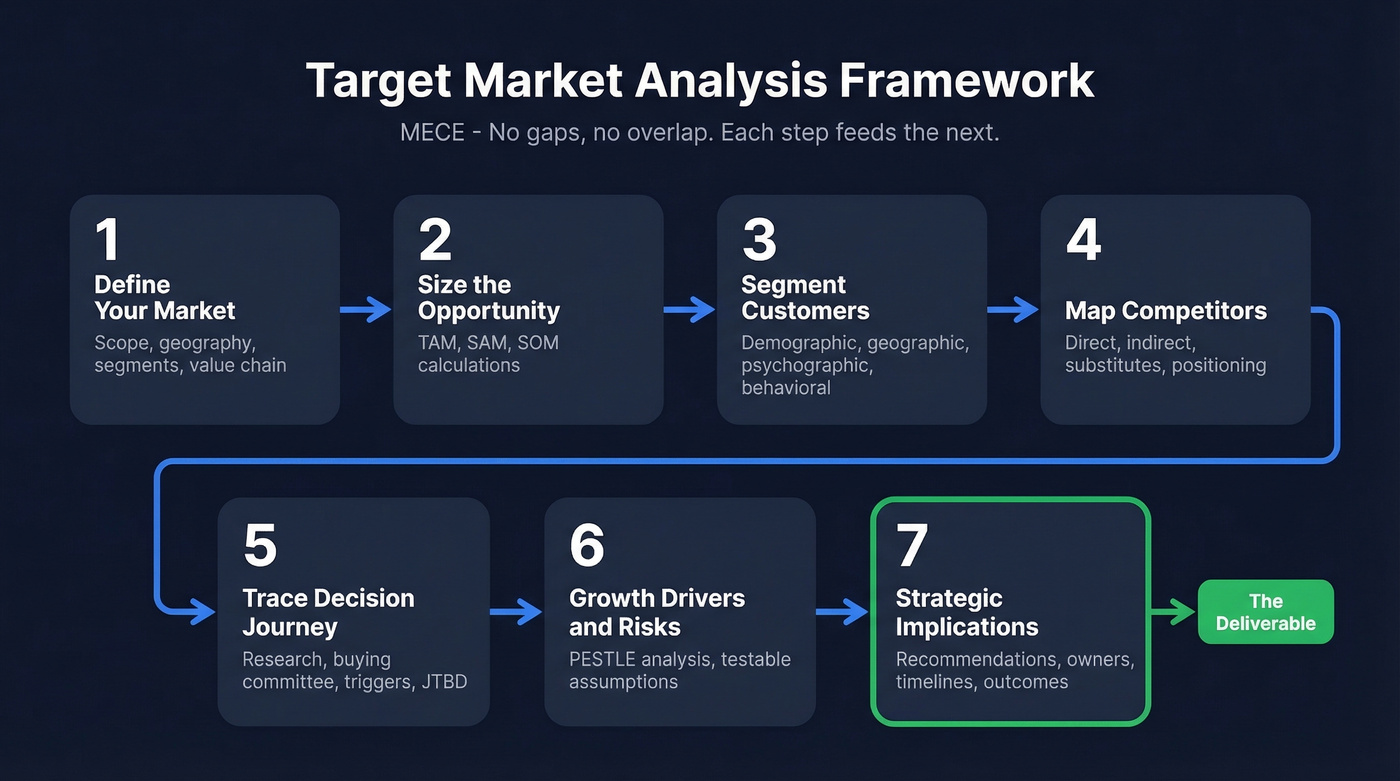
Step 1: Define Your Market
Write one sentence that defines your market scope. That sentence should specify the offerings included, customer segments covered, geography, and value-chain stage. "We sell project management software to mid-market professional services firms in North America" is a good market definition. "We sell software" is not.
Test boundary cases. If a consulting firm with 5,000 employees asks for a demo, are they in your market? What about a 15-person agency? A firm in the UK? A market definition that can't handle these questions is too vague to be useful.
Step 2: Size the Opportunity
This is your TAM/SAM/SOM calculation - covered in detail in the next section. You need both a top-down estimate (starting from industry reports and narrowing down) and a bottom-up estimate (starting from your actual sales data and scaling up). When the two converge, you've got a defensible number. When they don't, dig into why. (If you want a deeper breakdown of definitions and assumptions, see TAM, SAM, and SOM.)
Step 3: Segment Your Customers
Four classic segmentation types matter here. Demographic segmentation covers age, income, education, and household composition. Geographic segmentation breaks the market by region, density, or climate. The two that separate good analyses from great ones are psychographic segmentation - values, lifestyle, attitudes - and behavioral segmentation - purchase frequency, brand loyalty, usage patterns.
For B2B, add firmographics: industry, company size, revenue, tech stack, and growth stage. A SaaS company selling to 50-person startups and one selling to Fortune 500 enterprises are running completely different businesses, even if the product is identical.
Step 4: Map the Competitive Landscape
Identify direct competitors, indirect competitors, and substitutes. Most teams nail the first category and completely ignore the other two. A project management tool competes with Asana and Monday.com, sure - but it also competes with spreadsheets, email chains, and the decision to just not manage projects formally at all.
For each competitor, map positioning, estimated market share, and key differentiators. Porter's Five Forces helps you understand supplier power, buyer power, and threat of substitutes. SWOT analysis works for individual competitor profiles. If you need a repeatable process, use a competitive intelligence strategy to keep this updated.
Step 5: Trace the Decision Journey
How do your customers realize they have a problem? Where do they research solutions? Who else is involved in the decision? What triggers the actual purchase?
In B2B, this step is critical because buying committees average five decision-makers. Your champion might love the product, but the CFO cares about ROI, legal cares about compliance, and IT cares about integrations. Jobs To Be Done analysis is useful here - it forces you to articulate the underlying job your customer is hiring your product to do, which often reveals segments you'd miss with demographics alone. (If you're mapping stakeholders, it also helps to separate the technical buyer vs economic buyer.)
Step 6: Identify Growth Drivers and Risks
PESTLE analysis - Political, Economic, Social, Technological, Legal, Environmental - gives you a structured way to scan external factors. What regulatory changes could expand or shrink your market? What technology shifts are creating new demand?
Document these as explicit assumptions with a test plan, an owner, and a review date. "We assume remote work adoption stays above 40% through 2027" is a testable assumption. "The market will keep growing" is wishful thinking.
Step 7: Draw Strategic Implications
This is the "so what" step that separates an analysis from a report. Every finding from the previous six steps should produce a recommendation. If your fastest-growing segment is mid-market SaaS companies, the implication might be to shift 60% of outbound effort there. If your biggest competitor is weak in EMEA, the implication might be to accelerate international expansion.
Most teams fail here. They produce a beautiful document that never changes a single decision - and that's a Step 7 failure. Every insight needs an owner, a timeline, and a measurable outcome. Without that, you've written a report, not a strategy. (To operationalize the output, align it to sales execution and the metrics your team actually runs on.)
How to Size Your Market
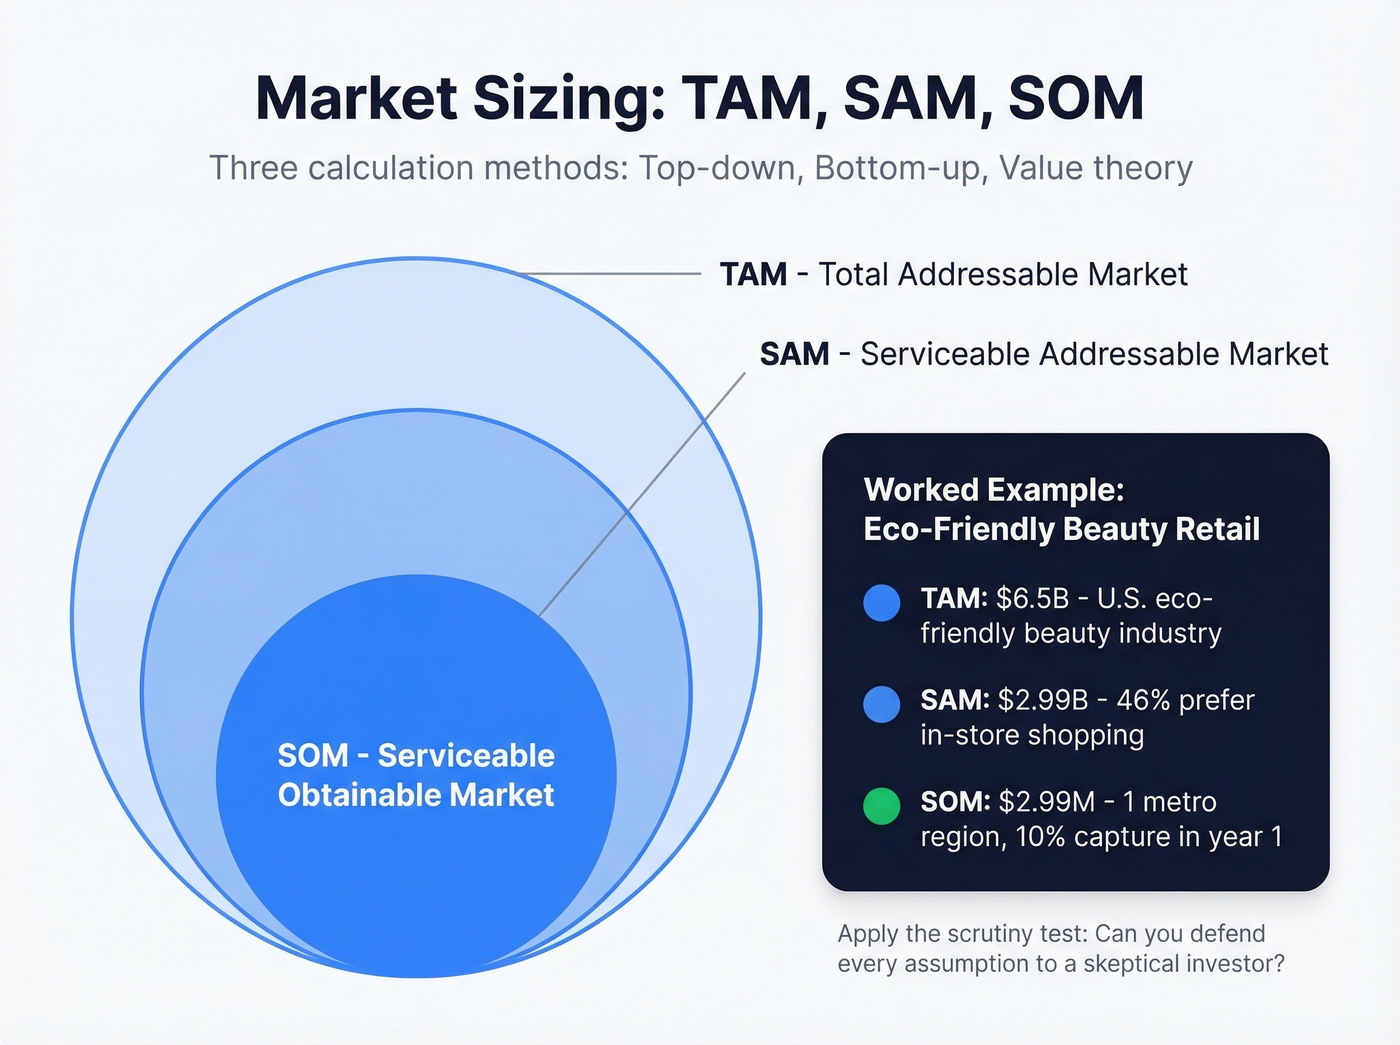
TAM, SAM, and SOM are the three layers of market sizing. TAM is the total revenue opportunity if you captured 100% of demand. SAM is the slice you can realistically serve given your geography, capacity, and business model. SOM is what you can actually capture in a specific timeframe with current resources.
Three calculation methods exist:
- Top-down starts with industry reports and narrows - fast but dependent on data quality.
- Bottom-up starts with your real sales data and scales - more accurate but time-consuming.
- Value theory prices based on the unique value you deliver versus alternatives, which works best for novel products without clear market comparisons.
Here's a worked example. Say you're launching an eco-friendly beauty retail concept in the U.S.:
- TAM: The U.S. eco-friendly beauty industry is roughly $6.5B.
- SAM: 46% of consumers prefer in-person shopping for beauty products, so $2.99B.
- SOM: You're targeting one metro region representing ~1% of the population, giving you $29.9M addressable. Assume you can capture 10% of that in year one: $2.99M.
Apply the "scrutiny test" - can you defend every assumption to a skeptical investor? And the "gut test" - does the final number feel plausible given your team size and funding? If your SOM is $50M but you have three employees and $200K in the bank, something's off.
Building Your B2B Ideal Customer Profile
In B2B, target market analysis centers on the Ideal Customer Profile. An ICP defines the attributes of the company most likely to buy, retain, and expand. It's distinct from buyer personas and from your TAM. (If you want a ready-to-use structure, start with an Ideal Customer Profile.)
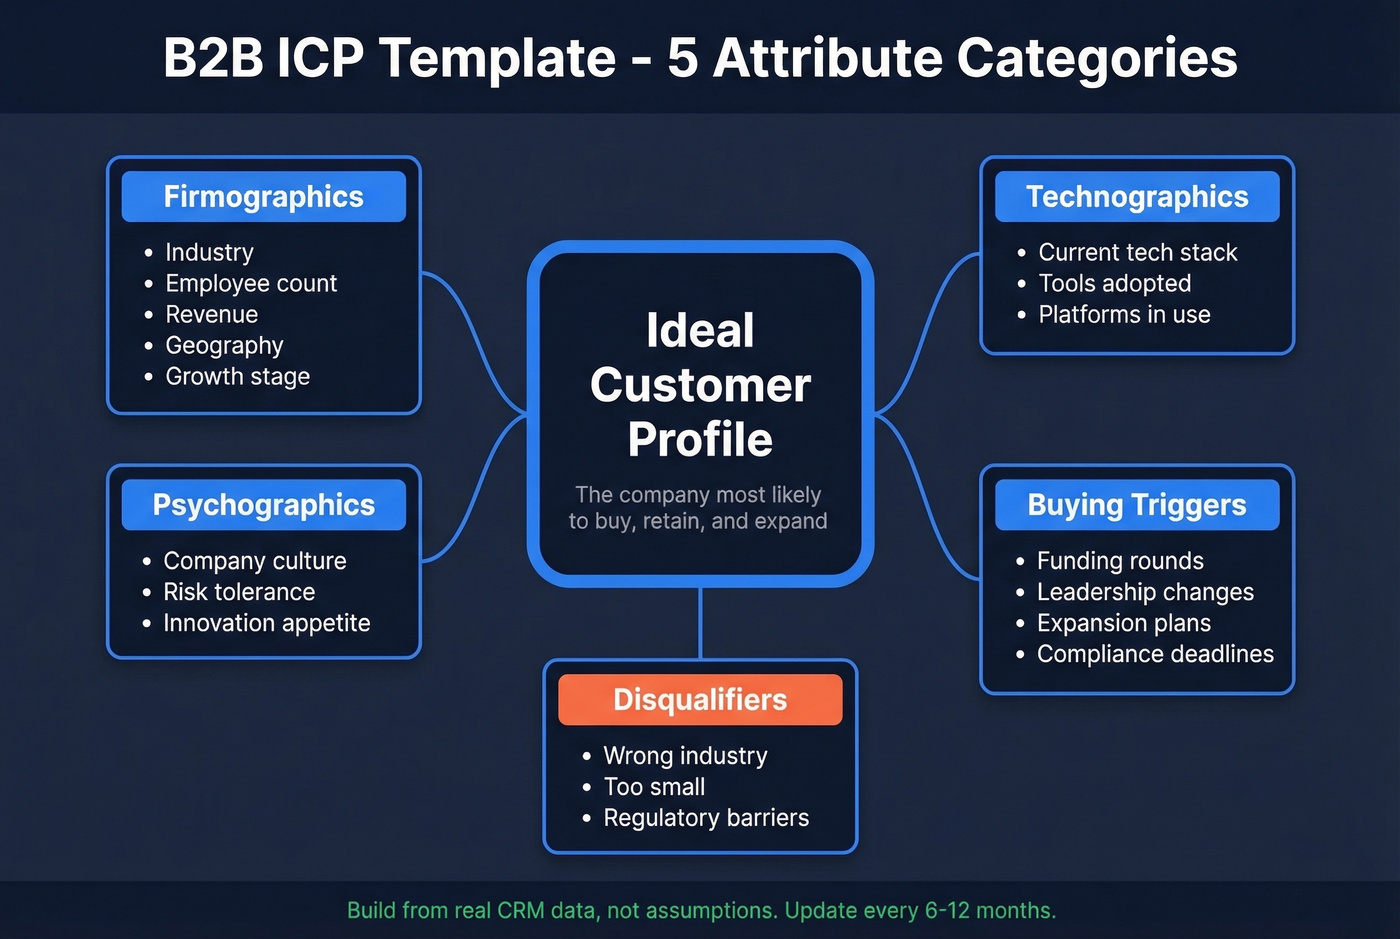
A strong ICP covers five attribute categories:
| Category | What It Covers |
|---|---|
| Firmographics | Industry, employee count, revenue, geography, growth stage |
| Technographics | Current tech stack, tools adopted, platforms in use |
| Psychographics | Company culture, risk tolerance, innovation appetite |
| Buying triggers | Funding rounds, leadership changes, expansion, compliance deadlines |
| Disqualifiers | Wrong industry, too small, regulatory barriers - accounts you shouldn't sell to |
Build your ICP from real data, not assumptions. Pull from CRM win/loss analysis, sales call recordings, customer interviews, and intent signals. The teams that skip this step end up with aspirational ICPs - profiles of who they wish bought from them, not who actually does. (If you're turning this into a repeatable system, pair it with intent based segmentation.)

Once your ICP is defined, the next step is finding contacts who match it. Prospeo lets you put your ICP to work immediately - filter 300M+ profiles by industry, headcount, tech stack, and intent signals across 15,000 topics using 30+ search filters. Emails are 98% verified on a 7-day refresh cycle, and the free tier gives you 75 emails per month to test whether your ICP actually converts before you commit budget. (If you're comparing options, see our guide to sales prospecting databases.)
Let's be honest: if your average deal size is under $15K, you probably don't need a $30K/year market research platform. A solid ICP, a B2B database, and 10 customer interviews will get you 80% of the way there. Save the enterprise tooling for when you've validated the segment.
Update your ICP every 6-12 months, or sooner if win rates shift.
You just sized your TAM and segmented by firmographics. Now turn that ICP into a contact list. Prospeo's 30+ search filters - industry, headcount, tech stack, funding, buyer intent - let you operationalize your target market analysis instantly across 300M+ profiles.
Stop analyzing your market in theory. Start reaching it at $0.01 per verified email.
Using AI to Accelerate Research
You don't need to do all of this manually. LLMs are genuinely useful for three specific parts of the analysis process.
Synthesizing interview transcripts. Feed 10 customer interview transcripts into an LLM and ask it to identify recurring pain points, objections, and buying triggers. What used to take hours of manual coding now takes under an hour. You'll still need to validate the themes, but the first pass is dramatically faster.
Analyzing competitor positioning. Collect competitor websites, G2 reviews, and case studies, then use an LLM to map positioning gaps. This is especially powerful for Step 4 - you'll spot messaging patterns and underserved segments that manual review misses.
Generating segmentation hypotheses. Describe your product and customer base, then ask the model to propose segmentation dimensions you haven't considered. Treat the output as hypotheses to test, not conclusions. The best use of AI in market analysis is expanding your hypothesis set, not replacing your judgment.
Mistakes That Waste Your Budget
Treating your audience as homogeneous. A financial advisor's pre-retirees, young professionals, and high-net-worth clients need completely different messaging. One campaign for all three wastes money on at least two of them.
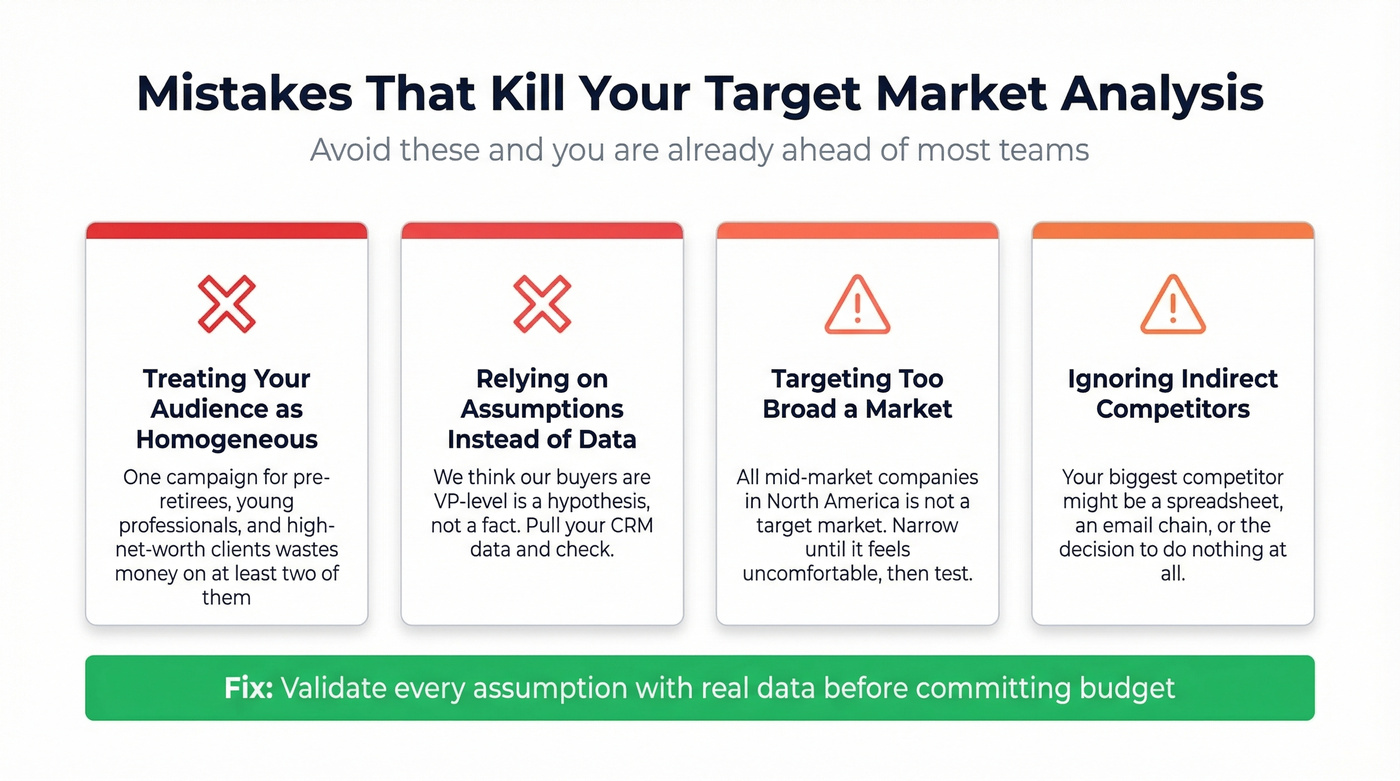
Relying on assumptions instead of data. "We think our buyers are VP-level" is a hypothesis. Pull your CRM data and check. We've watched teams spend quarters targeting the wrong seniority level because nobody validated the assumption.
Targeting too broad a market. "All mid-market companies in North America" isn't a target market - it's a continent. Narrow until it feels uncomfortable, then test.
Ignoring indirect competitors. Your biggest competitor might be a spreadsheet, an intern, or the decision to do nothing at all.
Never testing before committing budget. Run surveys, interviews, or a small paid campaign before you lock in your segmentation. A $500 ad test across two segments often tells you more than a month of desk research. Budget $10-25 per respondent for interview incentives, or offer a raffle for survey participants.
Treating the analysis as one-and-done. Markets shift. Competitors enter. If your analysis is older than 12 months, it's probably wrong in at least one important way. The consensus on r/sales is that quarterly ICP reviews are table stakes for any team doing serious outbound - and we agree.
Best Tools for 2026
Start free, scale up. You don't need a $30K research platform to run a credible analysis, especially in the early stages.
For Census data, QuickFacts gives you fast local demographic stats, while data.census.gov opens up 2.5M+ tables including American Community Survey 5-year estimates. Most guides name-drop the Census without telling you where to actually click. QuickFacts is where you click.
For competitive mapping, don't overlook the spreadsheet. Heyday Canning Co. validated their opportunity early using shelf-level competitor mapping in a spreadsheet before going deep on branding and product decisions. When evaluating paid tools, prioritize data freshness, integrations, scalability, and affordability - in that order.
| Tool | Category | Price | Best For |
|---|---|---|---|
| Google Trends | Demand/Seasonality | Free | Trend validation |
| Census QuickFacts | Demographics | Free | Local market data |
| Google Analytics | Web Analytics | Free | Behavioral data |
| Pew Research Center | Survey Data | Free | Psychographic insights |
| Google Forms | Primary Research | Free | Surveys on a budget |
| Prospeo | B2B Contact Data | Free; ~$0.01/email | ICP-to-outreach |
| SurveyMonkey | Primary Research | Free limited; ~$39/mo+ | Structured surveys |
| Semrush | Competitive Intel | ~$130-$250/mo | Search/competitor data |
| SimilarWeb | Competitive Intel | ~$150-$300/mo | Traffic benchmarking |
| Statista | Market Data | ~$150-$300/mo | Industry reports |
| Qualtrics | Enterprise Research | Not public | Large-scale surveys |
| GWI | Consumer Insights | ~$30,000+/yr | Global audience panels |
Skip GWI and Qualtrics unless you're running enterprise-scale research with dedicated analysts. For most B2B teams, the free tools plus a solid contact database cover 90% of what you need. (If you're building a stack, start with these free lead generation tools.)
From Analysis to Sales Plan
Run 10 customer interviews before you finalize your segments. Not five. Not "a few calls." Ten gives you enough pattern recognition to spot real themes versus individual quirks. Expect 1-5 days for secondary market research and 2-4 weeks for primary research including interviews and survey fielding.
Then test with money. A $500 paid ad campaign split across two or three segments will show you which one actually converts. Look for 2-3x conversion lift from advanced segmentation, 18% lower customer acquisition costs, and roughly 28% improvement in marketing ROI. Those are the benchmarks that justify the effort. (To track this cleanly, define your lead generation metrics up front.)
Real talk: stop trying to segment your way to perfection before you talk to a single prospect. Analysis and validation should run in parallel. We've seen teams spend three months on their target market analysis before testing anything, only to revise the whole thing after the first week of real outreach. Don't be that team.
Step 5 says B2B buying committees average five decision-makers. Prospeo gives you verified emails (98% accuracy) and direct dials (125M+ mobiles) for every stakeholder - from your champion to the CFO. Layer in intent data across 15,000 topics to find companies actively researching your category.
Reach every decision-maker in your target segment, not just the ones who fill out forms.
FAQ
How often should you update your analysis?
Revisit every 6-12 months minimum, or whenever win rates, customer mix, or competitive dynamics shift meaningfully. B2B teams in fast-moving markets should review quarterly. An outdated analysis actively misleads your team - especially if RevOps relies on it for pipeline targets and territory planning.
What's the difference between TAM, SAM, and SOM?
TAM is total market revenue if you captured 100% of demand - typically billions for broad categories. SAM is the slice you can realistically serve given geography and business model. SOM is what you can actually capture with current resources, usually 1-5% of SAM in year one. Investors expect all three with sourced assumptions.
How does a RevOps market analysis differ from a traditional one?
A RevOps analysis layers operational data - pipeline velocity, win rates by segment, expansion revenue - on top of the standard market picture. Instead of stopping at "here's the opportunity," it connects market sizing directly to quota setting, territory design, and forecasting models. If your revenue operations team isn't consuming the output, the analysis isn't actionable enough.
What's the fastest way to go from analysis to outreach?
Define your ICP with firmographic and technographic criteria, then use a B2B database to filter by those attributes plus intent signals. Export verified contacts and start testing messaging within days. The gap between analysis and first outreach should be hours, not weeks - and a free tier on your data tool lets you validate a segment before committing real budget.