ABM Metrics That Actually Matter - Benchmarks, Formulas, and Templates for 2026
47% of B2B marketers say proving ABM ROI is their top challenge. Not building programs, not getting buy-in - proving the thing works after they've already committed budget.
The problem isn't a lack of metrics. It's a lack of benchmarks, formulas, and context around those numbers. Ask practitioners on r/b2bmarketing what "good" looks like, and you'll get the same answer: audiences are "so specific to each company that benchmarks are nearly impossible to find." That's a cop-out. Benchmarks are hard, but they're not impossible - you just need the right framework and realistic ranges instead of false precision.
Here's what we've put together: a tiered framework with formulas, segment-specific benchmark ranges, and a scoring model you can implement this week.
Start With Three Numbers
If you're tracking nothing else, measure these:
- Account engagement score - are target accounts interacting with you?
- Pipeline contribution from target accounts - is ABM generating real pipeline?
- ABM win rate vs. non-ABM win rate - are ABM deals closing at a higher rate?
One prerequisite before any of this matters: your contact data has to be reliable. Every metric downstream is only as trustworthy as the data feeding it. If 15% of your emails bounce and half your phone numbers are dead, your engagement scores are fiction and your pipeline attribution is noise. (If you’re seeing this, start with email bounce rate benchmarks and fixes.)
Why Account-Based Metrics Are Different
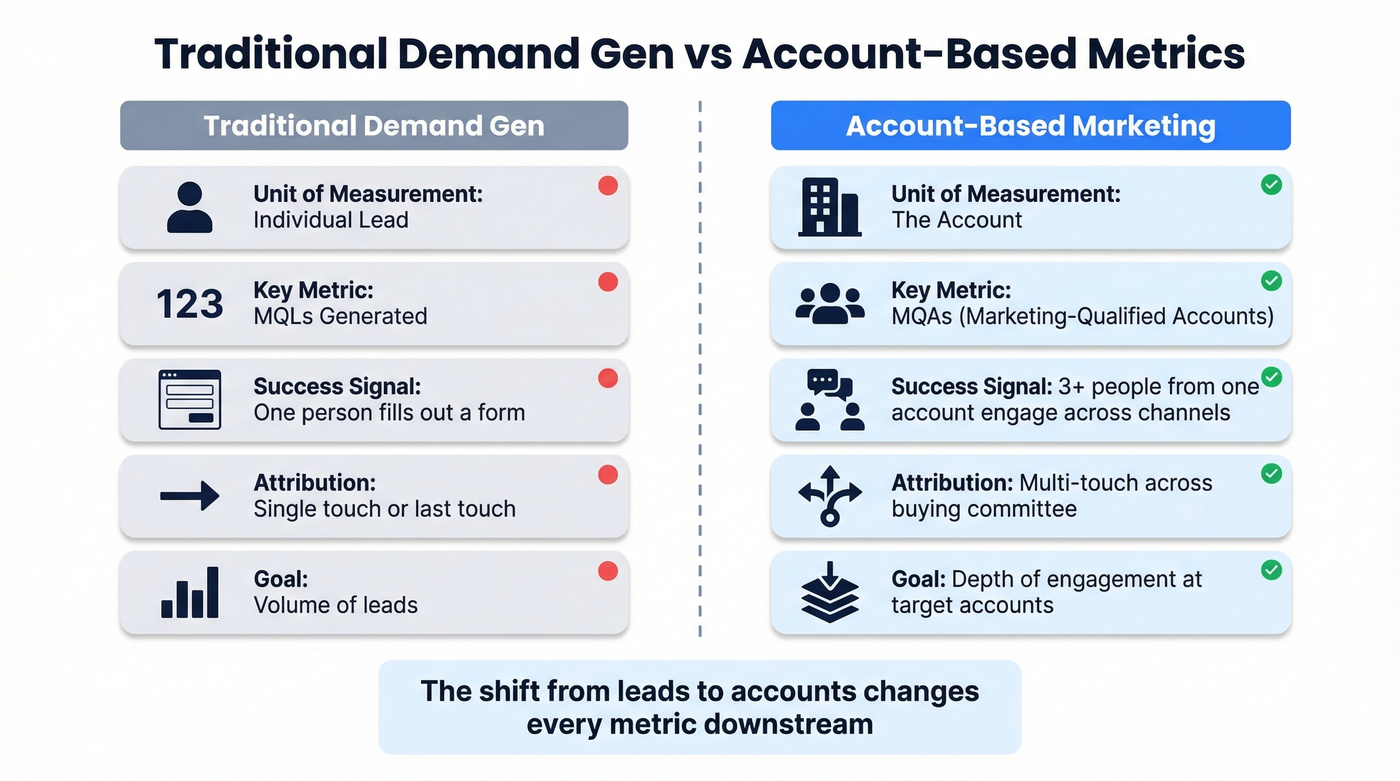
Traditional demand gen measures individual leads. How many MQLs came in? What's the cost per lead? ABM flips the unit of measurement from the lead to the account, and that shift changes everything downstream.
An MQL becomes an MQA (marketing-qualified account), which requires critical mass across a buying committee - not just one person downloading a whitepaper. A single VP filling out a form is a lead. Three people from the same account visiting your pricing page, attending your webinar, and replying to an email? That's an engaged account.
The numbers back this up. 71% of practitioners now run an ABM strategy (Demand Gen Report, 2025 survey), and top performers see 81% higher ROI compared to non-ABM programs, per a Demandbase study of 300+ global marketers. Meanwhile, 92% of ABM programs rely on email as their primary channel, and 72% use in-person events - making data quality and account penetration the two operational pillars that determine whether your measurements reflect reality or wishful thinking.
Some frameworks organize these KPIs by ITSMA's "Three Rs" - Relationships, Reputation, and Revenue. That's a useful mental model, but it doesn't tell you what to measure on Monday morning. The four-tier framework below maps directly to business outcomes.
The 4-Tier ABM Metrics Framework
Most guides dump 20 KPIs in a list and call it a day. What you actually need is a tiered structure: leading indicators that tell you if the engine is warming up, pipeline measurements that prove it's working, revenue outcomes that justify the investment, and retention numbers that show long-term value.
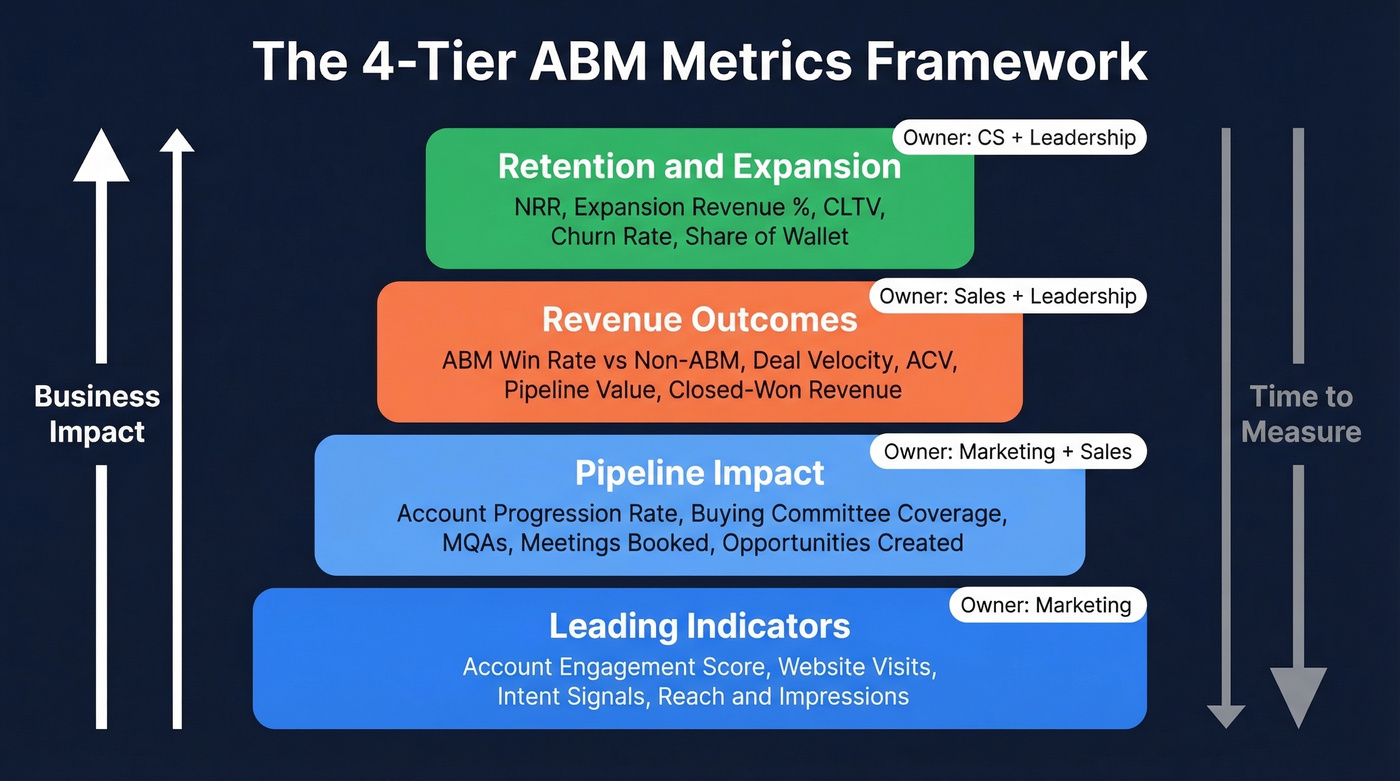
Tier 1 - Leading Indicators
These are your early-warning system. They won't impress the CFO, but they tell you whether your ABM motion is gaining traction before pipeline data exists. Owner: Marketing.
Account engagement score is the single most important leading indicator. Use scoring buckets as a starting framework: Cold (0-25 points), Warming (26-50), Hot (51+). We'll cover how to build the scoring model in a later section. (If you want a parallel framework, see lead scoring and adapt it to accounts.)
Target account website visits should be tracked on a 60-day rolling window. Use the benchmark ranges in the segment table below as your starting point.
Formula - Account Awareness Rate: Account Awareness Rate (%) = (Target accounts with >=1 website visit in 60 days / Total target accounts) x 100
Intent signal volume tracks how many target accounts show research activity around your category. This is where Bombora or 6sense add real value - they tell you who's in-market before they ever hit your site. 45% of practitioners see AI's promise for personalization, but nearly 70% find current AI effectiveness limited in practice. The data is useful; just don't expect it to replace human judgment on account prioritization yet. (Related: intent based segmentation.)
Account reach and impressions matter less than the others, but they're a useful sanity check. If you're running paid programs and zero target accounts are seeing your ads, you've got a targeting problem, not a measurement problem.
Tier 2 - Pipeline Impact
This is where ABM starts proving its value to sales leadership. Owner: Marketing + Sales (shared).
Account progression rate measures how quickly accounts move through your funnel stages. The stage definitions that actually work in practice: Aware (ad engagement, website visit, email opens) -> Engaged (asset download, webinar attendance, email reply) -> Considering (demo request, pricing page visit, sales conversation) -> Opportunity (deal created) -> Won. If accounts are stalling at Engaged for months, your middle-of-funnel content or sales handoff is broken. (For a broader view, map this to funnel metrics.)
Formula - Account Progression Rate: Account Progression Rate (%) = (Accounts moving to next stage in period / Total accounts in current stage) x 100
Buying committee coverage rate is underrated and undertracked. Here's the math: if a target account has a 20-person buying committee and you've engaged 15 of them, that's a 75% coverage rate. Forrester client feedback finds that when three stakeholders from the same company engage with your brand, you're 50% more likely to convert that opportunity to closed-won. Coverage isn't a vanity metric. It's a close-rate predictor. (If you’re building the list behind this, use an ideal customer profile template to keep coverage focused.)
Formula - Buying Committee Coverage: Coverage Rate (%) = (Engaged contacts at account / Estimated buying committee size) x 100
MQAs generated, meetings booked, and opportunities created round out the tier. These are the pipeline indicators your sales team already understands, just measured at the account level instead of the lead level. (If you need a health check, compare against pipeline health metrics.)
Tier 3 - Revenue Outcomes
Here's where the CFO pays attention. Owner: Sales + Leadership.
ABM win rate vs. non-ABM win rate is the single most persuasive number you can present. TOPO found opportunities from accounts receiving an account-based approach closed at 53% versus 19% for demand generation - roughly 2.8x higher. Your numbers will vary by segment, but if ABM accounts aren't closing at a meaningfully higher rate, something's wrong with your account selection or execution. (Tie this back to sales conversion rate benchmarks.)
Deal velocity should compress for engaged accounts. If cycles are the same length as non-ABM deals, your program isn't accelerating anything - it's just relabeling. (See also: sales process optimization.)
Formula - Deal Velocity Compression: Velocity Compression (%) = [(Non-ABM avg cycle days - ABM avg cycle days) / Non-ABM avg cycle days] x 100
ACV from ABM accounts, pipeline value, and closed-won revenue complete the picture. Track these separately from your demand-gen pipeline so you can isolate ABM's contribution. (If you’re standardizing reporting, align with sales operations metrics.)
Tier 4 - Retention and Expansion
ABM doesn't end at closed-won. The best programs drive expansion revenue and reduce churn. Owner: Customer Success + Leadership.
Net revenue retention (NRR) is the north star here.
Formula - NRR: NRR (%) = [(Beginning ARR + Expansion - Contraction - Churn) / Beginning ARR] x 100
Track expansion revenue as a percentage of total revenue - if ABM accounts expand at higher rates than non-ABM accounts, that's a powerful proof point. CLTV, churn rate, and share of wallet round out the retention tier. These take multiple quarters to become meaningful, which is exactly why most teams skip them. Don't. (Deep dive: churn analysis.)
Benchmark Ranges by Segment
Let's be honest: the reason nobody publishes ABM benchmarks isn't that they're impossible - it's that they require you to specify the segment. A 50-account enterprise program and a 500-account mid-market program are fundamentally different motions with different economics. Treating them as one category is why "it depends" has become the default answer.
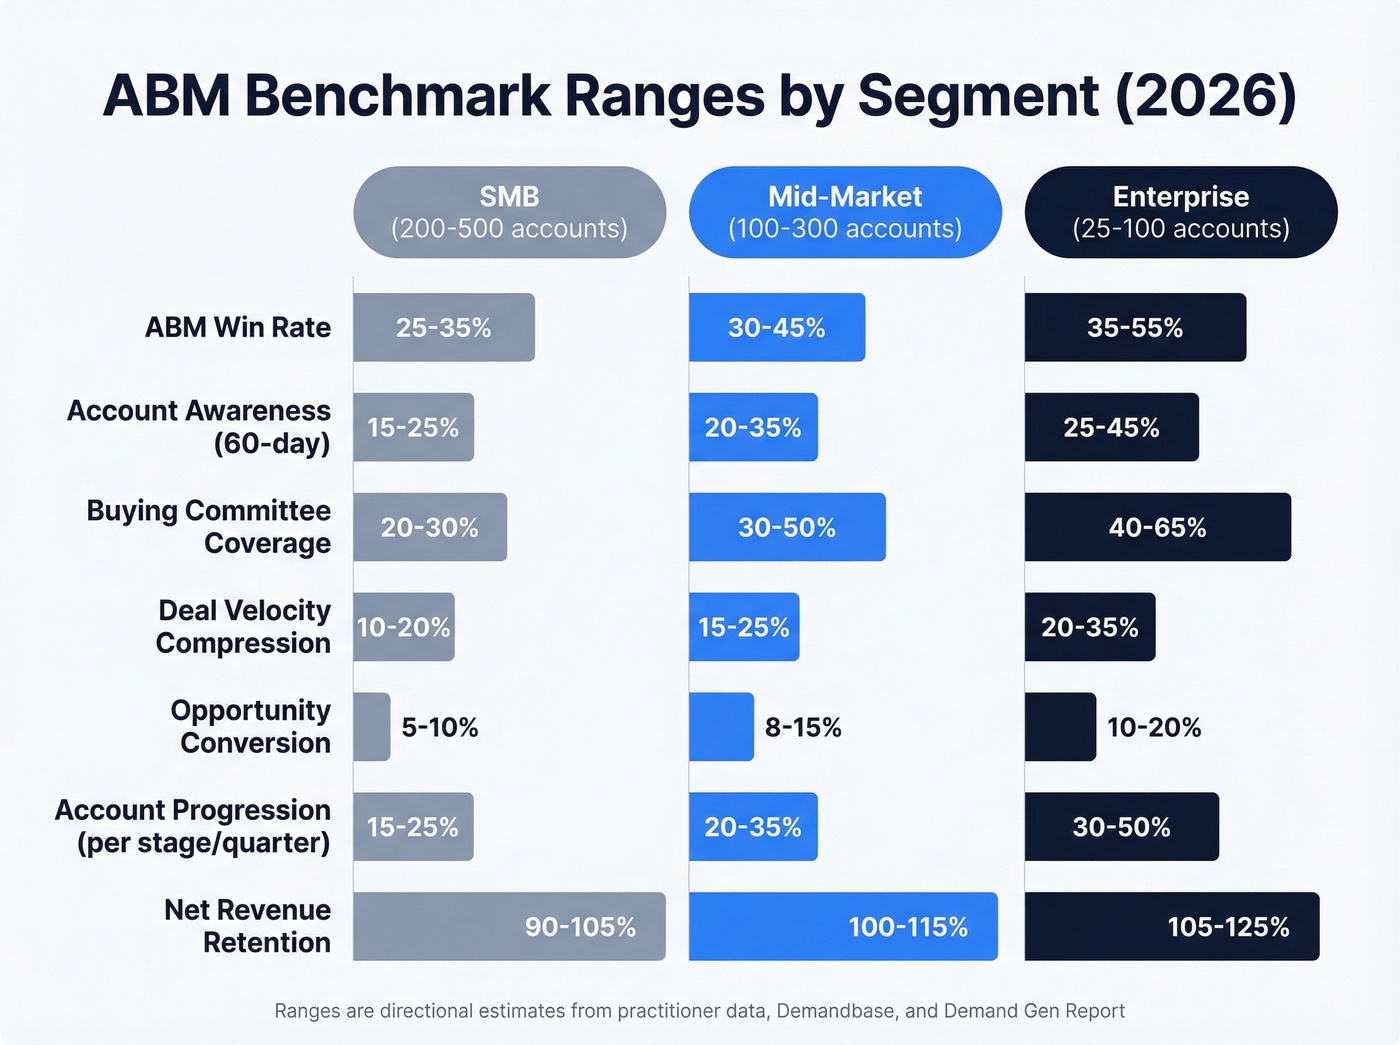
These ranges are estimated from practitioner discussions, Demandbase and Demand Gen Report data, and patterns we've observed across hundreds of programs. They're directional, not gospel - but directional beats nothing.
| Metric | SMB (200-500 accounts) | Mid-Market (100-300 accounts) | Enterprise (25-100 accounts) |
|---|---|---|---|
| Account awareness rate (60-day) | 50-65% | 45-60% | 60-80% |
| Account progression rate (per stage, per quarter) | 15-25% | 10-20% | 8-15% |
| Buying committee coverage | 30-50% | 40-60% | 50-75% |
| Opportunity conversion rate | 5-8% | 3-6% | 8-15% |
| ABM win rate | 25-35% | 30-45% | 35-55% |
| Deal velocity compression | 10-20% | 15-25% | 20-35% |
| NRR | 105-115% | 110-120% | 115-130% |
Enterprise programs show higher win rates and deeper velocity compression because the investment per account is higher - more personalized content, dedicated SDR coverage, and executive engagement. The trade-off is longer absolute cycle times and higher cost per opportunity. SMB programs win on volume and speed but typically see lower per-account engagement depth.
If your average deal size is under $10K, skip enterprise-tier measurement. A lighter engagement scoring model and basic pipeline attribution will get you 80% of the insight at 20% of the operational overhead.
Every ABM metric in this framework depends on one thing: reaching the right people at target accounts. Prospeo's 300M+ profiles with 98% email accuracy and 125M+ verified mobiles mean your engagement scores reflect real interactions - not bounced emails and dead numbers.
Stop measuring noise. Start with data that's refreshed every 7 days.
Build Your Engagement Scoring Model
An engagement score without a clear model behind it is just a number someone made up. Here's an implementable starting point.
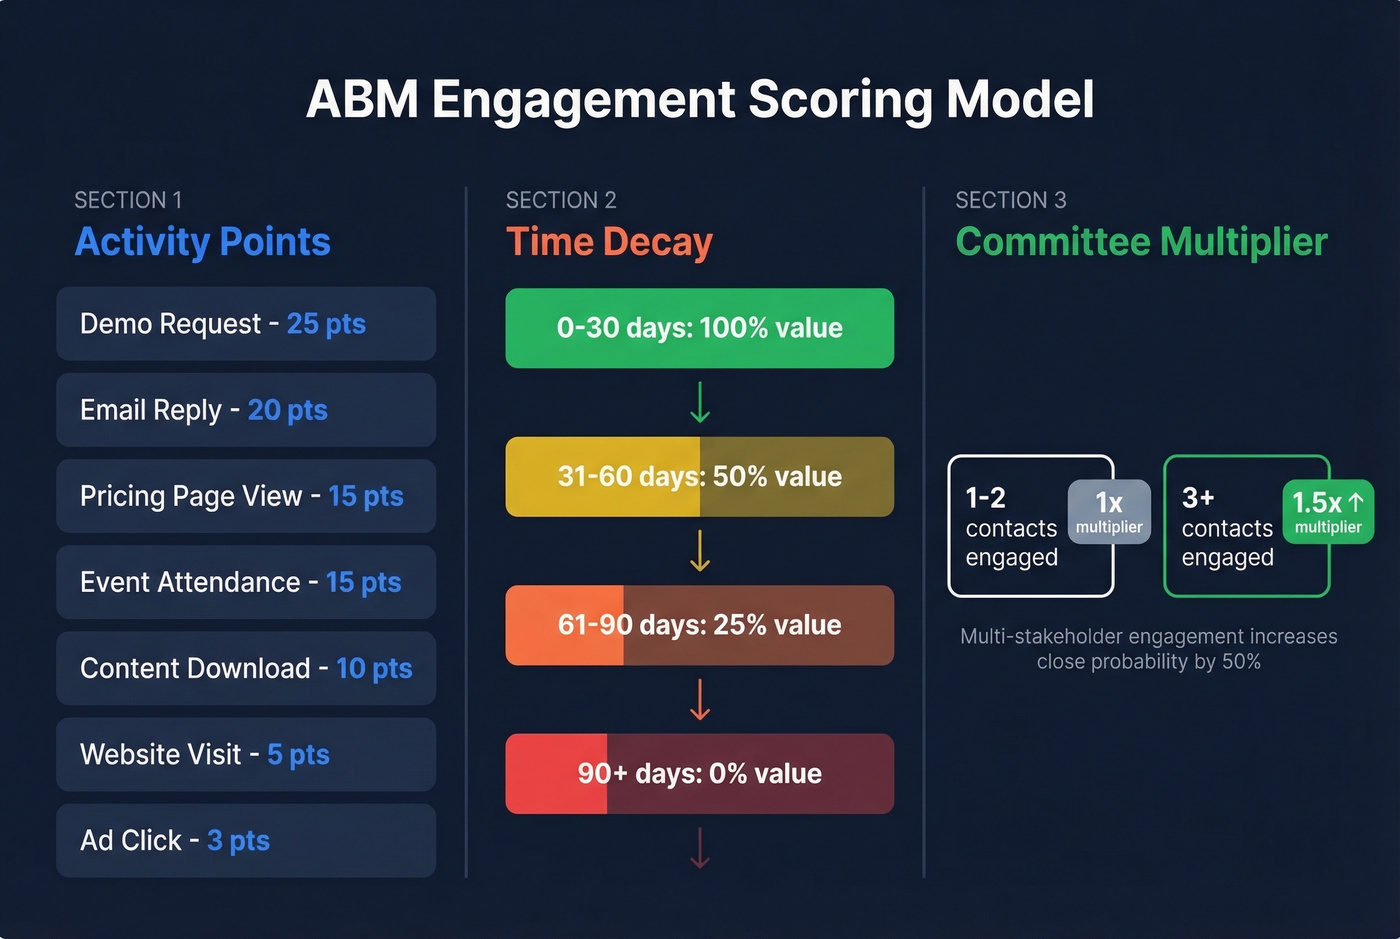
| Activity | Points |
|---|---|
| Website visit | 5 |
| Pricing page view | 15 |
| Content download | 10 |
| Demo request | 25 |
| Email reply | 20 |
| Event attendance | 15 |
| Ad click | 3 |
Time decay keeps scores honest. Full value for activity in the last 30 days. Half value at 31-60 days. Quarter value at 61-90 days. Zero after 90 days. Without decay, an account that downloaded a whitepaper eight months ago looks the same as one that requested a demo yesterday.
The buying committee multiplier separates lead scoring from account scoring. When three or more contacts from the same account are engaged, multiply the account score by 1.5x. This reflects the Forrester finding that multi-stakeholder engagement dramatically increases close probability.
Here's the thing: your engagement score is fiction if 15% of your emails bounce. Before building any scoring model, verify your target account list. Prospeo refreshes contact records every 7 days with 98% email accuracy, so scores reflect real engagement - not bounced emails inflating activity counts.
How to Calculate ABM ROI
The formula is straightforward:
ABM ROI (%) = [(Revenue from ABM Accounts - Total ABM Investment) / Total ABM Investment] x 100
A worked example: your ABM program generates $750K in closed-won revenue. Total investment - platforms, content production, paid media, and allocated headcount - comes to $150K. That's a 400% ROI.
The tricky part is defining "Total ABM Investment" completely. Include your ABM platform costs, whether that's Demandbase, 6sense, or similar. Add content production, paid media spend, and a realistic allocation of headcount time. Most teams undercount by 30-40% because they forget to include the SDR hours dedicated to ABM accounts and the portion of marketing ops time spent on account-level reporting.
For attribution, weighted multi-touch is the right model for most programs. Single-touch attribution dramatically oversimplifies the buyer journey. If you don't have the infrastructure for weighted multi-touch, linear attribution is a reasonable starting point - just know it treats a blog visit the same as a demo request.
Who Owns Which Measurements
ABM measurement breaks down when nobody owns the numbers.
| Marketing | Sales | Customer Success | Leadership |
|---|---|---|---|
| Engagement score | Pipeline value | NRR | ROI |
| MQAs generated | Win rate | Churn rate | Pipeline value |
| Account reach | Deal velocity | Expansion revenue | CLTV |
| Coverage rate | ACV | Upsell/cross-sell | Win rate trends |
The key principle: build a shared KPI framework where marketing, sales, and CS all see the same dashboard. When marketing reports engagement in one system and sales reports pipeline in another with different definitions, nobody trusts the numbers. We've seen this kill programs that were actually working - the data existed, but it lived in three different tools with three different account hierarchies. One shared dashboard with agreed-upon definitions is worth more than three sophisticated platforms that don't talk to each other.
Common Measurement Mistakes
Quarterly timelines. ABM needs multiple quarters for pipeline impact and reliable ROI data. If leadership evaluates ROI after one quarter, you're measuring a marathon at mile two.
Activity over progression. Opens, clicks, and impressions feel good in a dashboard but tell you almost nothing about whether accounts are moving toward a purchase. Track account progression through funnel stages, not activity volume.
No time decay. We've seen teams with "Hot" accounts that haven't interacted in six months. Without decay rules, your scoring model becomes a historical record, not a prioritization tool.
Poor account selection. If your target account list is built on firmographics alone, you're missing the signal. Layer in intent data, engagement history, and win-pattern analysis. The best TAL combines ICP fit with in-market signals. (If you need a tighter definition, start with firmographic filters.)
Speed without measurement depth. One practitioner running AI-assisted 1:1 ABM reported 10x faster content production - but found that signal depth was limited to obvious fields like title and company size. Speed without measurement depth just creates more noise faster.
Stale contact data. This one's frustrating because it's so preventable. If 20% of your TAL has outdated emails or wrong phone numbers, your engagement scores, coverage rates, and pipeline attribution are all compromised from the start. Clean your TAL before measurement begins - not after you've spent a quarter wondering why the numbers look off.
Buying committee coverage is your strongest close-rate predictor - but you can't cover a 20-person committee with bad contact data. Prospeo returns 50+ data points per contact at 92% match rate, so you can map and reach entire buying groups at $0.01 per email.
Hit 75% committee coverage without burning your domain reputation.
ABM Tracking Template
Copy this table into a spreadsheet. Fill in "Your Number" each quarter and compare against the benchmark ranges above.
| Metric | Formula | Benchmark (Mid-Market) | Owner | Your Number |
|---|---|---|---|---|
| Account awareness rate | Target accounts with >=1 visit / Total targets x 100 | 45-60% | Marketing | |
| Account engagement score | Weighted activity points + committee multiplier | 40+ = Hot | Marketing | |
| Buying committee coverage | Engaged contacts / Committee size x 100 | 40-60% | Marketing + Sales | |
| Account progression rate | Accounts advancing stage / Total in stage x 100 | 10-20% per quarter | Marketing + Sales | |
| MQAs generated | Accounts meeting engagement threshold | Varies by TAL size | Marketing | |
| ABM win rate | ABM closed-won / ABM opportunities x 100 | 30-45% | Sales | |
| Deal velocity compression | (Non-ABM cycle - ABM cycle) / Non-ABM cycle x 100 | 15-25% | Sales | |
| ACV from ABM accounts | Avg contract value, ABM cohort | Track vs. non-ABM | Sales | |
| ABM ROI | (Revenue - Investment) / Investment x 100 | 200-400% at maturity | Leadership | |
| NRR | (Begin ARR + Expansion - Contraction - Churn) / Begin ARR x 100 | 110-120% | CS + Leadership |
Swap the "Mid-Market" column for your segment using the benchmark ranges table above.
FAQ
What's the difference between ABM metrics and demand-gen metrics?
ABM measures account-level engagement and progression - MQAs, buying committee coverage, account engagement scores - while demand gen measures individual lead volume. The fundamental shift is from "how many leads entered the funnel" to "are the right accounts moving through it." This approach treats the buying committee as a single unit rather than a collection of independent leads.
How long before ABM shows measurable results?
Leading indicators like engagement scores should show movement within 30-60 days. Pipeline impact and reliable ROI data take 2-3 quarters minimum. Set these expectations with leadership upfront - rushing to prove ROI before the data matures is the fastest way to kill a program that's actually working.
How do I build a target account list with reliable data?
Start with ICP criteria - industry, headcount, tech stack, revenue - then layer intent signals to find accounts actively researching your category. The critical step most teams skip is verifying contact data before launching. Prospeo's B2B database lets you filter by buyer intent across 15,000 topics and returns verified emails and mobile numbers, so your engagement scores reflect real activity from day one.
What is a good ABM engagement score?
Using the scoring model above, 0-25 is Cold, 26-50 is Warming, and 51+ is Hot. Track how your target account list shifts across these buckets quarterly - if most accounts stay Cold after 90 days, revisit your channel mix, targeting, and messaging before blaming the program.
Which KPIs should I track first?
Start with three: account engagement score, pipeline contribution from target accounts, and ABM win rate versus non-ABM win rate. These give you a leading indicator, a pipeline indicator, and a revenue indicator - enough to tell whether your program is working without drowning in dashboards.