Client Acquisition Rate: Benchmarks, Formula & How to Improve It
Most guides about client acquisition rate actually cover customer acquisition cost. Those are different metrics answering different questions. Acquisition rate tells you whether your process converts. Acquisition cost tells you whether your budget works. Here's the guide that should have existed all along.
The short version: this metric is your conversion percentage - leads who become paying clients. The average top-of-funnel conversion sits at 2.9% across industries, where "conversion" means a qualified lead. SQL-to-closed-won rates range from 37% to 53% depending on vertical. The fastest lever to improve it? Data quality. Bad emails kill your denominator before a single prospect reads your pitch.
Why This Metric Matters in 2026
Customer acquisition costs rose 40-60% between 2023 and 2025, driven by competition, privacy regulations, and attribution fragmentation. B2B ad spending exceeded $20B in 2025 alone. Meanwhile, Gartner predicts that by 2027, 95% of seller research will begin with AI - up from 20% in 2024.
When costs climb and buyer behavior shifts this fast, the teams that win aren't spending more. They're converting a higher percentage of the pipeline they already have. That's why your lead-to-client conversion rate - not acquisition cost - is the metric to obsess over right now.
What Is Client Acquisition Rate?
A lot of articles ranking for this term actually explain customer acquisition cost. Let's clear up the confusion.
This phrase gets used two ways in practice. Your VP of Sales says "our acquisition rate dropped" and means the team closed fewer new logos. Your marketing lead hears the same phrase and thinks the lead-to-client conversion percentage fell. Both are valid, but they require different fixes.
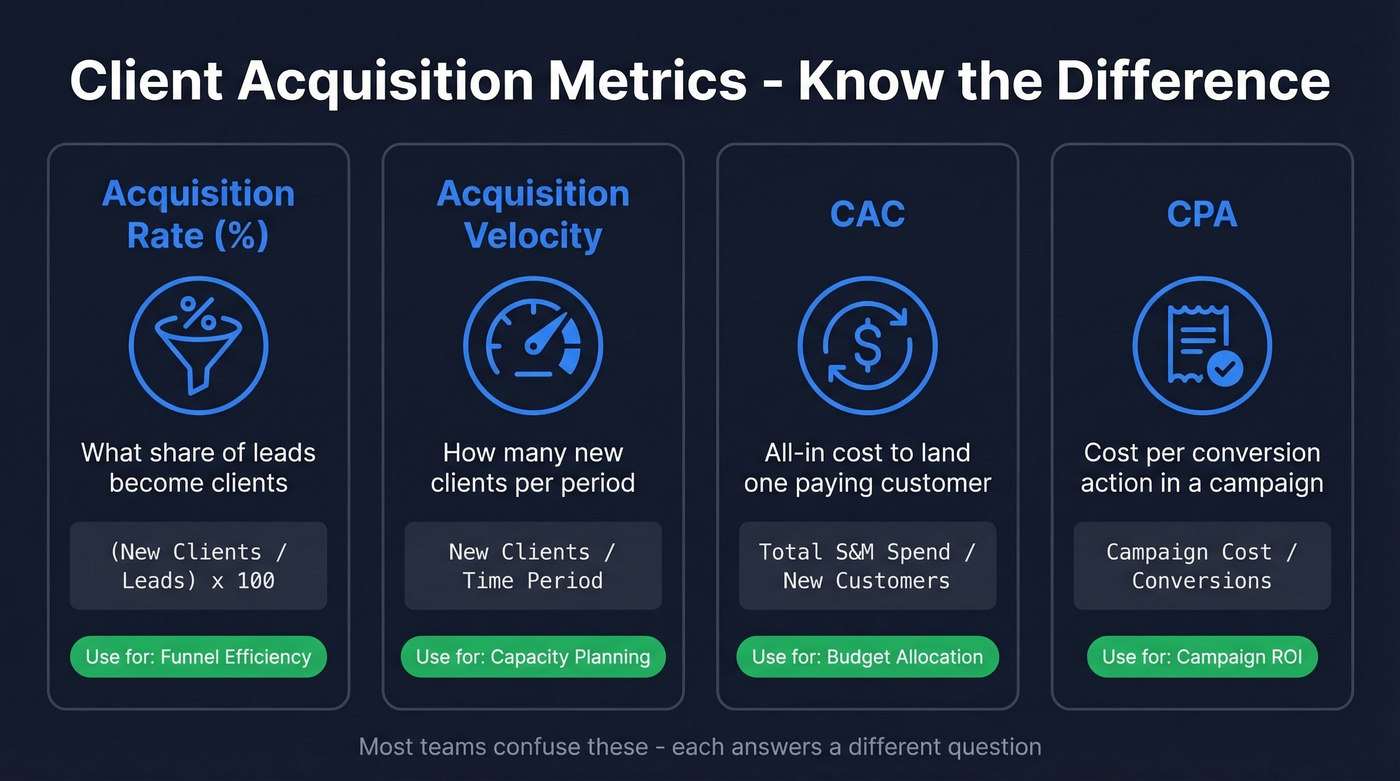
Conversion percentage measures what share of your leads become paying clients. Five hundred leads, 15 closed retainers - that's a 3% rate. This is the definition most teams mean, and it's the one you can benchmark against peers.
Velocity measures throughput: how many new clients you acquire per period. "We signed 8 new clients in October" is a velocity statement, useful for capacity planning and quota-setting but not for diagnosing funnel health.
There are plenty of practitioner threads about "new customer acquisition rate," and the biggest takeaway is that people often mean different things by the same phrase. For the rest of this article, we're focused on conversion percentage.
| Metric | What It Measures | Formula | When to Use |
|---|---|---|---|
| Acquisition Rate (%) | Lead-to-client conversion | (New Clients / Leads) x 100 | Funnel efficiency |
| Acquisition Velocity | New clients per period | New Clients / Time Period | Capacity planning |
| CAC | Cost per new customer | Total S&M Spend / New Customers | Budget allocation |
| CPA | Cost per conversion action | Campaign Cost / Conversions | Campaign-level ROI |
The distinction between CPA and CAC matters too. CPA is tactical - what did this campaign cost per lead? CAC is strategic - what does it cost, all-in, to land a paying customer? Neither tells you if your process actually works. That's what acquisition rate is for.
Customer Acquisition Rate Formula
Client Acquisition Rate (%) = (New Clients / Total Leads) x 100
Simple in theory. The details of what counts as a "lead" and a "new client" make or break its usefulness.
Scenario 1 - Agency. Last quarter, 500 leads came through your website, referrals, and outbound. Your team closed 15 retainer clients. Rate: (15 / 500) x 100 = 3.0%. Right at the industry average.
Scenario 2 - SaaS. Your product had 2,000 free trial signups last month. 160 converted to paid plans. Rate: (160 / 2,000) x 100 = 8.0%. For trial-to-paid, that's solid - the typical B2B SaaS range runs 8-20%.

The denominator is where most teams get into trouble. If 28% of your outbound emails bounce, those aren't real leads - they're noise inflating your denominator and making your rate look worse than it is. (If you want to go deeper on this, see email bounce rate and the full email deliverability breakdown.)
You read it above: if 28% of your outbound emails bounce, your denominator is inflated and your acquisition rate looks worse than it is. Prospeo's 98% email accuracy and 7-day data refresh eliminate dead contacts before they tank your conversion metrics. At $0.01 per email, cleaning your funnel costs less than one bad meeting.
Stop measuring conversion rates against a list full of ghosts.
Benchmarks by Industry
Top-of-Funnel Conversion
Ruler Analytics analyzed over 100 million data points across 14 industries and found an average conversion rate of 2.9%, where "conversion" is defined as a qualified lead.
DashThis frames a "good" new customer acquisition rate benchmark as 5-10% on average, with 20%+ marking excellent performance. In our experience, the gap between those numbers comes down to how "lead" is defined - visitor-to-form-fill versus visitor-to-qualified-conversation are very different bars.
B2B benchmarks by vertical:
| Industry | Visitor to Lead | SQL to Opp | Opp to Won |
|---|---|---|---|
| Professional Services | 1-3% | 30-50% | 25-40% |
| B2B SaaS | 0.8-2.5% | 30-50% | 20-35% |
| Industrial Manufacturing | 0.7-2.0% | 35-55% | 25-45% |
If you're above 3% at top-of-funnel, you're outperforming most peers. Above 5% is elite territory.
Stage-by-Stage Pipeline
First Page Sage's funnel report, built from anonymized client data spanning 2017-2025, gives the most granular view we've found:
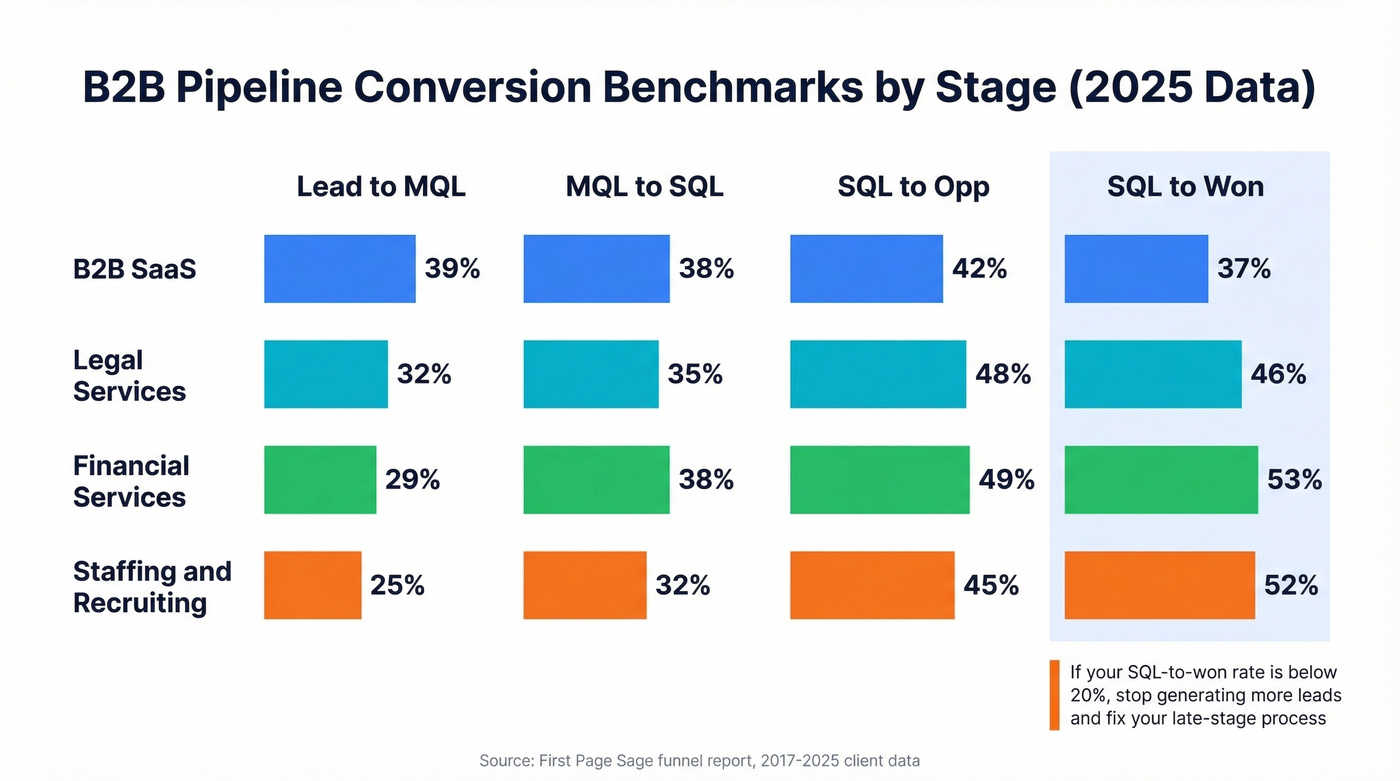
| Industry | Lead to MQL | MQL to SQL | SQL to Opp | SQL to Won |
|---|---|---|---|---|
| B2B SaaS | 39% | 38% | 42% | 37% |
| Legal Services | 32% | 35% | 48% | 46% |
| Financial Services | 29% | 38% | 49% | 53% |
| Staffing & Recruiting | 25% | 32% | 45% | 52% |
Financial services and staffing show the highest SQL-to-won rates at 53% and 52%. B2B SaaS, with its longer evaluation cycles and committee buying, lands at 37%.
Here's the thing: if your SQL-to-won rate is below 20% in any vertical, stop generating more leads and fix your late-stage process. More volume won't save a broken close.
Agency Throughput
A Databox survey of 87 marketing agencies found the median agency closes deals in about 49 days and creates 21 new deals per reporting period. Top performers close in 25 days and create 83 deals - roughly 4x the median. We've seen this pattern repeatedly: the gap between average and excellent is almost entirely explained by process discipline and data quality, not talent or budget.
What Influences Your Rate
Five factors drive most of the variance.
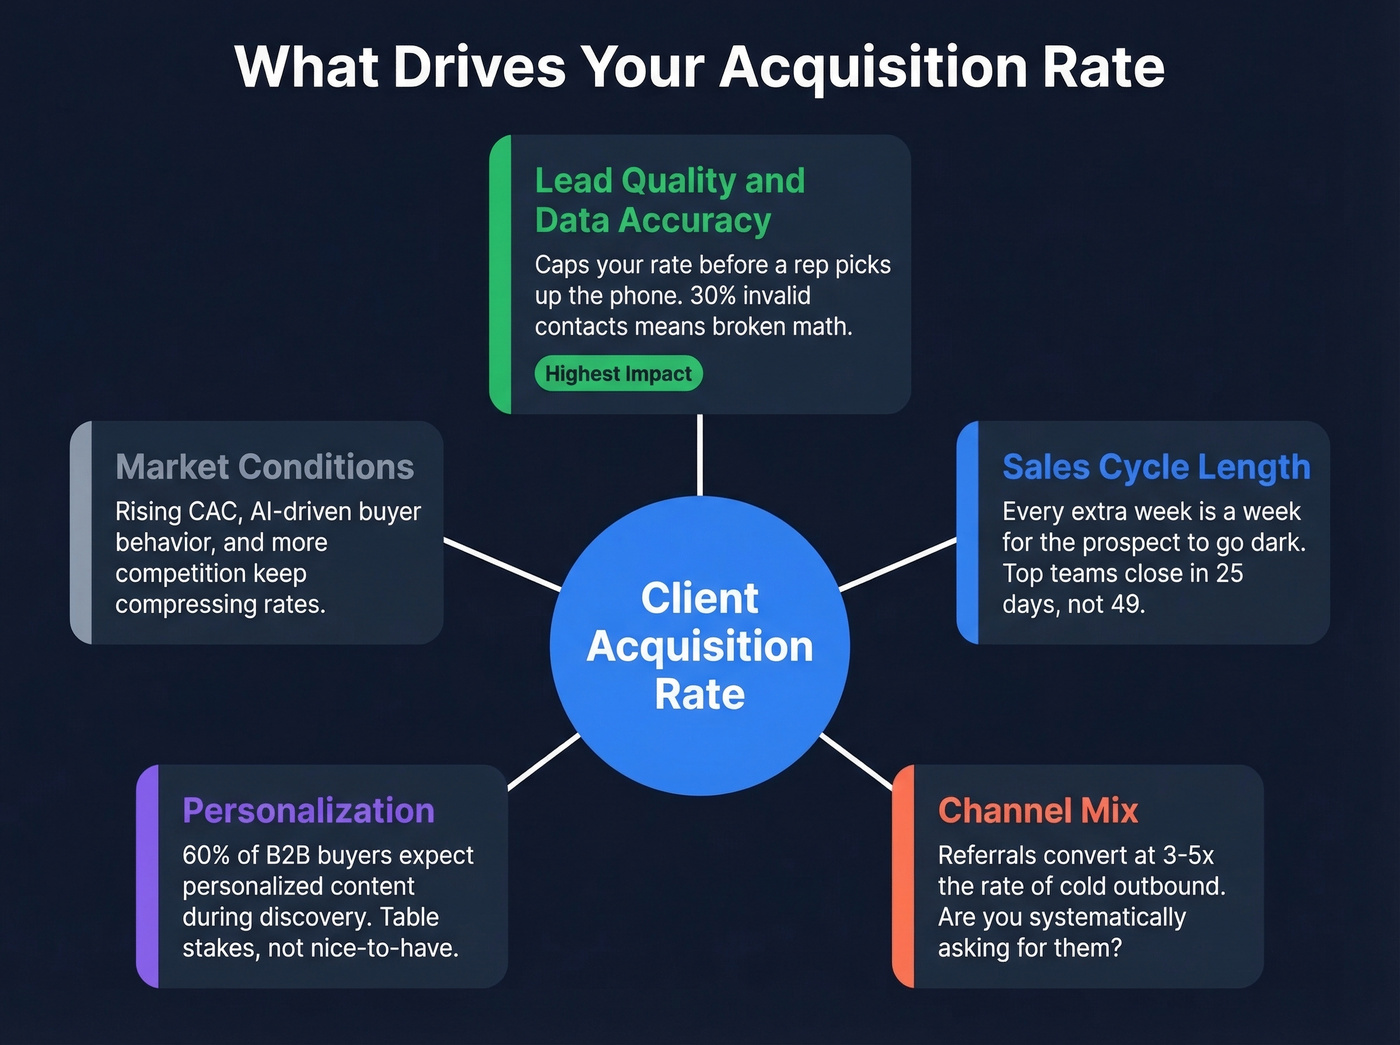
Lead quality and data accuracy cap your rate before a rep picks up the phone. If 30% of your contact list is invalid, no amount of sales coaching fixes the math. Sales cycle length compounds the problem - every extra week in the cycle is a week for the prospect to go dark.
Channel mix matters enormously. Referrals convert at 3-5x the rate of cold outbound. If you're not systematically asking for them, you're leaving the easiest wins on the table.
Personalization has shifted from nice-to-have to table stakes. According to Forrester research cited by Fast Company, nearly 60% of B2B buyers expect personalized content during discovery. And market conditions - rising CAC, AI-driven buyer behavior, increased competition - keep compressing rates, making process optimization non-negotiable. Teams that treat conversion percentage as a core KPI rather than an afterthought consistently outperform those who only track spend.
How to Improve Client Acquisition Rate
Six levers, ranked by impact.
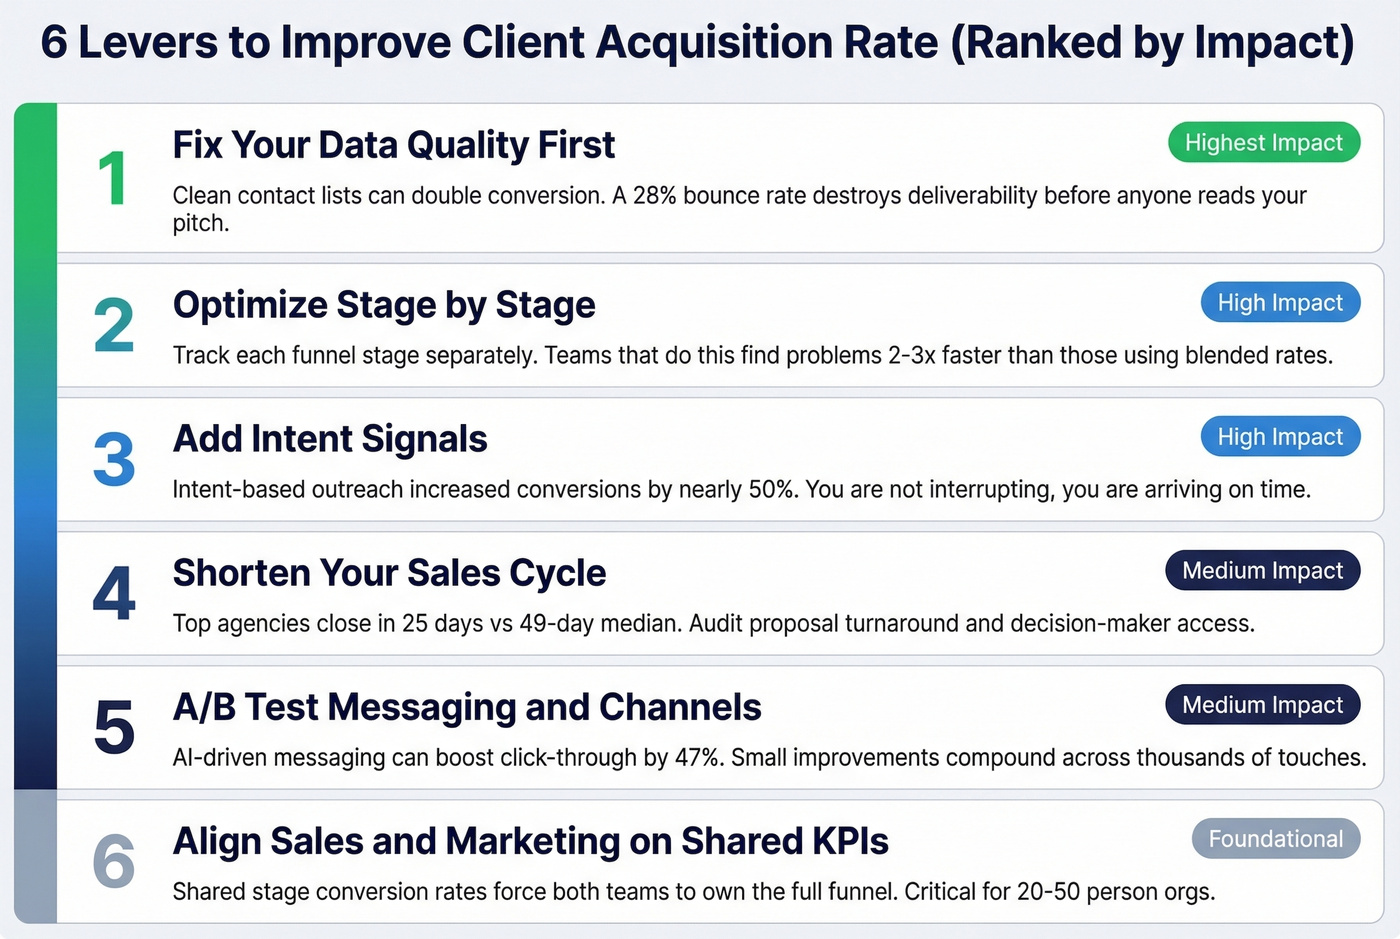
1. Fix your data quality first
You send 500 outbound emails. 140 bounce. Of the 360 that land, 12 reply. Three take a discovery call. One closes. Your rate looks like 0.2%, but the real problem was the 28% bounce rate that destroyed your deliverability and tanked your sender reputation.
We've seen teams double their conversion numbers just by cleaning their contact lists. When Meritt switched to Prospeo's email verification - which runs at 98% accuracy on a 7-day refresh cycle - their bounce rate dropped from 35% to under 4% and pipeline tripled. (If you're building lists at scale, data enrichment services and lead enrichment can also lift match rates and routing.)
2. Optimize stage by stage
Don't try to fix "conversion" as a monolith. If your lead-to-MQL rate is 39% but MQL-to-SQL drops to 15%, the problem is qualification criteria or SDR follow-up - not top-of-funnel volume. In our experience, teams that track stage-by-stage conversion rather than a single blended rate find problems 2-3x faster. (A simple B2B sales funnel template helps teams standardize stage definitions fast.)
3. Add intent signals
Adding intent-based calling increased conversions by almost 50% in Belkins' B2B campaigns. You're not interrupting - you're arriving on time. If you want a practical framework for operationalizing this, start with identifying buying signals.
4. Shorten your sales cycle
Top agencies close in 25 days versus a 49-day median. Audit your proposal turnaround, follow-up cadence, and decision-maker access. Every day you shave off the cycle is a day fewer for the deal to die. Tightening your sales follow-up system is usually the quickest win.
5. A/B test messaging and channels
AI-driven messaging can boost click-through rates by 47%. But you don't need AI to start - test subject lines, value props, and CTA placement. Small improvements compound across thousands of touches. Use a swipe file of email subject line examples to speed up iteration.
6. Align sales and marketing on shared KPIs
When marketing optimizes for MQLs and sales optimizes for closed-won, nobody optimizes for the handoff. Shared stage conversion rates force both teams to own the full funnel. Skip this if your team is under 5 people - at that size, alignment happens naturally. It's the 20-50 person orgs where this kills deals silently.
Let's be honest about one more thing: if your deals average under $15K, you probably don't need a complex multi-touch attribution model. You need clean data, fast follow-up, and a shorter sales cycle. Complexity is the enemy of conversion at that price point.
The benchmarks above show SQL-to-won rates topping out at 53%. The teams hitting those numbers aren't outspending you - they're reaching real buyers with verified contact data. Prospeo gives you 300M+ profiles with 30+ filters including buyer intent, job changes, and headcount growth so every lead in your denominator actually has a pulse.
Convert more of the pipeline you already have - start with better data.
Acquisition Rate vs. Related Metrics
| Metric | What It Answers | When to Track |
|---|---|---|
| CAC | How much does a client cost? | Budget planning |
| CPA | How much did this campaign cost per action? | Campaign optimization |
| CLV / LTV | How much is a client worth over time? | Retention strategy |
| Churn Rate | How fast are you losing clients? | Customer success |
| LTV:CAC Ratio | Is acquisition profitable? | Unit economics |
Acquisition rate tells you if your process works. CAC tells you if your budget works. Fix the process first - a 50% improvement in conversion rate cuts your effective CAC in half without spending an extra dollar. (For a broader KPI set, track funnel metrics and overall pipeline health.)
FAQ
What is a good client acquisition rate?
Top-of-funnel, 2.9% is the cross-industry average for qualified lead conversion; above 5% is elite. For SQL-to-won in professional services, 25-40% is solid. Compare against your own historical trend first, then benchmark against your vertical using the tables above.
How is acquisition rate different from CAC?
Acquisition rate measures the percentage of leads that become paying clients; CAC measures the total sales and marketing cost to win each one. You can have a healthy 8% conversion rate but unsustainable CAC if your spend per lead is too high - track both together.
What is the customer acquisition rate formula?
(New Clients / Total Leads) x 100. The tricky part isn't the math - it's defining your denominator consistently. Count the same type of lead each period so the metric stays comparable over time.
How can I improve my rate without increasing spend?
Start with data quality - verified emails reduce bounces and protect deliverability. Tools like Prospeo and NeverBounce can cut bounce rates below 4%. Then find your leakiest funnel stage and fix it. Process fixes beat budget increases every time.