Email Engagement: What to Measure, What to Ignore, and What Actually Works in 2026
392.5 billion emails get sent every single day. Your prospects aren't ignoring email - they're buried in it. The gap between strong email engagement and getting deleted without a glance comes down to real interaction: clicks, replies, conversions, and the sender reputation that makes all of it possible. Not vanity metrics. Not open rates inflated by Apple's privacy bots.
What Email Engagement Actually Means Now
Email engagement measures whether recipients interact with your emails in meaningful ways - clicking links, replying, converting, forwarding. It used to mean "did they open it?" That definition died in 2021 when Apple Mail Privacy Protection started generating fake opens at scale.
Today, 73% of consumers receive more than 10 emails per day, and over 75% still prefer email for brand communications. The channel isn't dying. It's just noisier. The teams winning at this have shifted their entire measurement framework away from opens and toward click-based and conversion-based metrics. Everything in this article flows from that shift.
The Short Version
Verify your data. Bad emails bounce, bounces tank reputation, and a damaged reputation means even your good emails land in spam. (If you need a deeper framework, start with an email deliverability audit.)
Segment your list. Segmented campaigns deliver 30% more opens and 50% more clicks than batch-and-blast sends.
Automate key sequences. Automated emails generate 41% of total email revenue from just 2% of send volume. That's not a rounding error - it's the whole game.
Optimize for clicks, not opens. Open rates are broken. Clicks are the metric that actually correlates with revenue. (If you want to standardize reporting, use a consistent click rate formula.)
Re-engage or sunset inactive contacts. Dead weight on your list actively hurts deliverability for everyone else on it.
Metrics That Actually Matter
Open rates used to be the default. They're not anymore. After Apple Mail Privacy Protection started generating machine opens in 2021, open rates became what Braze accurately calls "pixel loads" - not true human interaction. Building strategy around opens is like navigating with a broken compass.
If you're still tracking opens for context, it helps to understand how an email tracking pixel works under the hood.
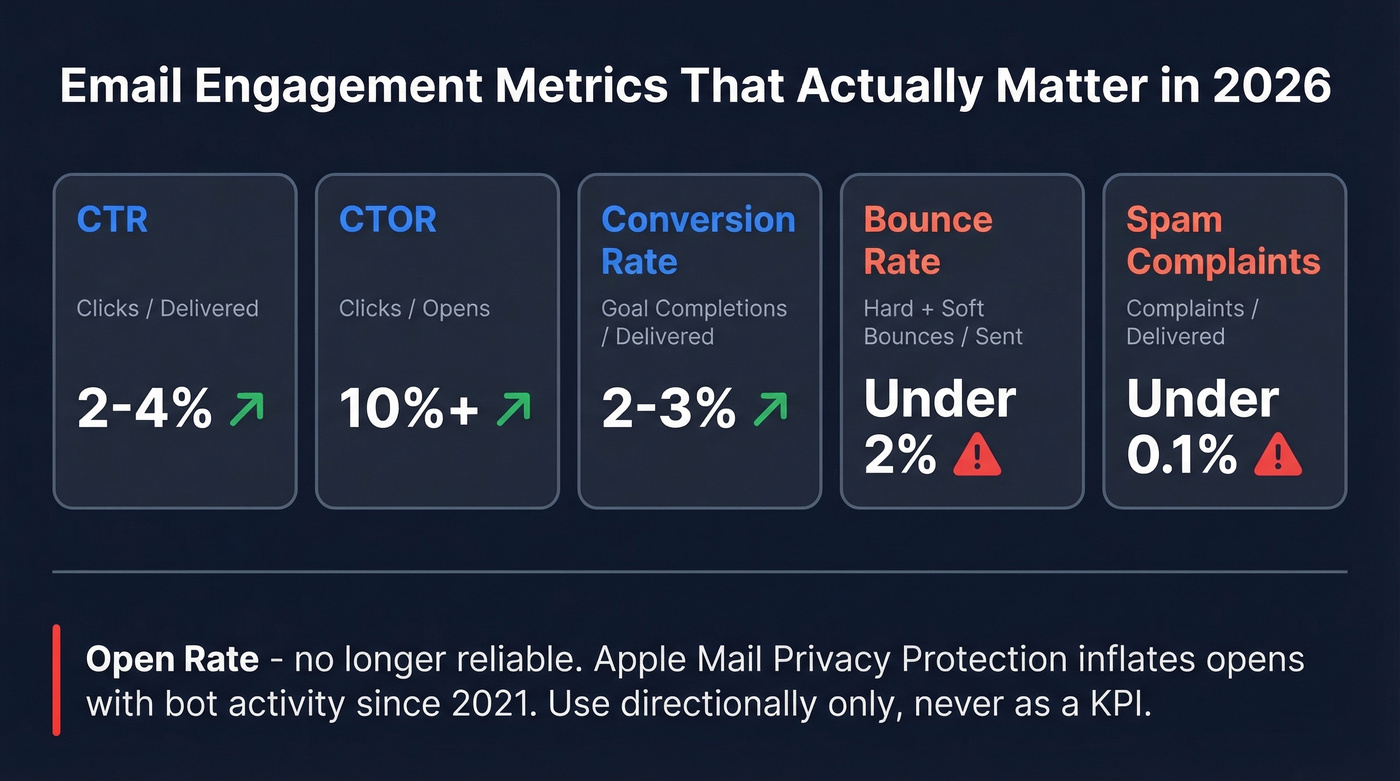
| Metric | What It Tells You | Healthy Range |
|---|---|---|
| CTR | Clicks / delivered | 2-4% |
| CTOR | Clicks / opens | 10%+ |
| Conversion rate | Goal completions / delivered | 2-3% |
| Bounce rate | Hard + soft bounces / sent | Under 2% |
| Spam complaints | Complaints / delivered | Under 0.1% |
Some platforms also track read time and skim/glance behavior - worth monitoring if your ESP supports it. Open rates? Glance at them directionally. They belong nowhere near your KPI dashboard.
If your dashboards still lead with open rate, you're optimizing for the wrong signal.
Why Open Rates Are Broken
Apple Mail Privacy Protection launched in September 2021. It masks IP addresses and pre-fetches email content - including tracking pixels - whether the recipient actually opens the email or not. The result: inflated open rates that don't reflect real human behavior.
iOS 18 made it worse. Apple Intelligence summaries can preview email content before a user opens it, inbox categories sort promotional emails out of the primary view, and Link Tracking Protection strips tracking parameters from links in Mail and Safari, complicating attribution even when someone does click.
A large share of B2C lists - 30-50% or more - run through Apple Mail. For B2B, the number is lower but still significant, especially among executive audiences using iPhones. The net effect: open rates are materially inflated across every industry, and the inflation isn't consistent enough to adjust for.
Subject lines still matter. AI summaries can override your preheader text, so the subject line is often the only copy you control in the inbox preview. Write preheader text that complements the subject line for non-Apple clients, but measure success by whether someone clicked, not whether they "opened." (If you need fresh ideas, pull from proven email subject line examples.)
You just read that bounce rates above 2% suppress every other metric. Prospeo's 5-step email verification delivers 98% accuracy - cutting bounces below 4% for teams that previously sat at 35-40%. Your engagement metrics can't improve if your emails never reach the inbox.
Stop optimizing subject lines on a list full of dead emails.
2026 Benchmarks by Industry
Benchmarks are guardrails, not gospel. We've cross-referenced data from Designmodo and Moosend, averaging figures from Mailchimp, Campaign Monitor, Klaviyo, and others:
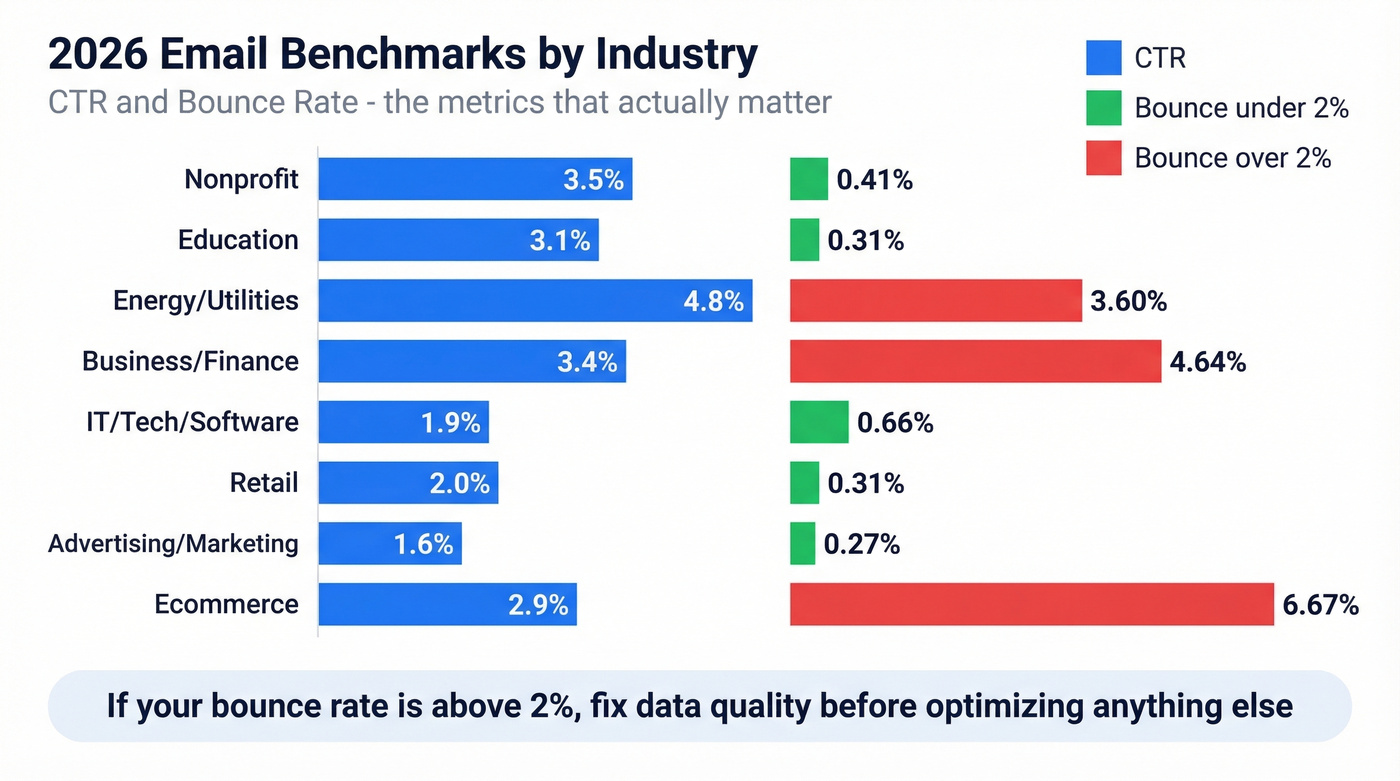
| Industry | Open Rate* | CTR | CTOR | Bounce |
|---|---|---|---|---|
| Nonprofit | ~40% | 3.5% | 10%+ | 0.41% |
| Education | ~36% | 3.1% | 10%+ | 0.31% |
| Energy/Utilities | ~34% | 4.8% | 12.9% | 3.60% |
| Business/Finance | ~33% | 3.4% | 10.2% | 4.64% |
| IT/Tech/Software | ~31% | 1.9% | 8-10% | 0.66% |
| Retail | ~29% | 2.0% | 8-10% | 0.31% |
| Advertising/Marketing | ~29% | 1.6% | 10-13% | 0.27% |
| Ecommerce | ~26% | 2.9% | 10.6% | 6.67% |
*Open rates are MPP-inflated. Treat as directional only.
Regionally, North America averages 23.53% opens and 3.86% CTR per GetResponse data. The key takeaway: if your bounce rate is above 2%, you have a data quality problem that's suppressing everything else. Fix that before worrying about subject line optimization. (For bounce codes, benchmarks, and fixes, see email bounce rate.)
The Deliverability Feedback Loop
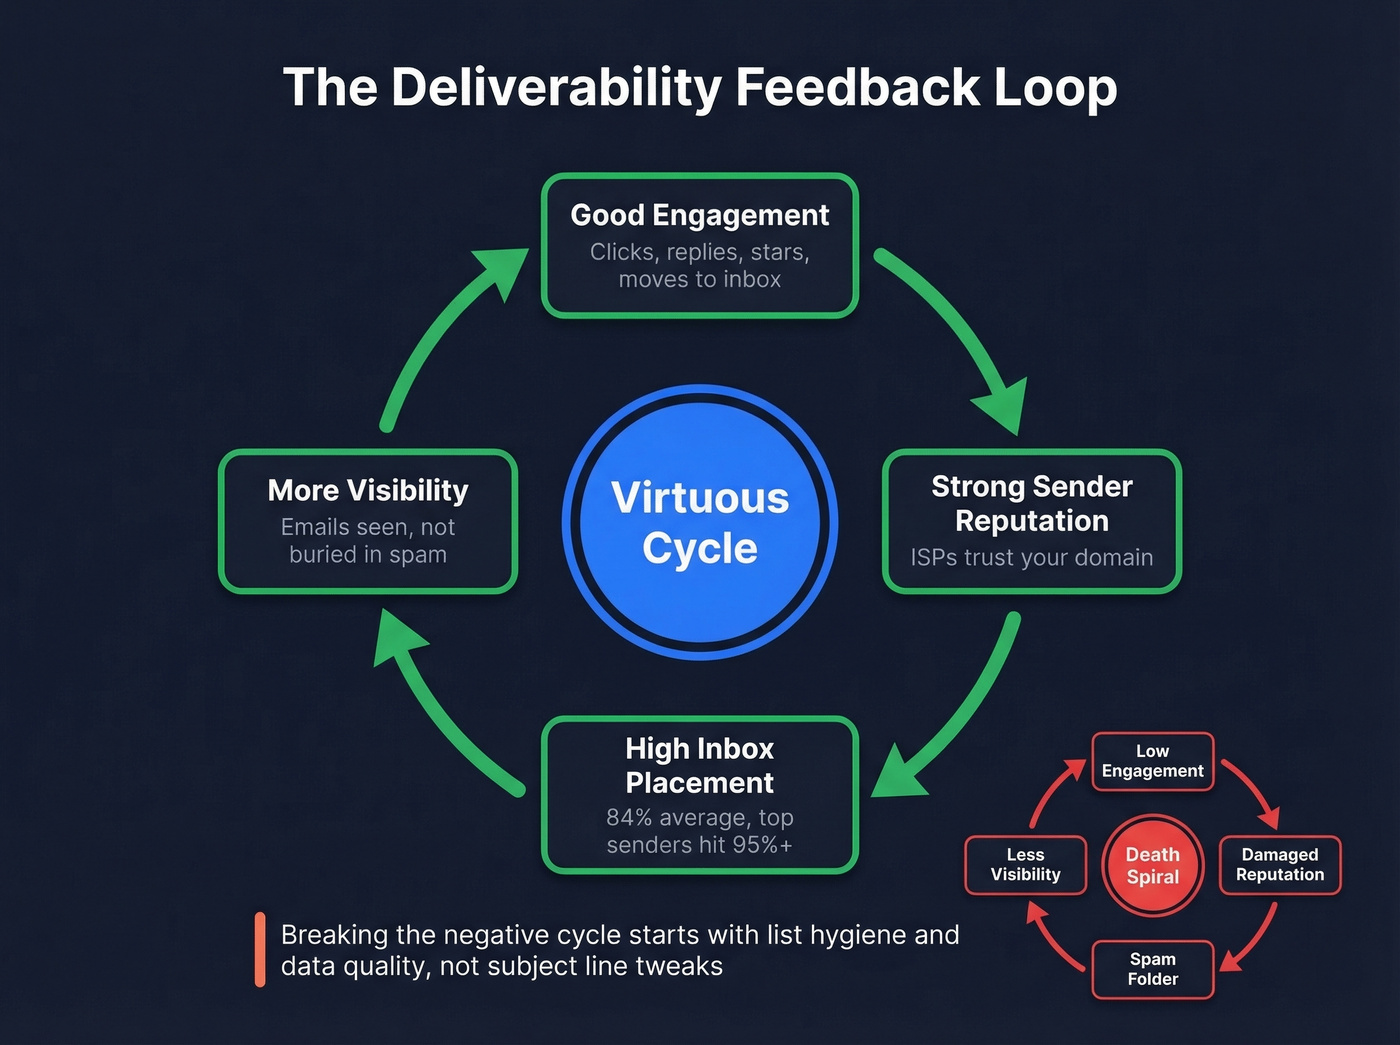
Most teams treat engagement and deliverability as separate problems. They're the same problem.
Delivery means the receiving server accepted your email - no bounce. Deliverability means it actually reached the inbox, not the spam folder or the void. You can have 98% delivery and 70% inbox placement. That gap is where campaigns go to die.
Average inbox placement sits at 84%. That means 16.9% of emails never reach the inbox, and 10.5% land in spam. Litmus found that 70% of emails show at least one spam-related issue. Outlook and Office 365 can be especially punishing for bulk senders - some see inbox placement below 30%.
ISPs like Gmail and Yahoo use engagement signals to decide where your emails land. Positive signals include replies, starring, moving emails to inbox from spam, and consistent clicks. Negative signals - deletes-without-reading, spam complaints, low interaction over time - do the opposite. Gmail and Yahoo's 2024 DMARC enforcement raised the bar further. SPF, DKIM, and DMARC are table stakes now. BIMI is an emerging trust signal worth implementing as VMC/CMC requirements have loosened. (If you're tightening authentication, start with DMARC alignment and a clean SPF record.)
Low engagement damages sender reputation, which pushes more emails to spam, which drives even lower engagement. Breaking the cycle requires fixing data quality and list hygiene first, then optimizing content and targeting. (For a step-by-step plan, see how to improve sender reputation.)
What Drives Opens, Clicks, and Deletes
A Mailjet survey of 2,000+ consumers across the US, UK, France, Germany, and Spain reveals what actually drives behavior. The single most important factor? 94.5% say recognizing the brand or sender name determines whether they open. About 80% want content personalized to their interests, and roughly the same percentage want to see an offer in the subject line. Only about 60% care about seeing their name - making first-name personalization the least important factor tested.
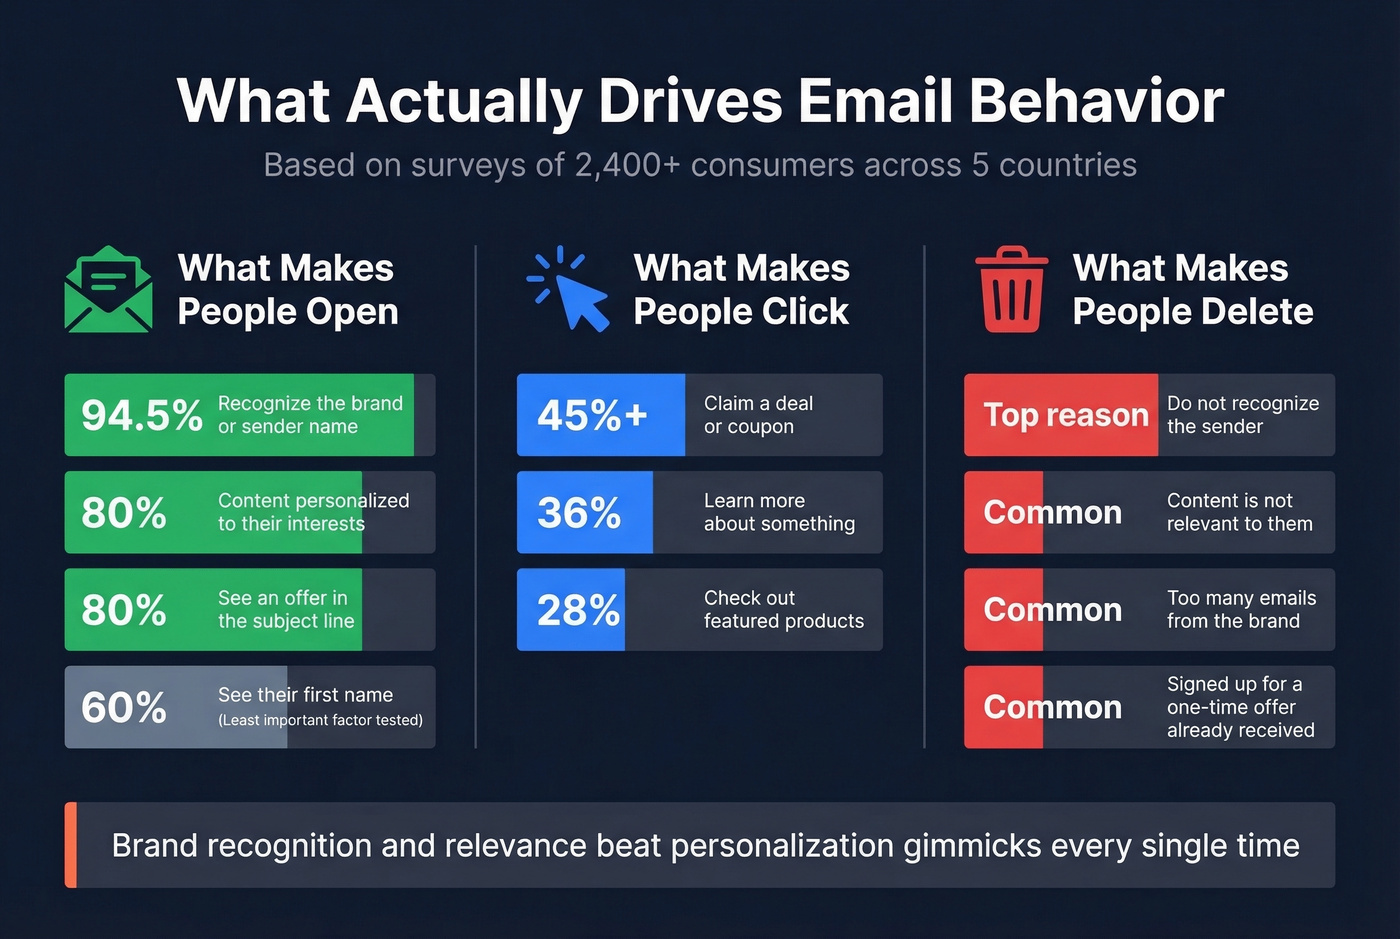
What makes someone click: over 45% click to claim a deal or coupon, 36% click to learn more about something, and 28% click to check out featured products.
Campaign Monitor's survey of 400+ people adds the flip side. The top reasons emails go unopened: don't recognize the sender, content isn't relevant, too many emails from the brand, or they signed up for a one-time offer and already got it. Only 31% of people open at least half their emails. Brand recognition and relevance beat personalization gimmicks every time.
9 Tactics That Actually Work
1. Segment Your List
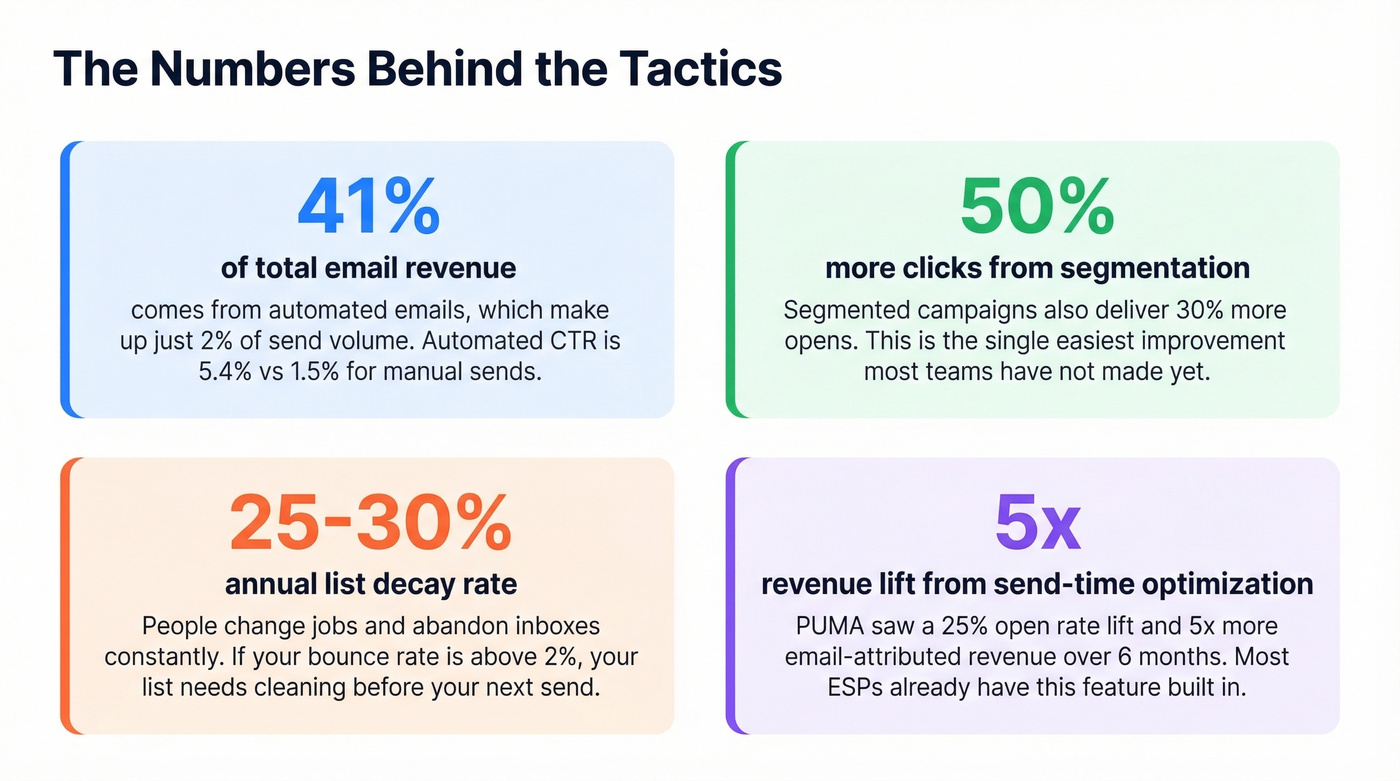
Segmented campaigns deliver 30% more opens and 50% more clicks versus batch-and-blast. At minimum, segment by engagement recency, industry, and buying stage. This is the single easiest improvement most teams haven't made yet. (If you're building targeting rules, intent based segmentation is a strong next step.)
2. Automate High-Value Sequences
Here's a number that should change your priorities: automated emails produce 41% of total email revenue from just 2% of send volume. Automated CTR runs 5.4% versus 1.5% for manual sends. Welcome sequences alone generate four times more opens and ten times more clicks than standard campaigns. If you're not running lifecycle automation, you're leaving the majority of your email revenue on the table. (For outbound sequences, a solid baseline is a B2B cold email sequence.)
3. Optimize for Clicks, Not Opens
Replace open-triggered automation paths with click-based triggers. If your nurture sequence advances when someone "opens" an email, you're advancing Apple's bots through your funnel. Use clicks, site visits, or product actions as progression signals instead.
4. Personalize Beyond First Name
Over 80% of consumers want content personalized to their interests, but only 60% care about seeing their name. Dynamic content blocks based on industry, role, or past behavior outperform merge-tag personalization every time. Personalization is about relevance, not {{first_name}}. (If you're rebuilding messaging, use a personalized outreach framework.)
5. Clean Your List Relentlessly
Bounce rate above 2% is a red flag. Lists degrade 25-30% annually as people change jobs and abandon inboxes. Run your list through a verification tool before every major send - we use Prospeo for this, which catches spam traps and honeypots with 98% accuracy on a 7-day refresh cycle so contacts don't go stale between campaigns. (If you're comparing tools, see Bouncer alternatives.)
6. Test What Drives Clicks
Most teams A/B test subject lines and stop there. That's testing a metric you can't reliably measure anymore. Test CTAs, content block order, link placement, and visual hierarchy instead. CTA design and content relevance affect clicks, which you can actually measure and which correlate with revenue. (If you want a tighter CTA system, use these email call to action rules.)
7. Use Send-Time Optimization
PUMA ran send-time optimization for six months and saw a 25% lift in open rates and a 5x increase in email-attributed revenue. Most ESPs offer STO features now. Turn them on. The lift is real and requires zero creative effort - this is the highest-ROI tactic most teams ignore.
8. Build a Better List Upstream
Your email engagement rate is partly determined before you send a single email. A dataset shared on r/Emailmarketing covering 875 widgets across 214 sites shows a median popup conversion rate of 0.9%, but top performers hit 8.5%+. Better acquisition means more engaged subscribers from day one. (If you're rebuilding acquisition, start with how to generate an email list.)
9. Re-Engage or Sunset
If contacts haven't engaged in 90 days, run a re-engagement sequence: warm nudge, incentive-based win-back, or product update check-in. Nearly half of lapsed customers can be brought back. But if they don't re-engage after two or three attempts, remove them. Skip the sentimentality - dead contacts actively suppress deliverability for everyone else.
Clean Data: The Prerequisite Nobody Talks About
Let's be honest: most email engagement advice is backwards. Teams obsess over subject lines and send times while 5% of their list bounces on every send. That 5% damages sender reputation enough to suppress inbox placement for the other 95%. No amount of copywriting fixes that.
In our experience, teams that fix data quality first see engagement lift across every other metric within two to three sends. Meritt's bounce rate was 35% before they cleaned their data. After switching to verified contacts through Prospeo, it dropped under 4% and their pipeline tripled from $100K to $300K per week. That's not a subject line fix - it's a data quality fix.
For teams chasing better interaction rates on outbound, clean data is the single highest-impact investment you can make.

The deliverability feedback loop is real: bad data tanks reputation, reputation tanks inbox placement, and inbox placement tanks engagement. Prospeo refreshes 300M+ profiles every 7 days - not every 6 weeks like competitors. That means the contacts you emailed last month are still accurate this month.
Break the loop. Start with data that's 7 days fresh, not 7 weeks stale.
FAQ
What's a good email engagement rate?
A CTR of 2-4% is healthy for most industries, and a CTOR above 10% signals strong content relevance. Keep bounce rates under 2% and spam complaints under 0.1%. Benchmark against your vertical - nonprofit CTRs run 3.5% while retail hovers around 2%.
How does engagement affect deliverability?
ISPs like Gmail and Yahoo use clicks, replies, and spam complaints to decide inbox versus spam placement. Low interaction damages sender reputation, pushing more emails to spam and creating a downward spiral. Fixing list hygiene is the fastest way to reverse it.
How often should I clean my email list?
Before every major campaign, and at minimum quarterly. Lists degrade 25-30% annually as contacts change jobs and abandon inboxes. Most verification providers refresh every six weeks, so look for tools with shorter refresh cycles to keep contacts current between cleanings.
What's the difference between delivery rate and deliverability?
Delivery means the receiving server accepted your email - no hard bounce. Deliverability means it reached the inbox rather than spam. You can have 98% delivery and still see 30% of emails land outside the primary inbox, which is why inbox placement is the metric that matters.
Should I still track open rates?
Use them directionally, but never as a primary KPI. Apple Mail Privacy Protection inflates opens by pre-fetching tracking pixels, making the metric unreliable for 30-50%+ of most lists. Click-through rate and conversion rate are the trustworthy alternatives.