Email Open Rate Benchmarks 2026: Why Every Source Gives You a Different Number
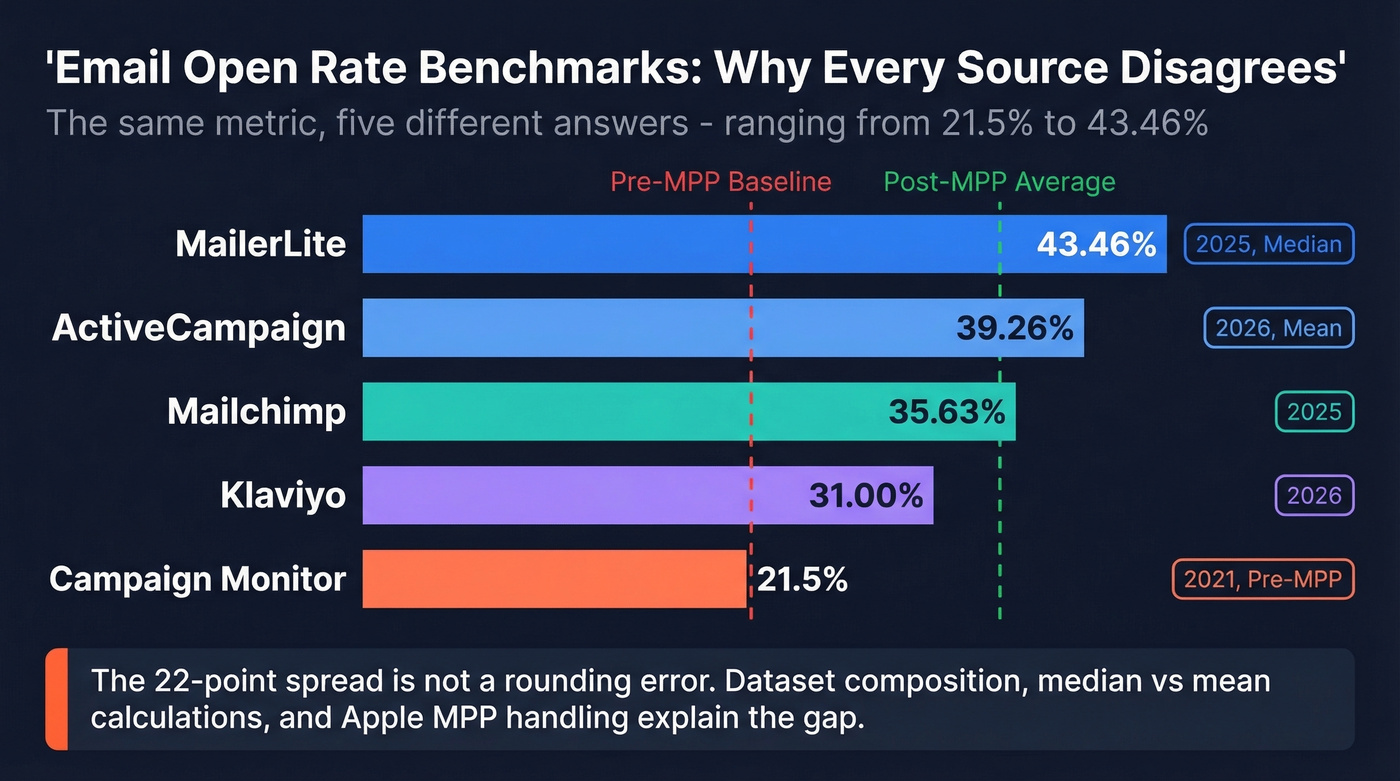
Pull up five benchmark reports right now. You'll get five different "average" open rates - ranging from 21.5% to 43.46%. That's not a rounding error. It's a measurement crisis, and it means most teams comparing their email open rate benchmarks are benchmarking against numbers that don't mean what they think they mean.
The Short Version
- The reported "average" open rate ranges from 21.5% to 43.46% depending on the dataset. The spread is that wide because of methodology differences and Apple MPP inflation.
- Why the numbers disagree: every ESP benchmarks its own customer base. B2B/B2C mix, median vs. mean calculations, and how they handle phantom opens all produce wildly different figures.
- The metric you should actually report: click-to-open rate (CTOR) or raw click rate. These aren't inflated by privacy prefetching.
- The fix most people skip: list hygiene and deliverability. If 8% of your list is bouncing, your open rate problem is actually a data problem.
2026 Benchmarks: The Multi-Source Picture
Here's what you're actually comparing when you search "average open rate." We've laid the numbers side by side so the disagreement is impossible to ignore.
| Source | Year | Avg Open Rate | Click Rate | CTOR |
|---|---|---|---|---|
| MailerLite | 2025 | 43.46% | 2.09% | 6.81% |
| ActiveCampaign | 2026 | 39.26% | 6.21% | - |
| Mailchimp | 2025 | 35.63% | - | - |
| Klaviyo | 2026 | 31.00% | - | - |
| Campaign Monitor | 2021 | 21.5% | 2.3% | 10.5% |
MailerLite's data comes from 3.6 million campaigns across 181K accounts and reports medians, which resist outlier drag. Klaviyo's top 10% of senders hit 45.1%. Campaign Monitor's 2021 figure is the cleanest pre-MPP baseline we have - and it's half of what MailerLite reports four years later.
Three things explain the spread. First, dataset composition - an ESP skewing toward newsletters and nonprofits will report higher opens than one dominated by ecommerce promos. Second, median vs. mean calculations produce different results from identical data. Third, and most importantly, Apple MPP handling. Some ESPs filter phantom opens. Most don't.
The click rates tell the real story. They're far less sensitive to MPP. In older baseline datasets, clicks stay basically flat even when opens jump dramatically.
Here's the thing: if your open rate jumped 15+ points between 2021 and 2024 but your click rate stayed flat, you didn't get better at email. Apple got better at faking opens. Stop celebrating.
Open Rates by Industry
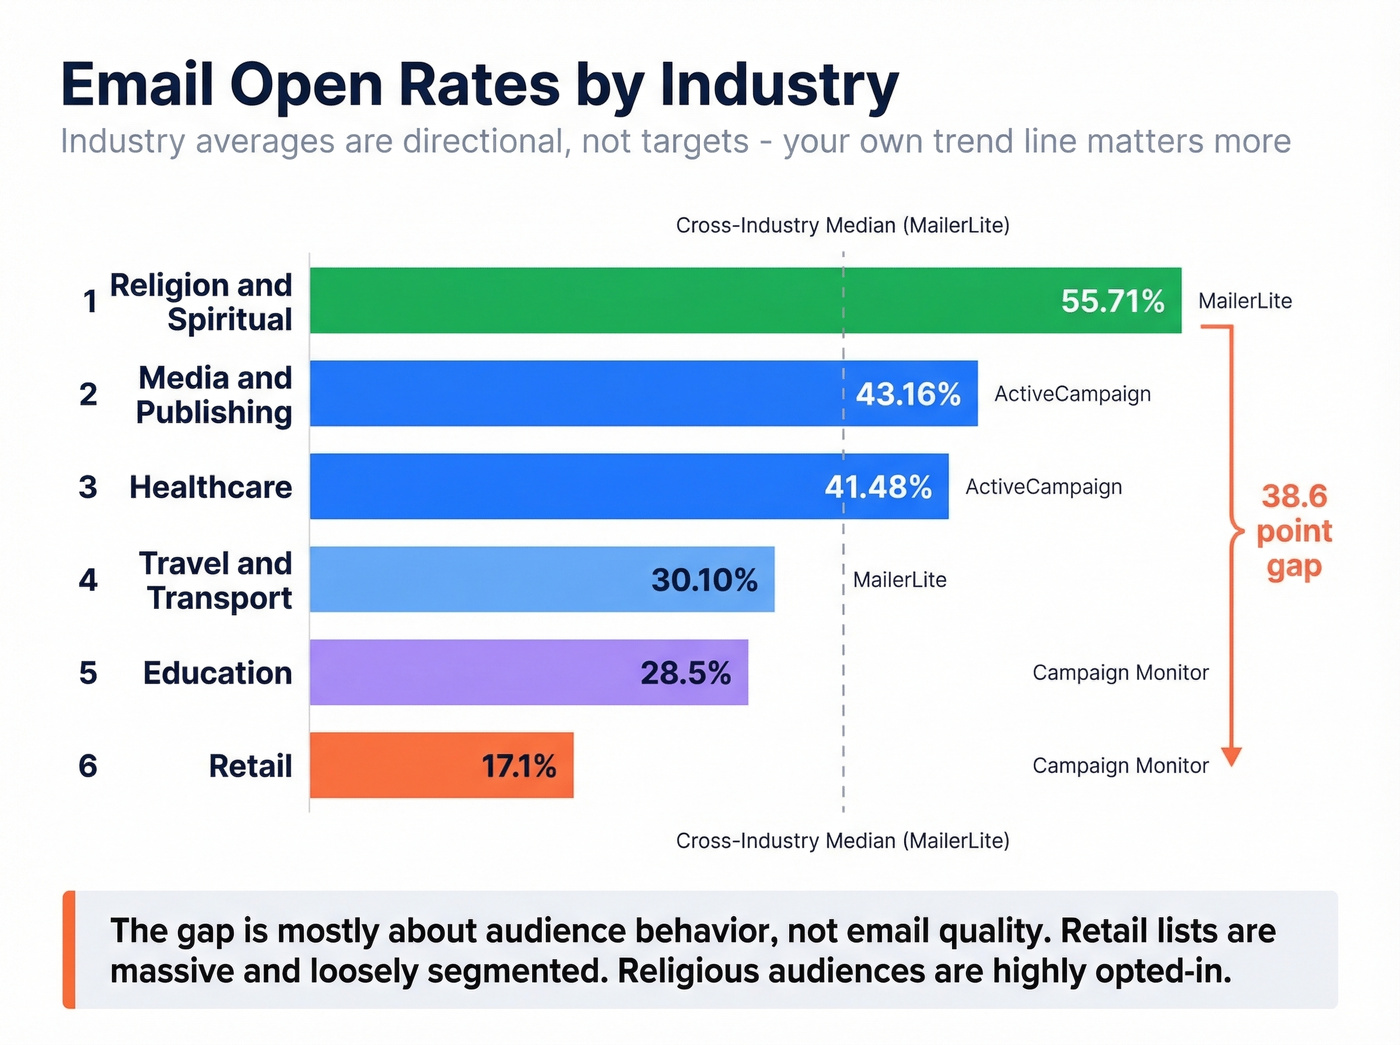
Industry averages are directional, not targets. Your own trend line matters more than whether you're above or below "Religion" at 55.71%.
| Industry | Open Rate | CTR | CTOR | Source |
|---|---|---|---|---|
| Religion/Spiritual | 55.71% | - | - | MailerLite |
| Media/Publishing | 43.16% | 7.32% | - | ActiveCampaign |
| Healthcare | 41.48% | - | - | ActiveCampaign |
| Travel/Transport | 30.10% | - | - | MailerLite |
| Education | 28.5% | 4.4% | 15.7% | Campaign Monitor |
| Retail | 17.1% | 0.7% | 5.8% | Campaign Monitor |
The gap between Religion (55.71%) and Retail (17.1%) is enormous - and it's mostly about audience behavior, not email quality. Nonprofit and religious audiences tend to be highly opted-in and engaged. Retail lists are massive, loosely segmented, and full of people who signed up for a 10% coupon six months ago. In our experience, retail teams comparing against MailerLite's cross-industry median of 43.46% are setting themselves up for disappointment every single time.
For B2B specifically, expect reported opens in the 25-40% range and CTR around 2-4%. B2C ecommerce promos typically run 20-35% opens with 1-3% CTR. No major ESP publishes a clean B2B/B2C split, which is frustrating - but these rough cuts hold up across the data we've seen. Always match your benchmark to your vertical and sending type rather than relying on a cross-industry average.
Automated flows deserve their own mention. Welcome sequences, abandoned cart, browse abandonment - they consistently outperform one-off campaigns by 2-3x on clicks. Klaviyo's benchmarks show automated flow click rates averaging 5.58% across industries vs. 1.69% for campaigns. If you're only benchmarking campaign sends, you're missing your best-performing emails entirely.
The Apple MPP Effect
Your open rate is lying to you.
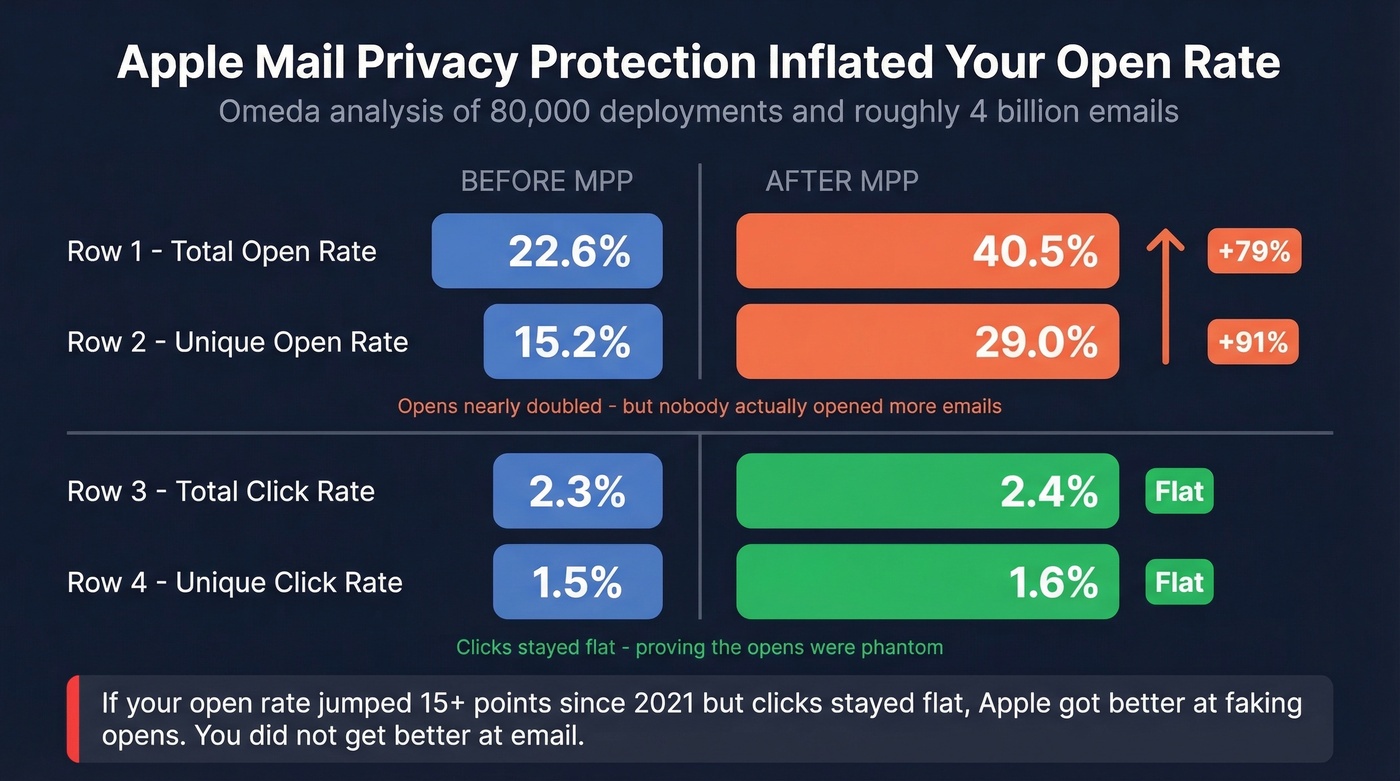
Omeda ran one of the cleanest before/after analyses of Apple Mail Privacy Protection, comparing roughly 80,000 email deployments and ~2 billion emails in each window:
- Total open rate: 22.6% → 40.5% (nearly doubled)
- Unique open rate: 15.2% → 29.0%
- Total click rate: 2.3% → 2.4% (flat)
- Unique click rate: 1.5% → 1.6% (flat)
Opens nearly doubled. Clicks didn't move. That's Apple's mail client prefetching tracking pixels in the background - registering "opens" from people who never saw the email. In consumer-heavy lists, MPP can account for around 49% of tracked opens. The pre-MPP baseline of 25-30% now shows up as 40-45% in your dashboard without any real engagement change.
We've run the numbers on our own sends and the MPP inflation tracks almost exactly with Omeda's findings. Only 15% of email marketers still treat open rates as a primary success metric. The other 85% have moved on.
How to Filter Phantom Opens
You can't eliminate MPP inflation entirely, but three filters reduce the noise.
Honeypot links are invisible links embedded in your emails. Bots and prefetch clients click them; humans don't. Any "open" paired with a honeypot click is fake. Time-to-action flagging catches bot behavior too - if someone "opens" and "clicks" within less than one second, that's not a human. Flag and exclude. User-agent filtering targets known prefetch bots with identifiable strings. Many ESPs started filtering these in late 2025, but check whether yours actually does. Many still don't by default.
Your open rate problem is a data problem. If 8% of your list bounces, MPP inflation is the least of your worries. Prospeo's 5-step email verification delivers 98% accuracy - dropping bounce rates below 4% for teams like Snyk and Meritt.
Stop benchmarking phantom opens. Start sending to verified inboxes.
What to Track Instead
Here's the hierarchy, ranked by how much each metric actually tells you about email performance.
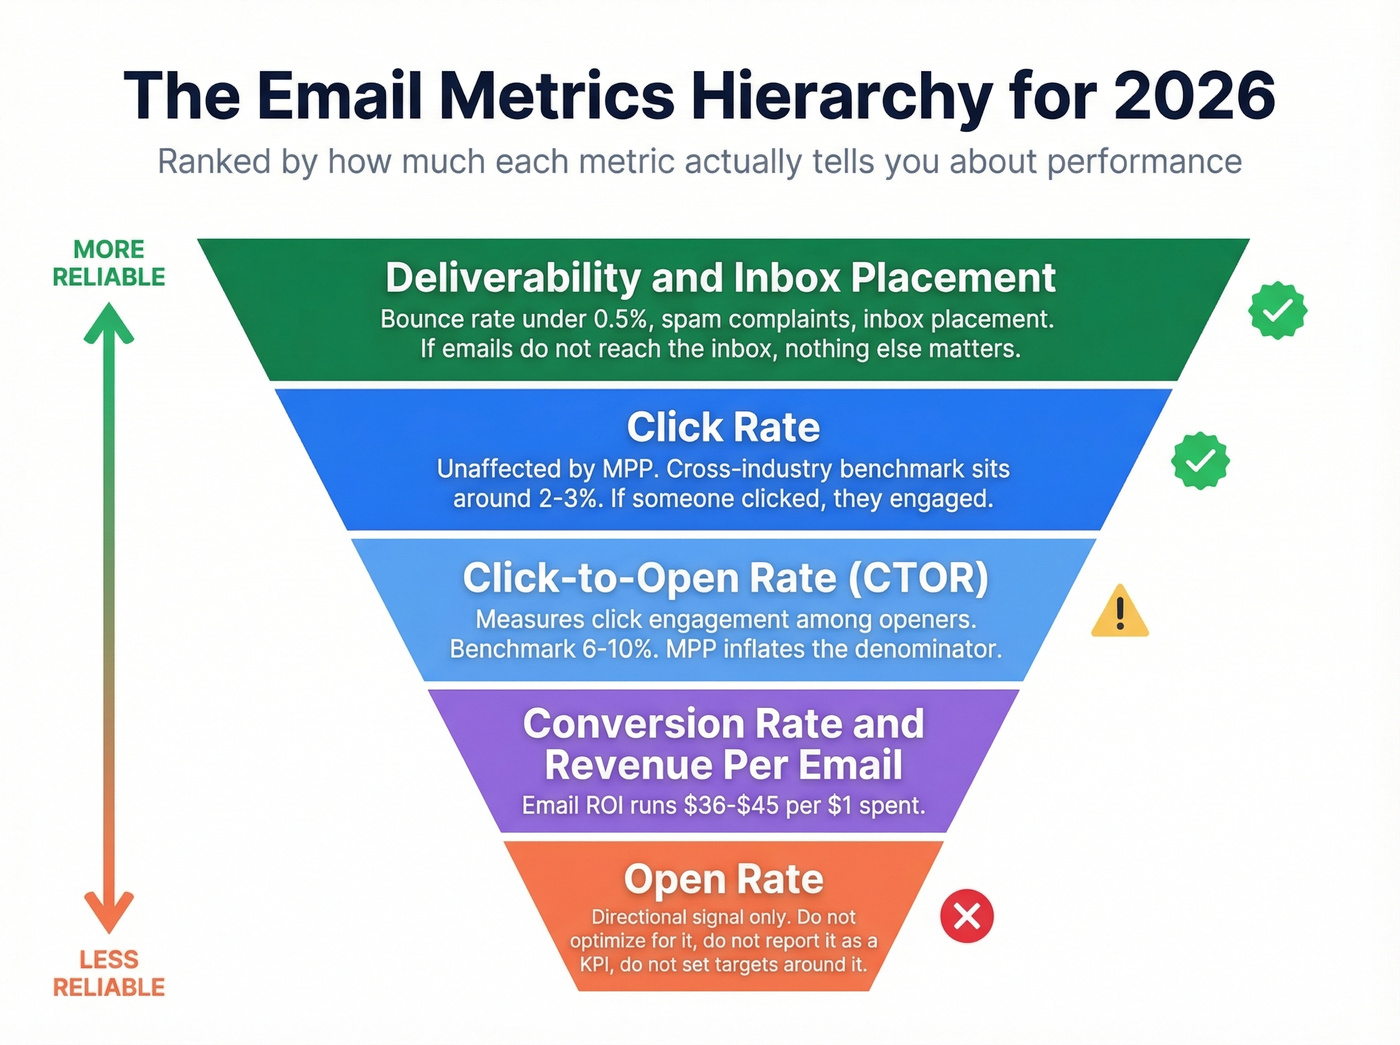
1. Deliverability and inbox placement. If your emails aren't reaching the inbox, nothing else matters. Track bounce rates (benchmark: under 0.5%), spam complaints, and inbox placement rates. MailerLite reports a 0.22% average unsubscribe rate - if yours is significantly higher, your list has a targeting problem. (If you need a baseline, start with bounce rates and a full email deliverability guide.)
2. Click rate. Unaffected by MPP. If someone clicked, they engaged. Period. Cross-industry benchmarks sit in the low single digits, around 2-3%. (If you're standardizing reporting, use a consistent click rate formula.)
3. Click-to-open rate (CTOR). Measures click engagement among openers. MailerLite reports 6.81%; Campaign Monitor reported 10.5% in 2021. The drop isn't because emails got worse - MPP inflated the denominator.
4. Conversion rate and revenue per email. The metric your CFO actually cares about. Email ROI runs $36-$45 per $1 spent - but only if you're tracking it. Most teams aren't.
5. Open rate. Last. Use it as a directional signal for deliverability trends - a sudden drop might mean you've hit a blocklist. But don't optimize for it, don't report it as a KPI, and don't let your CMO set targets around it.
Let's be honest: practitioners on r/Emailmarketing have been asking "how do you measure good email performance in 2026?" for months, and the consensus has shifted hard toward click rate and conversions. Twilio's framework identifies the three most common benchmarking mistakes: over-indexing on opens (which encourages clickbait subject lines), ignoring deliverability (the actual lever), and not tracking conversions (the actual goal). We've seen teams spend months A/B testing subject lines to chase open rates that were 40% phantom anyway.
Cold Email Benchmarks
Most benchmark reports ignore outbound entirely. That's a gap, because cold email operates on completely different rules.
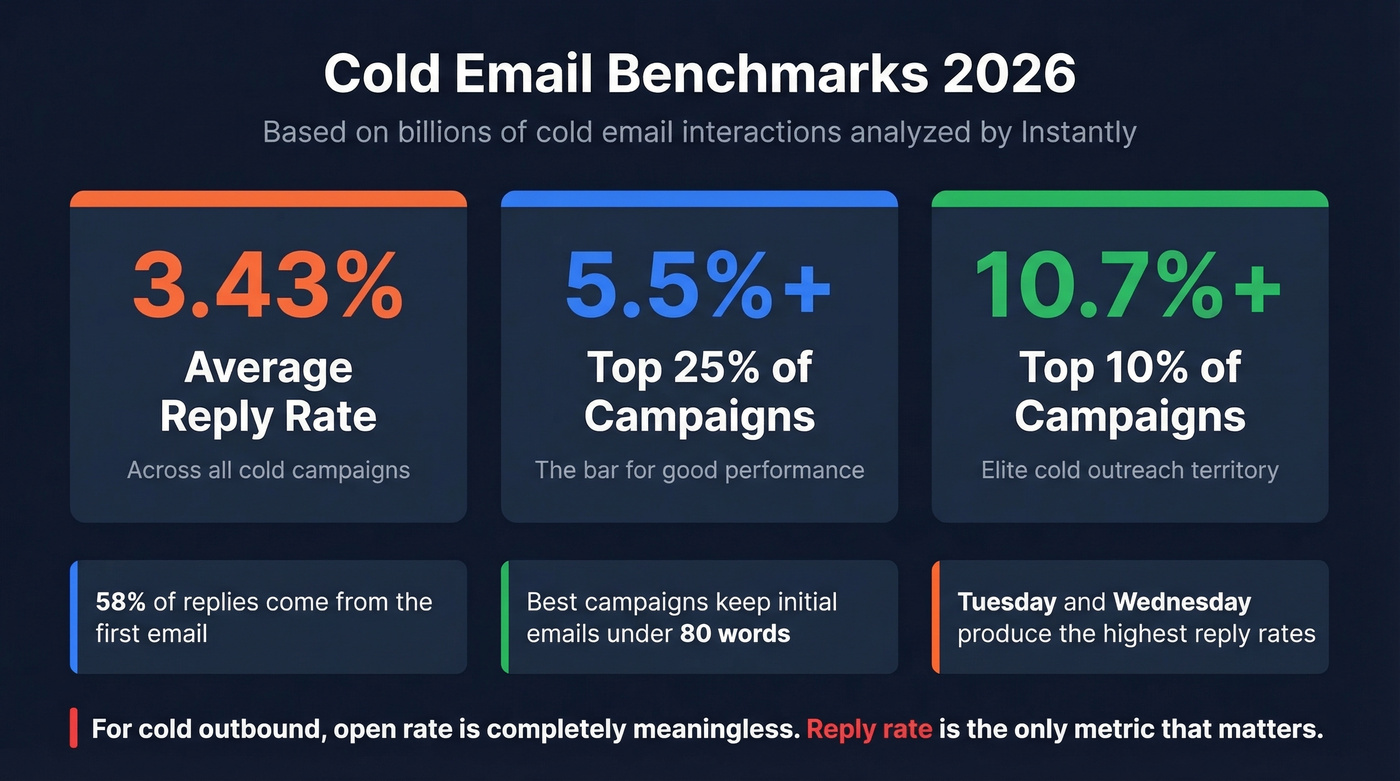
Instantly analyzed billions of cold email interactions and found an average reply rate of 3.43%. The top 10% of campaigns hit 10.7%+, and the top 25% cleared 5.5%+. GMass corroborates with a 1-5% typical range, noting that personalization can more than double reply rates.
For cold outbound, open rate is completely meaningless. Reply rate is the only metric that matters. A few patterns from the Instantly data: 58% of replies come from the first email, the best campaigns keep initial emails under 80 words, and Tuesday through Wednesday consistently produces the highest reply rates. If you're running outbound sequences, stop tracking opens and start tracking replies per send. (If you're rebuilding your outbound, start with a B2B cold email sequence and these cold email follow-up templates.)
Benchmarks by Day and Send Time
Campaign Monitor's data shows Monday pulls the highest open rate at 22.0%, but Tuesday wins on CTR (2.4%) and both Tuesday and Wednesday tie for the highest CTOR at 10.8%. Instantly's cold email data aligns - Tuesday and Wednesday peak for reply rates too, with Wednesday slightly ahead.
These are directional. Your audience's behavior depends on their timezone, role, and industry. The one consistent finding across every source: weekends underperform across the board. Run a 4-week rotation across different days and times, measure click rate (not opens), and let the data decide. (For outbound specifically, see the best time to send cold emails.)
How to Improve Your Numbers
Chasing a higher open rate without fixing the fundamentals is like optimizing a landing page nobody can reach.
Subject Lines and Preheader
Keep subject lines under 50 characters, test curiosity vs. specificity, and never waste the preheader. It's prime real estate that most teams leave as default preview text. (If you need a swipe file, use these email subject line examples and a tighter guide to preview text A/B testing.)
Segmentation
Sending the same email to your entire list is the fastest way to tank engagement. Even basic segmentation - active vs. inactive subscribers - can lift click rates by 30-50%. (If you're formalizing targeting, start with an Ideal Customer Profile and practical intent based segmentation.)
Sender Reputation
SPF, DKIM, and DMARC aren't optional anymore. Gmail and Microsoft are aggressively filtering unauthenticated senders. Fix authentication before touching anything else. (If you're troubleshooting, start with DMARC alignment and how to verify DKIM is working.)
List Hygiene and Verification
This is the upstream fix that most teams skip, and it's the one that matters most. Invalid email addresses cause bounces, bounces damage sender reputation, damaged reputation reduces inbox placement, and lower inbox placement means lower real opens. If your bounce rate is above 3%, your open rate problem is actually a data problem. (If you're auditing, use an email spam checker and a dedicated set of email reputation tools.)
Prospeo's 5-step email verification catches the problems that kill deliverability - catch-all domains, spam traps, honeypot addresses, and dead mailboxes - at 98% accuracy. Records refresh on a 7-day cycle, so you're not verifying against stale data. Snyk cut their bounce rate from 35-40% to under 5% after switching, and their AE-sourced pipeline jumped 180%. Meritt went from a 35% bounce rate to under 4%, tripling their weekly pipeline from $100K to $300K. You can verify 75 emails per month free, no contracts or sales calls required.
Send Timing
Test it. The benchmarks say Tuesday-Wednesday, but your audience might peak on Thursday mornings. MailerLite noted that Gmail's one-click unsubscribe change actually helps here - easier unsubscribes mean disengaged subscribers leave faster, which cleans your list organically.
Skip all of this if your bounce rate is above 5%. None of these optimizations matter until your emails are actually reaching inboxes.
Click rate is the metric that matters - but clicks require real people at real addresses. Prospeo refreshes 300M+ profiles every 7 days, so your list never decays into the bounces and spam traps that tank deliverability.
Clean data at $0.01/email. No contracts, no inflated metrics.
FAQ
What's a good email open rate in 2026?
Most ESPs report roughly 31-43% across broad datasets, but Apple MPP inflates these significantly. A real engaged open rate is likely 20-30%. Track your own trend line month over month rather than chasing a half-artificial industry average.
Why do different sources report different open rate benchmarks?
Each ESP calculates benchmarks from its own customer base. B2B/B2C mix, list hygiene standards, median vs. mean calculations, and MPP handling all produce different numbers from the same time period.
Are email open rates still useful?
Only as a directional signal for deliverability. A sudden drop might indicate a blocklist hit. Click-through rate and CTOR are more reliable since MPP doesn't inflate them.
What's a good cold email reply rate?
The average is about 3.43% according to Instantly's 2026 data. Top 10% of campaigns hit 10.7%+. For cold outbound, reply rate completely replaces open rate as the primary metric.
How does list verification affect open rates?
Invalid emails cause bounces, which damage sender reputation, which reduces inbox placement, which lowers real opens. Keeping bounce rates under 3% with proper verification protects the deliverability that makes everything else possible.