How to Analyze Firmographic Data: The Step-by-Step Playbook Most Teams Skip
Picture a VP of Sales staring at 10,000 accounts in Salesforce, no idea which 200 to prioritize this quarter. That's the norm, not the exception. Most B2B teams don't know how to analyze firmographic data beyond dumping company names and headcounts into a CRM and calling it "segmentation." The result: outbound campaigns that convert at 2%.
The numbers tell the story. Companies that build scoring models around firmographic data see 138% ROI on lead generation - nearly double the 78% ROI of teams that skip scoring. BlueScope Steel ran firmographic segmentation on their customer base and pulled $25 back for every $1 spent on marketing. Yet only 44% of organizations use lead scoring at all. A practitioner test on Reddit showed generic outreach to 500 contacts hit a 2% response rate; personalized outreach to 50 firmographically-researched contacts hit 18%. And with 75% of B2B marketers reporting that buyers are taking longer to commit, spray-and-pray targeting is more expensive than ever.
The gap isn't data. It's analysis.
What You Need (Quick Version)
If you already know what firmographic data is and just want the methodology:
- Audit your CRM data for freshness and completeness - if it's older than 90 days, you're building on sand
- Analyze closed-won deals for firmographic patterns using pivot tables
- Build a weighted ICP scoring model with negative scoring guardrails
- Layer technographic and intent data on top of firmographics
- Automate scoring in your CRM and set a quarterly review cadence
Before You Start - The PMF Check
Firmographic analysis only works if you've got enough signal to analyze. If you're pre-product-market-fit, you don't have enough closed-won data to build meaningful segments.
Kalungi's litmus test is useful here: if roughly 30% or more of your customers came from referrals, you've likely hit PMF. Below that threshold, use psychographic and jobs-to-be-done segmentation instead - firmographic patterns won't be statistically meaningful yet.
One more guardrail: your ICP should fit on a single slide. If you need a 15-page deck to explain who you're targeting, you haven't done the analysis - you've done a data dump.
You just learned that 30% of B2B data decays annually - which means the firmographic segments you build today are already eroding. Prospeo's 7-day refresh cycle keeps your ICP scoring models accurate, not stale. 300M+ profiles enriched with 50+ data points, including revenue, headcount, technographics, and intent signals across 15,000 topics.
Stop scoring leads against data that expired last quarter.
The 12 Firmographic Variables That Actually Matter
Not all firmographic variables carry equal weight. SurveyMonkey's taxonomy breaks them into three tiers, and this framing is the right starting point:
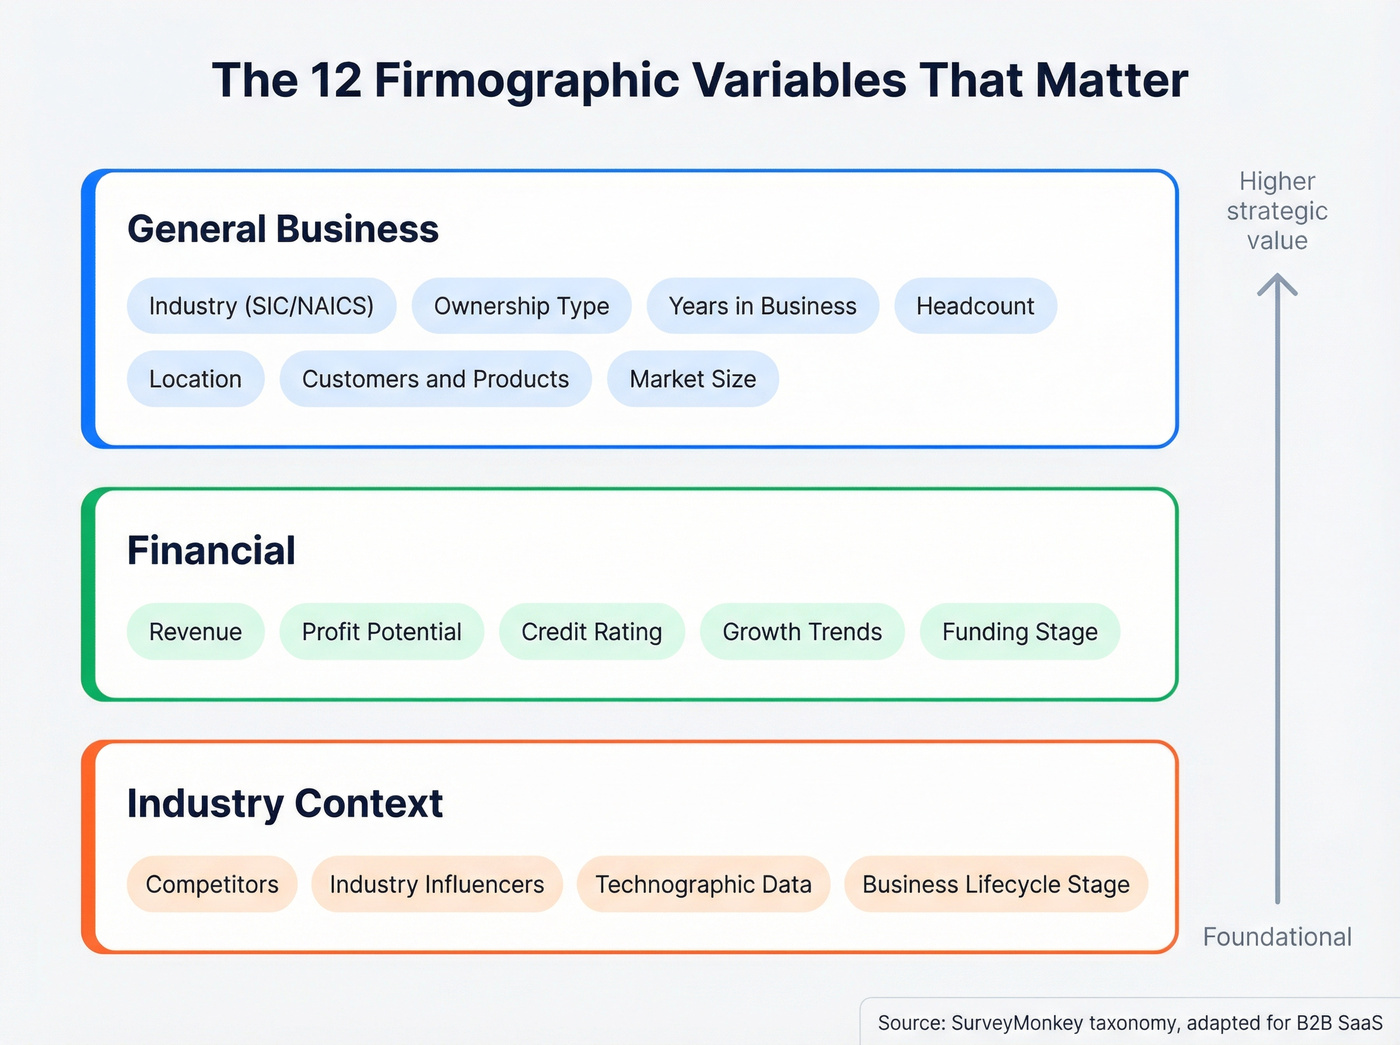
| Category | Variables |
|---|---|
| General Business | Industry (SIC/NAICS), ownership type, years in business, headcount, location, customers & products, market size |
| Financial | Revenue, profit potential, credit rating, growth trends, funding stage |
| Industry | Competitors, industry influencers, technographic data, business lifecycle stage |
A quick note on industry codes, because this trips people up constantly. NAICS provides 6-digit hierarchical codes - sector, sub-sector, industry group, specific industry. SIC is the older 4-digit system that still shows up in legacy datasets. Here's the decision:
- US-focused, modern analysis: NAICS
- Historical comparability: SIC
- Global analytics: ISIC
- EU-aligned: NACE
Confirm whether you need 6-digit NAICS or the extended 8-digit variant for internal precision. And don't mix industry codes with product codes (NAPCS/HS) or occupational codes (SOC) - they're different taxonomies entirely.
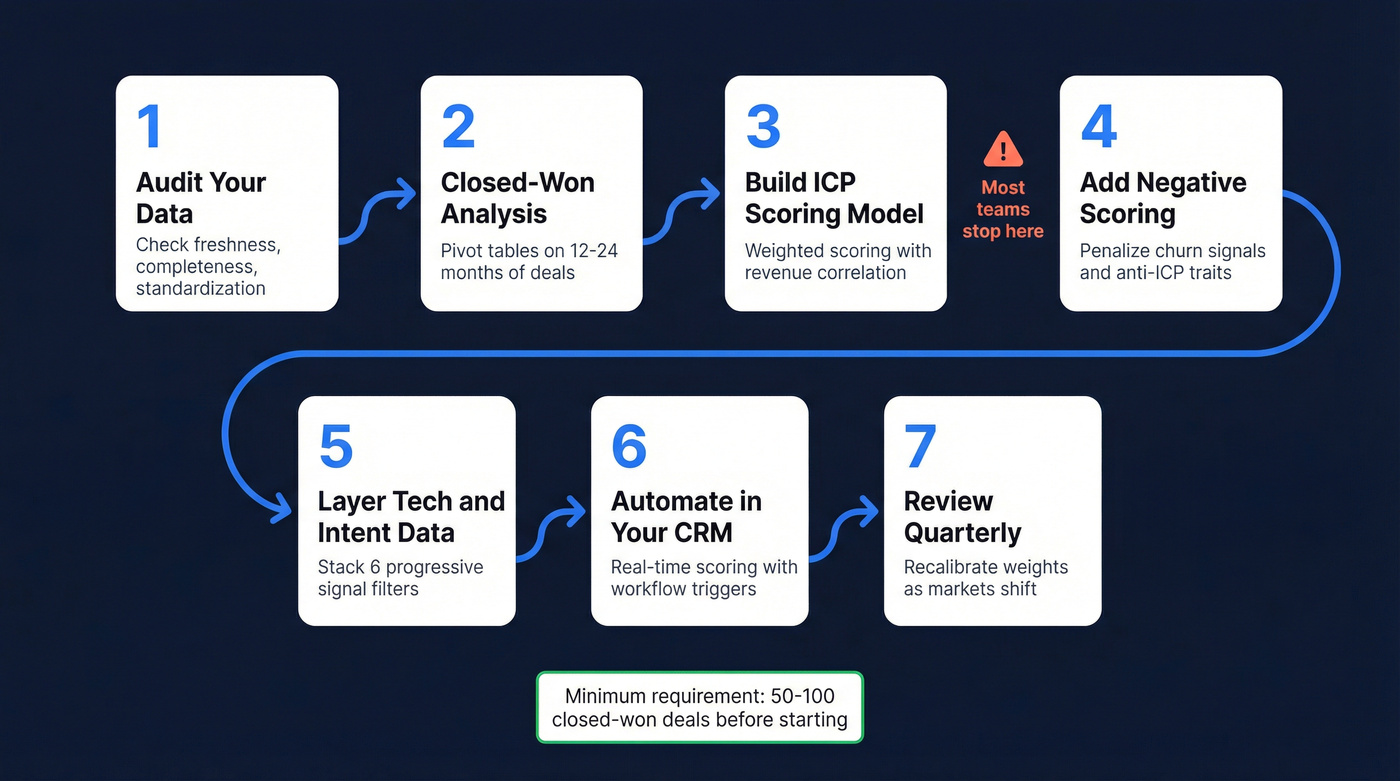
How to Analyze Firmographic Data in 7 Steps
Step 1 - Audit Your Existing Data
About 30% of B2B data decays annually. People change jobs, companies get acquired, headcounts shift. Poor data costs businesses an estimated $700 billion a year.
Before you analyze anything, you need to know what you're working with. Run this audit on your CRM:
- Completeness: What percentage of accounts have industry, revenue, and headcount filled in? If it's below 70%, you need enrichment before analysis.
- Freshness: When was each record last updated? Anything older than 6 months is suspect.
- Standardization: Are revenue ranges consistent? Is "SaaS" the same as "Software" the same as "Technology"? Inconsistent taxonomy will wreck your pivot tables.
You need a minimum of 50-100 closed-won deals to identify statistically meaningful patterns. Below that, your sample size is too small for firmographic segmentation to be reliable.
Data source reliability matters too. Not all firmographic data is created equal. Verified data (confirmed through direct validation) beats self-reported data (company-submitted forms), which beats derived data (inferred from web scraping or modeling). When you're auditing, note the provenance of each field - a revenue figure pulled from a verified financial filing is worth more than one scraped from a company's "About" page.
A compliance note: Firmographic data is generally less regulated than personal contact data, but GDPR still applies when you combine company-level attributes with personal identifiers like email addresses or names. If you're analyzing EU company data, ensure your enrichment sources are GDPR-compliant and that you have lawful basis for processing. This isn't optional.
Step 2 - Run Closed-Won Analysis
This is where most teams skip straight to building segments based on gut feel. Don't.
Your best customers already contain the patterns you need - you just have to extract them. Export your closed-won deals from the last 12-24 months. Pull every firmographic field you have: industry, revenue band, headcount, location, deal size, sales cycle length, and expansion revenue if you track it.
Now build pivot tables. The magic is in cross-tabulation:
- Industry x Revenue Band x Average Deal Size: Which combinations produce the largest deals?
- Headcount x Sales Cycle Length: Do smaller companies close faster? By how much?
- Location x Win Rate: Are you winning disproportionately in certain geographies?
Start with averages, percentages, and counts - then go deeper. The surface-level view might tell you "SaaS companies are our best customers." The cross-tab reveals "SaaS companies with 100-500 employees and $10M-$50M in revenue close 3x faster than SaaS companies above 1,000 employees."
Two companies with identical revenue and headcount can have completely different buying readiness. A 200-person company that just raised a Series B is a fundamentally different prospect than a 200-person bootstrapped company that's been flat for five years. Firmographics alone won't tell you this - but they'll get you 70% of the way there, and the remaining 30% comes from layering signals (Step 5).
Here's the thing: if you're running Outreach sequences fed by Sales Nav lists and you haven't done this closed-won analysis, you're essentially guessing which companies to target. The pivot table takes an afternoon. The ROI lasts quarters.
Step 3 - Build a Weighted ICP Scoring Model
This is the centerpiece. Most teams either skip scoring entirely or weight every variable equally - both approaches are wrong. Equal weighting means a company's location matters as much as their revenue, which is almost never true. The payoff for getting this right is real: lead scoring drives a 20% increase in sales productivity, and ML-powered scoring models deliver 300-400% ROI within the first year.

| Category | Weight | Why |
|---|---|---|
| Firmographics | 30-40% | Company fit is the foundation |
| Technographics | 15-25% | Tech stack signals readiness |
| Behavioral/Intent | 15-20% | Timing matters enormously |
| Financial Signals | 10-15% | Budget capacity indicator |
| Strategic Fit | 10-20% | Long-term value alignment |
Here's a sample scoring rubric for a mid-market SaaS company:
| Attribute | Criteria | Points |
|---|---|---|
| Employee count | 100-500 | +20 |
| Industry | SaaS / Technology | +15 |
| Location | US / UK / DACH | +10 |
| Annual revenue | $10M-$100M | +15 |
| Uses Salesforce | Yes | +25 |
| Uses Segment/Mulesoft | Yes | +15 |
| Dept headcount (target) | 20+ | +20 |
| Recent funding | Series B-D | +10 |
Set tier thresholds based on total score:
- 80-100: Tier 1 - high priority, route to AEs immediately
- 60-79: Tier 2 - nurture sequence, SDR outreach
- 40-59: Tier 3 - low priority, marketing automation only
- Below 40: Disqualify - don't waste cycles
One critical distinction: ICP scoring isn't lead scoring. ICP scoring is account-level - it measures long-term strategic fit. Lead scoring is contact-level - it measures immediate intent and sales readiness. You need both, but ICP scoring comes first.
Assign weights based on revenue correlation from your closed-won analysis (Step 2), not gut feel. Validate the model with your sales and RevOps teams before automating it. If you want a fuller governance view, map it to a dedicated lead scoring system instead of ad-hoc rules.
Step 4 - Add Negative Scoring Guardrails
Most scoring rubrics only add points. That's a fatal flaw.
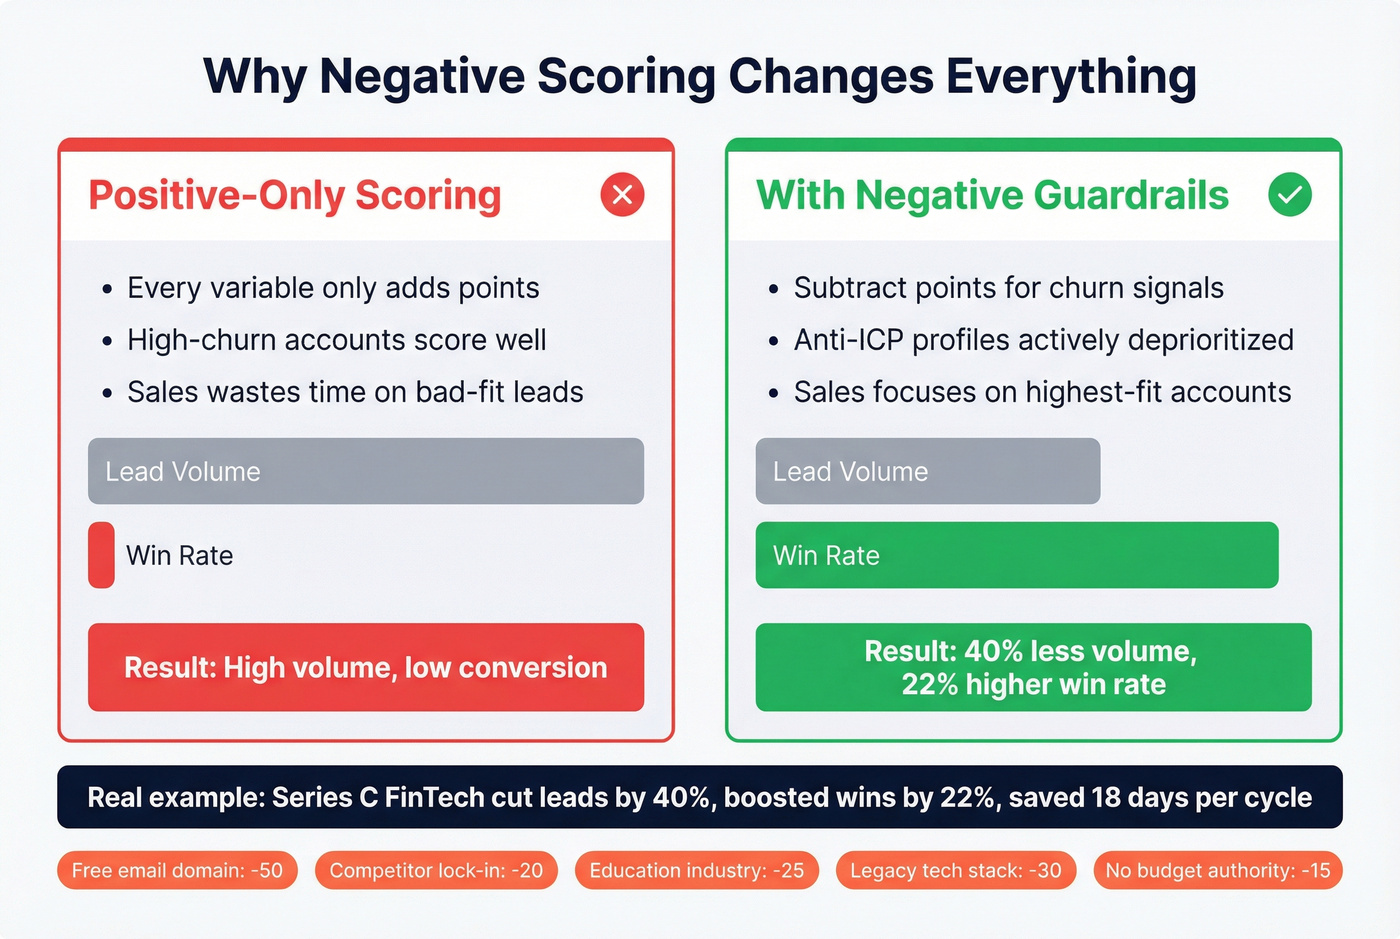
You need to subtract points for attributes that correlate with churn, long sales cycles, or low deal values.
| Attribute | Penalty |
|---|---|
| Free email domain (Gmail, Yahoo) | -50 |
| Recent competitor lock-in | -20 |
| Education industry | -25 |
| Legacy tech stack | -30 |
| No budget authority identified | -15 |
A Series C FinTech SaaS company implemented negative scoring and cut lead volume by 40% - but increased win rates by 22% and shortened their sales cycle by 18 days. Less volume, better outcomes. That's the trade-off most teams are afraid to make.
Build an Anti-ICP alongside your ICP. This is a profile of accounts to actively deprioritize. If your churn data shows that companies in education with legacy tech stacks cancel within 6 months, encode that into the model. Don't let a high firmographic score override a clear churn signal. Understanding where firmographic segmentation breaks down - particularly with look-alike companies that churn - is what separates a functional model from a vanity exercise.
Score for buying team size, not total headcount. A manufacturing giant with 5,000 employees but only 10 engineers is low-value for a DevOps tool. Department headcount is the variable that matters.
Step 5 - Layer Technographic and Intent Data
Firmographics alone are a blunt instrument. They tell you who the company is, not how it operates or whether it's in-market right now.

Think of B2B targeting signals as six progressive filters:
- Firmographic: Company identity - industry, size, location, revenue
- Technographic: Operational reality - tech stack, deployment model, usage maturity
- Intent: Timing - actively researching solutions in your category
- Behavioral: Actions - website visits, content downloads, event attendance
- Engagement: Interaction - email opens, demo requests, sales conversations
- Demographic: Contact-level - role, seniority, department
Each layer eliminates noise. Here's a practical example: your RevOps team uses firmographics to segment their target market, building a list of 500-1,000-person financial services companies. Then they layer technographics to find those using a competing CRM. Then they add intent data to surface the ones actively researching CRM migration. You've gone from thousands of potential accounts to dozens of high-probability ones.
Technographic fit acts as a force multiplier. A company running Salesforce with Segment and Mulesoft integrations signals API maturity and infrastructure readiness - that's worth +20 points in your scoring model. A company still running on-prem legacy systems signals a 12-month sales cycle minimum.
One thing we've seen teams miss repeatedly: signal decay. If an intent signal hasn't updated in 14 days, decay the score by 15% weekly. Intent data has a half-life. A company researching "CRM migration" three months ago isn't the same opportunity as one researching it today. Build decay into your scoring automation or you'll chase stale signals. If you need a more formal model, start with intent signals and graduate to accounts in-market intent data.
Step 6 - Automate Scoring in Your CRM
Once your model is validated, get it out of the spreadsheet and into your CRM. Enrichment automation alone saves over 20 hours per month per sales rep in manual data entry - and that's before you factor in the scoring benefits.
Both HubSpot and Salesforce support native lead scoring:
- HubSpot: Use custom score properties with weighted criteria. Set up workflows to auto-assign tiers and route to the right team.
- Salesforce: Build scoring rules in Einstein Lead Scoring or use custom formula fields for a manual approach.
Set up enrichment automation so new accounts get scored on creation. When a new lead enters your CRM, it should be enriched with firmographic and technographic data, scored against your model, and routed to the appropriate tier - all without a human touching it. If your CRM data hygiene is shaky, fix that first with a keep CRM data clean workflow.
The most common mistake here is "set and forget." I've seen teams spend weeks building a beautiful scoring model, automate it, and never look at it again. The model starts decaying the moment you deploy it, because your market, product, and customers are all changing.
Step 7 - Set a Quarterly Review Cadence
Static ICP models decay just like the data they're built on.
Your scoring model from Q1 won't perfectly reflect your market in Q4. Set quarterly review triggers:
- Win rate drops below your baseline by more than 5 percentage points
- New product launch changes your target buyer profile
- Market shift (recession, regulation, competitor exit) reshapes your TAM
- Sales feedback consistently contradicts the model's tier assignments
At each review, pull fresh closed-won and closed-lost data. Rerun the pivot table analysis from Step 2. Compare the patterns to your current scoring weights. Adjust.
Build a feedback loop with sales outcomes. If Tier 1 accounts are converting at the same rate as Tier 2, your model isn't differentiating effectively. If Tier 3 accounts are winning at higher rates than expected, you've got a blind spot. A lightweight win-loss analysis process makes these reviews dramatically faster.
The companies that treat ICP scoring as a living system - not a one-time project - are the ones that see compounding returns. Everyone else is running on a model that was accurate six months ago.
Here's my hot take: if your average deal is below $10K, you probably don't need ZoomInfo-level data or a 12-variable scoring model. A three-variable ICP (industry + headcount + tech stack) scored in a spreadsheet will outperform a bloated enterprise model that nobody maintains. Complexity isn't sophistication. The best scoring model is the one your team actually uses every week.
Step 1 of your firmographic playbook says audit for completeness and freshness. Prospeo's CRM enrichment fills the gaps - 92% match rate, 98% email accuracy, and firmographic fields verified through a 5-step process. Layer in Bombora intent data and technographics without switching tools.
Turn your audit gaps into enriched, scoreable accounts for $0.01 per lead.
Advanced - Cluster Analysis for Firmographic Segmentation
If you've got 500+ accounts and data science resources, clustering algorithms can surface segments you'd never find manually. This is where a firmographic segmentation strategy moves from spreadsheet-grade to genuinely predictive.
The approach adapts K-means clustering - typically used for RFM (Recency, Frequency, Monetary) analysis in B2C - to firmographic variables. Instead of R/F/M, you're clustering on Revenue / Employee Count / Growth Rate, or whatever firmographic dimensions matter most for your business.
The process:
- Clean: Remove duplicates, null values, and obvious outliers. A single $50B enterprise in a dataset of mid-market companies will distort everything.
- Explore: Run exploratory data analysis to understand distributions and correlations. If revenue and headcount are 95% correlated, you probably only need one.
- Engineer features: Calculate derived variables - revenue per employee, growth rate over 12 months, department-to-total headcount ratio.
- Scale: This is the step most people skip. Clustering algorithms are distance-based, so features with larger absolute values dominate without normalization. A company with $50M revenue and 200 employees will cluster based almost entirely on revenue unless you standardize both features to the same scale.
- Cluster: Run K-means. Use the elbow method to determine optimal cluster count - plot inertia against K and look for the bend. Validate with silhouette scoring (anything above 0.3 is usable; above 0.5 is strong).
- Evaluate: Profile each cluster. What are the firmographic characteristics of Cluster 1 vs Cluster 3? Which cluster has the highest win rate? Highest LTV?
Agglomerative (hierarchical) clustering is a solid alternative - it produces a dendrogram visualization that shows how clusters nest within each other, which is useful for deciding granularity. Start with K-means for speed, use agglomerative when you need to explain the segmentation logic to stakeholders.
Python's pandas + scikit-learn handles this comfortably. A Jupyter notebook and your CRM export will get you there.
Tools for Firmographic Data Analysis and Enrichment
Enrichment Tools
Prospeo
The strongest option for firmographic enrichment accuracy and freshness. The database covers 300M+ professional profiles with 30+ search filters - buyer intent, technographics, headcount growth, department headcount, funding, revenue. The 7-day data refresh cycle is dramatically faster than the 6-week industry average, which means your analysis is built on current data, not stale snapshots. 98% email accuracy, 92% API match rate, 83% enrichment match rate returning 50+ data points per contact. At roughly $0.01 per lead, it's 90% cheaper than ZoomInfo. Free tier gives you 75 verified emails per month. Native integrations with Salesforce, HubSpot, Clay, and every major sequencer.
Apollo
Skip this if you need high email accuracy for cold outbound at scale. Choose this if you're a lean team that wants data and sequencing in one platform without spending much. The free tier is genuinely usable, and paid plans run roughly $49-79/mo per user. The database is large (275M+ contacts), and the combined prospecting + outreach workflow saves time. Email accuracy sits at 79% - workable for nurture campaigns, risky for cold outbound where bounces burn your domain.
ZoomInfo
Still the most comprehensive all-in-one GTM platform. 100M+ professional profiles, deep US coverage, intent data via Bombora, org chart mapping, and workflow tools for everything from chat to advertising.
The tradeoff: cost and complexity. Mid-market contracts run $15,000-40,000/year with annual commitments. The refresh cycle is 4-6 weeks. If you're a 500-person sales org running outbound, ABM, and intent from one platform, ZoomInfo earns its price. For teams under 50 reps, you're paying for modules you'll never activate.
Clearbit (HubSpot)
Now part of HubSpot. 100+ data points per company, instant lead routing based on firmographic attributes. If you're already on HubSpot, it's the path of least resistance. Roughly $100-300/mo standalone.
Cognism
Strong EMEA coverage and phone-verified mobile numbers. Best choice for selling into the UK, DACH, or Nordics. Roughly $15,000-30,000/year with annual contracts.
Analysis Tools
| Tool | Best For | Price |
|---|---|---|
| Prospeo | Enrichment + filters | Free; ~$0.01/lead |
| Apollo | Data + sequencing | Free; $49-79/mo |
| ZoomInfo | Enterprise GTM | $15K-40K/yr |
| Clearbit | HubSpot enrichment | ~$100-300/mo |
| Cognism | EMEA data | $15K-30K/yr |
| Excel/Sheets | Pivot tables (<500 accts) | Free |
| HubSpot/SFDC | CRM-native scoring | Included |
| Clay | ICP scoring workflows | $149-800/mo |
| Python (pandas) | Cluster analysis | Free |
For teams under 500 accounts, Excel or Google Sheets pivot tables are all you need for the analysis itself. Graduate to CRM-native scoring in Salesforce or HubSpot when you're ready to automate. Clay is excellent for operationalizing complex ICP scoring workflows - it sits between your enrichment tool and your CRM, running multi-step scoring logic that'd be painful to build natively.
Common Firmographic Analysis Mistakes (and How to Avoid Them)
1. Equal-weighting all variables. Industry and headcount don't matter equally. Weight based on revenue correlation from your closed-won data, not intuition.
2. Static models with no review cadence. Your ICP from January is wrong by July. Markets shift, products evolve, competitors enter and exit. Quarterly reviews aren't optional.
3. No negative scoring. If you're only adding points, every account looks decent. Negative scoring is what separates Tier 1 from Tier 2 - and keeps your sales team from chasing accounts that'll churn in 90 days.
4. Ignoring data quality and decay. Roughly 30% of B2B data goes stale annually. If you haven't enriched your CRM in the last quarter, your analysis is based on outdated information. Garbage in, garbage out isn't a cliche - it's the #1 reason firmographic analysis fails. If you want to formalize QA, use a simple data quality scorecard and enforce it quarterly.
5. Over-segmentation. Creating 47 micro-segments that each contain 12 accounts isn't segmentation - it's analysis paralysis. You need segments large enough to run campaigns against. If a segment can't fill a sequence, it's too small.
6. No feedback loop with sales outcomes. Your scoring model is a hypothesis. Closed-won and closed-lost data is the test. If you're not feeding outcomes back into the model, you're flying blind. Only 27% of leads sent to sales are actually qualified - a feedback loop is how you fix that number.
7. Collecting forever, analyzing never. The #1 complaint we see on Reddit about firmographic data? Most teams buy a data tool and never actually analyze what they're sitting on. They export lists, send cold emails, and call it "data-driven." Analysis means pivot tables, scoring models, and quarterly reviews - not just having the data in your CRM.
FAQ
What's the difference between firmographic and demographic data?
Firmographic data describes company-level attributes - industry, revenue, headcount, location. Demographic data describes individuals - age, title, seniority. Use firmographics to qualify accounts first, then demographics to qualify contacts within them.
How many closed-won deals do I need before firmographic analysis is useful?
You need 50-100 closed-won deals minimum to identify statistically meaningful firmographic patterns. Below that threshold, apparent "patterns" are usually noise. If you're pre-PMF with fewer than 50 wins, use psychographic and jobs-to-be-done segmentation instead.
How often should I refresh my firmographic data?
Quarterly at minimum, since roughly 30% of B2B data decays each year. Enterprise providers like ZoomInfo refresh every 4-6 weeks; tools like Prospeo refresh on a 7-day cycle. The fresher your data, the more reliable your scoring model and segmentation outputs.
Can I do firmographic analysis without expensive tools?
Yes - start with Excel or Google Sheets pivot tables on a CRM export. Cross-tab industry by revenue band by deal size. You only need paid enrichment tools when your existing data has critical gaps. Free tiers from tools like Prospeo (75 emails/month) or Apollo cover early-stage enrichment needs.
What's the best firmographic segmentation approach for small teams?
Focus on three variables - industry, headcount, and one technographic signal - and score them in a simple spreadsheet. Small teams that try to replicate enterprise-grade models with dozens of attributes end up with complexity they can't maintain. Nail the basics, validate against win rates, and add variables only when you have the data and bandwidth to keep the model current.