Sales Conversion Rate by Industry: 2026 Benchmarks That Actually Mean Something
A business owner shared their numbers on r/PPC earlier this year: 180 ad enquiries, 28 paid sales, 15.56% conversion rate. Sounds decent, right? After £12,916 in ad spend and a 10% profit margin, they were roughly £1,047 in the red. A "good" sales conversion rate by industry standards - one that lost money. Benchmarks are useless without context, so let's supply some.
The Short Version
Sales call conversion rates range from 8.37% for industrial equipment to 27.15% for janitorial services, but deal size explains more than industry does. A $500-$10K deal closes at 25.73%. A $5M-$10M deal? Just 9.09%. If your rates look low, check your data quality and measurement method before blaming your team.
What "Conversion Rate" Actually Means
The formula is simple: conversions divided by total opportunities, times 100. The problem is nobody agrees on what "conversion" and "opportunity" mean.
Some benchmarks measure website visitor to lead. Others measure SQL to closed-won. Still others track ad click to purchase. Most benchmark articles don't specify which definition they're using, which makes comparing your numbers to a random industry average almost always misleading. We've seen teams celebrate a "20% conversion rate" that was actually measuring something completely different from the benchmark they were comparing against.
If you want a baseline definition and examples across funnels, start with our sales conversion rate guide.
2026 Conversion Benchmarks by Industry
Sales Call Conversion (SQL to Closed)
These are SQL-to-closed-deal rates - not cold call pickup rates. The typical range sits between 13% and 25%.
| Industry | Conversion Rate |
|---|---|
| Janitorial | 27.15% |
| Printing | 26.82% |
| Office Supplies | 25.32% |
| Technology/Software | 9.39% |
| Industrial Equipment | 8.37% |
Janitorial services close at 3x the rate of industrial equipment. That gap comes down to deal complexity, buyer committee size, and procurement requirements. A facilities manager signing off on a cleaning contract faces none of the friction that a six-person buying committee evaluating capital equipment does.
If you're selling into complex buying committees, the enterprise B2B sales playbook will feel more relevant than generic SMB benchmarks.
B2B Website Conversion (Visitor to Lead)
These numbers from First Page Sage cover January 2022 through August 2025 and measure unique visitors who complete a conversion action.
| Industry | Conversion Rate |
|---|---|
| Legal Services | 7.4% |
| HVAC | 3.1% |
| Staffing & Recruiting | 2.9% |
| Manufacturing | 2.2% |
| B2B SaaS | 1.1% |
SaaS at 1.1% looks terrible until you realize the average SaaS visitor is browsing, not buying. Legal services convert higher because someone searching for a lawyer usually needs one now. If you're in SaaS and want to move the needle, auto-sending a problem-focused deck right after email capture beats generic "request a demo" CTAs every time.
To tighten this up, align your lead capture + qualification with a real B2B sales funnel template and consistent lead scoring.
Conversion Rate by Deal Size
Here's the thing most benchmark articles won't tell you: deal size is a better predictor of your close rate than your industry vertical. In our experience, teams that segment by deal size instead of industry make smarter decisions about pipeline health every single time.
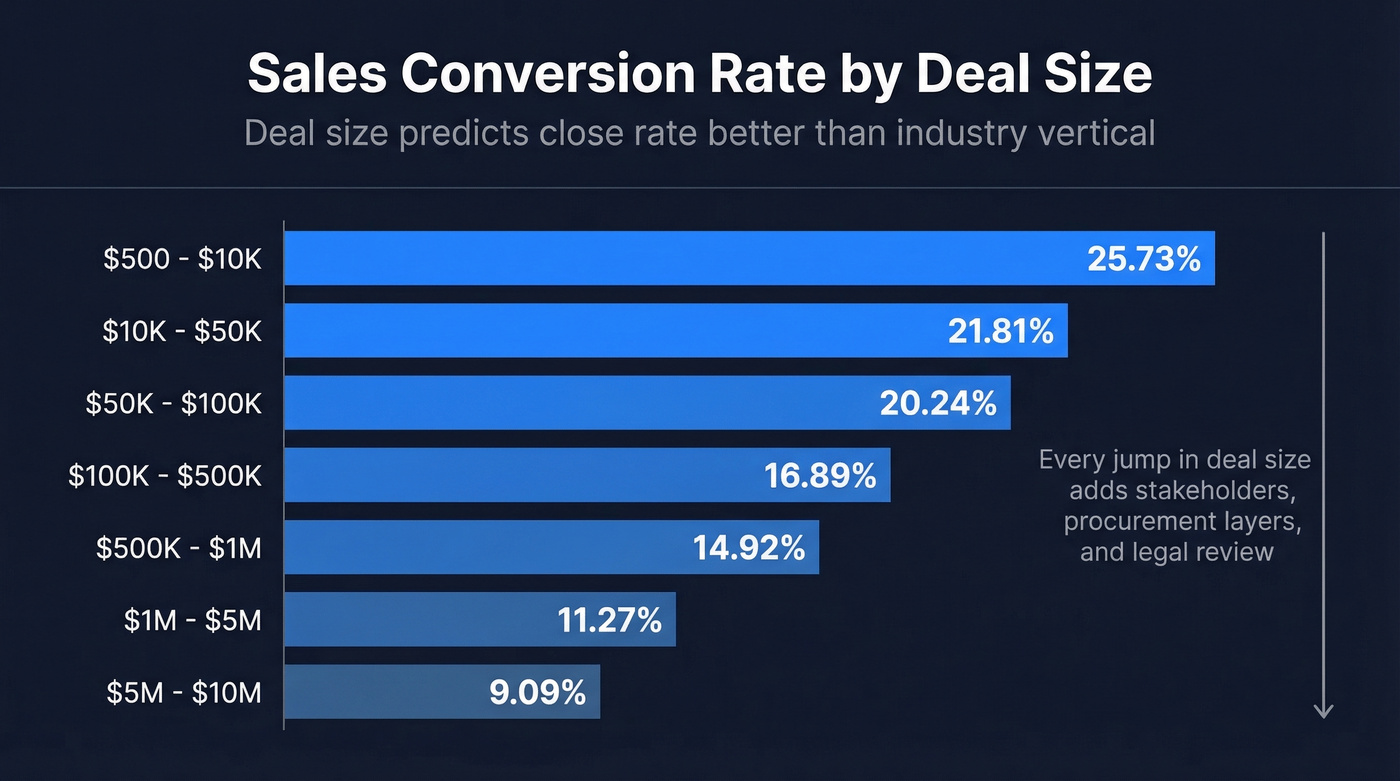
| Deal Size | Conversion Rate |
|---|---|
| $500-$10K | 25.73% |
| $10K-$50K | 21.81% |
| $50K-$100K | 20.24% |
| $100K-$500K | 16.89% |
| $500K-$1M | 14.92% |
| $1M-$5M | 11.27% |
| $5M-$10M | 9.09% |
The pattern is consistent: as deal size increases, conversion rates drop. Every jump adds stakeholders, procurement layers, and legal review. If you're selling six-figure deals and comparing yourself to a benchmark built on $5K transactions, you're measuring the wrong thing entirely.
If you want to pressure-test whether your numbers are “normal,” compare against sales pipeline benchmarks and track pipeline health by segment.
Conversion Rate by Channel
| Channel | Conversion Rate |
|---|---|
| Referral | 25.56% |
| Email Marketing | 22.83% |
| SEO | 21.22% |
| PPC | 15.73% |
| Trade Shows | 13.59% |
| Social | 11.56% |
| Cold Calling | 9.38% |
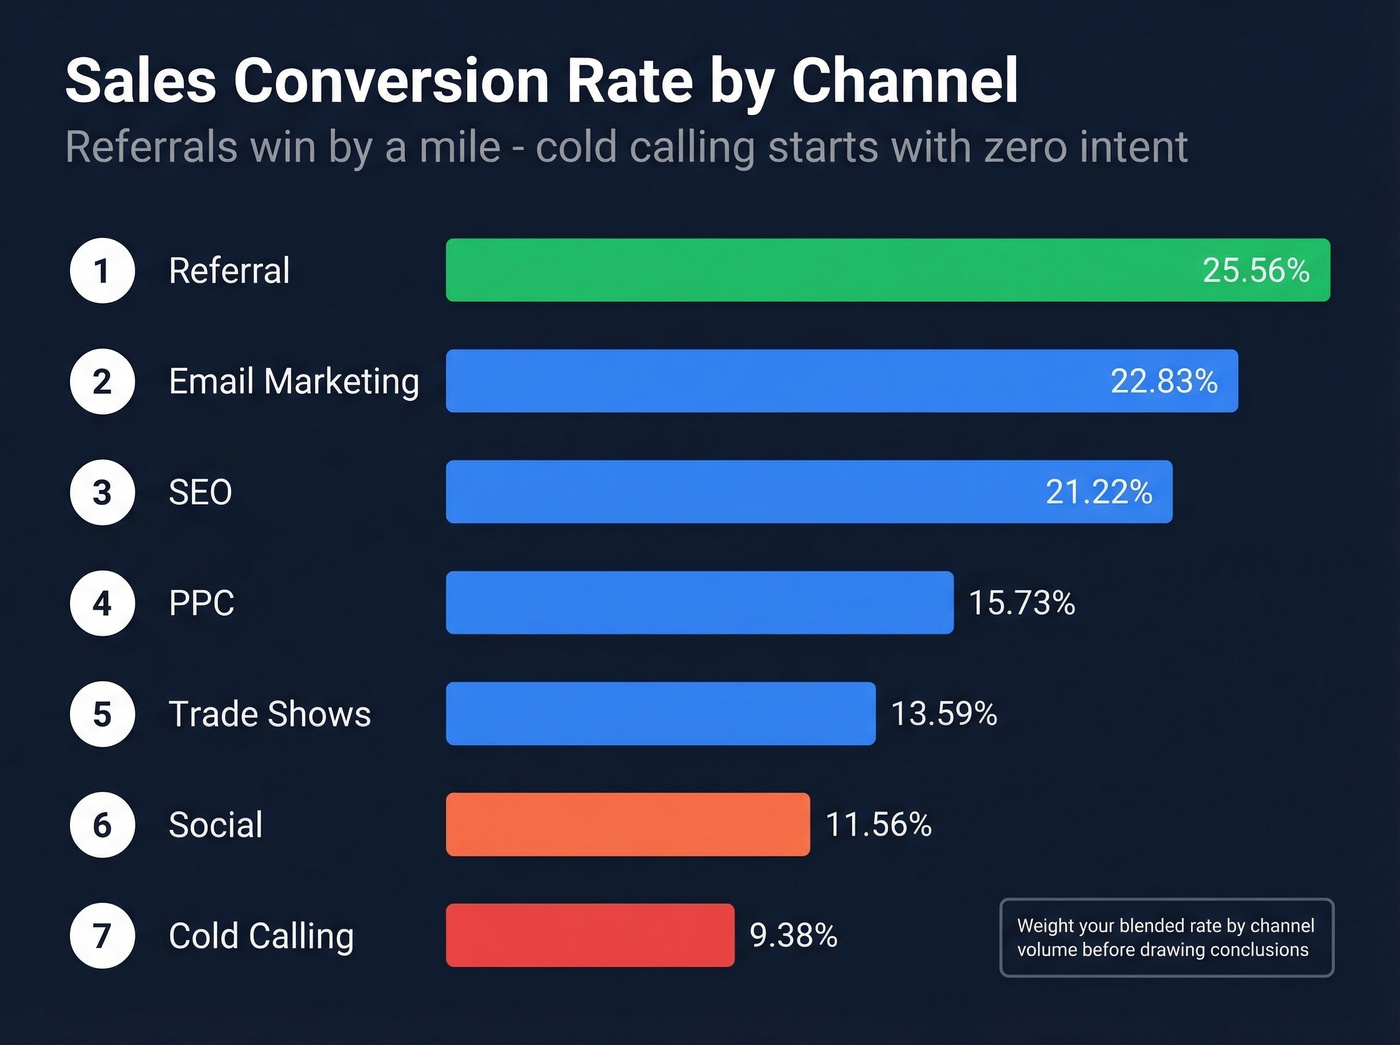
Referrals win by a mile. Cold calling sits at the bottom - not because it doesn't work, but because it starts with zero intent. If your referral pipeline converts at 25% and your cold outbound at 9%, that's not a problem. It's expected. Weight your blended rate by channel volume before drawing conclusions.
If cold calling is a core channel for you, build a repeatable cold calling system and train for cold call rejection so activity doesn’t collapse.
Referrals convert at 25%. Cold outbound at 9%. But bad data drags every channel down. Meritt's bounce rate dropped from 35% to under 4% with Prospeo - and their pipeline tripled to $300K/week. 98% email accuracy, refreshed every 7 days, at $0.01 per lead.
Stop losing deals to dead emails and stale data.
Full-Funnel B2B Benchmarks
Here's what the funnel actually looks like stage by stage, based on aggregated data from MarketJoy and Salesforce's State of Sales report:
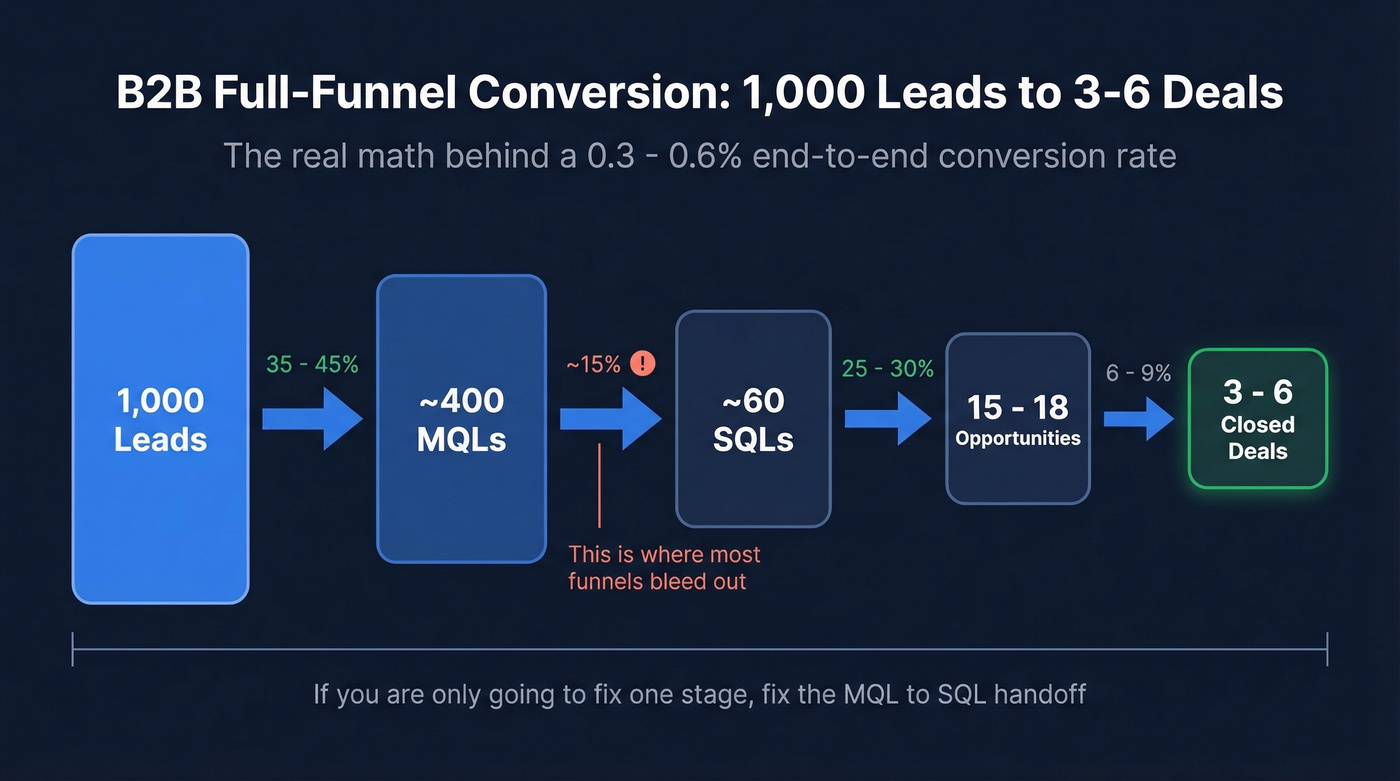
| Stage | Typical Range |
|---|---|
| Lead to MQL | 35-45% |
| MQL to SQL | ~15% |
| SQL to Opportunity | 25-30% |
| Opportunity to Closed-Won | 6-9% |
Walk through the math: start with 1,000 leads. About 400 become MQLs. Around 60 qualify as SQLs. Maybe 15-18 become real opportunities. You close 3-6 deals. That's a 0.3-0.6% end-to-end rate, and it's completely normal.
MQL to SQL is where most funnels hemorrhage. Marketing hands off leads that aren't truly sales-ready, and reps waste cycles qualifying them out. If you're only going to fix one stage, fix that handoff.
For SaaS specifically, First Page Sage reports tighter stage rates: Lead to MQL 39%, MQL to SQL 38%, SQL to Opportunity 42%, SQL to Closed 37%. These measure SQL to Closed rather than Opportunity to Closed-Won, which is why they appear dramatically better. SaaS companies also tend to have sharper lead scoring and self-serve qualification baked into their funnels.
To diagnose where your funnel is leaking, use a consistent set of funnel metrics and map the handoffs in your lead generation workflow.
Why Your Conversion Rate Looks Wrong
We've seen teams panic over a 12% close rate that was actually strong for their deal size. Before you do the same, run through this list:
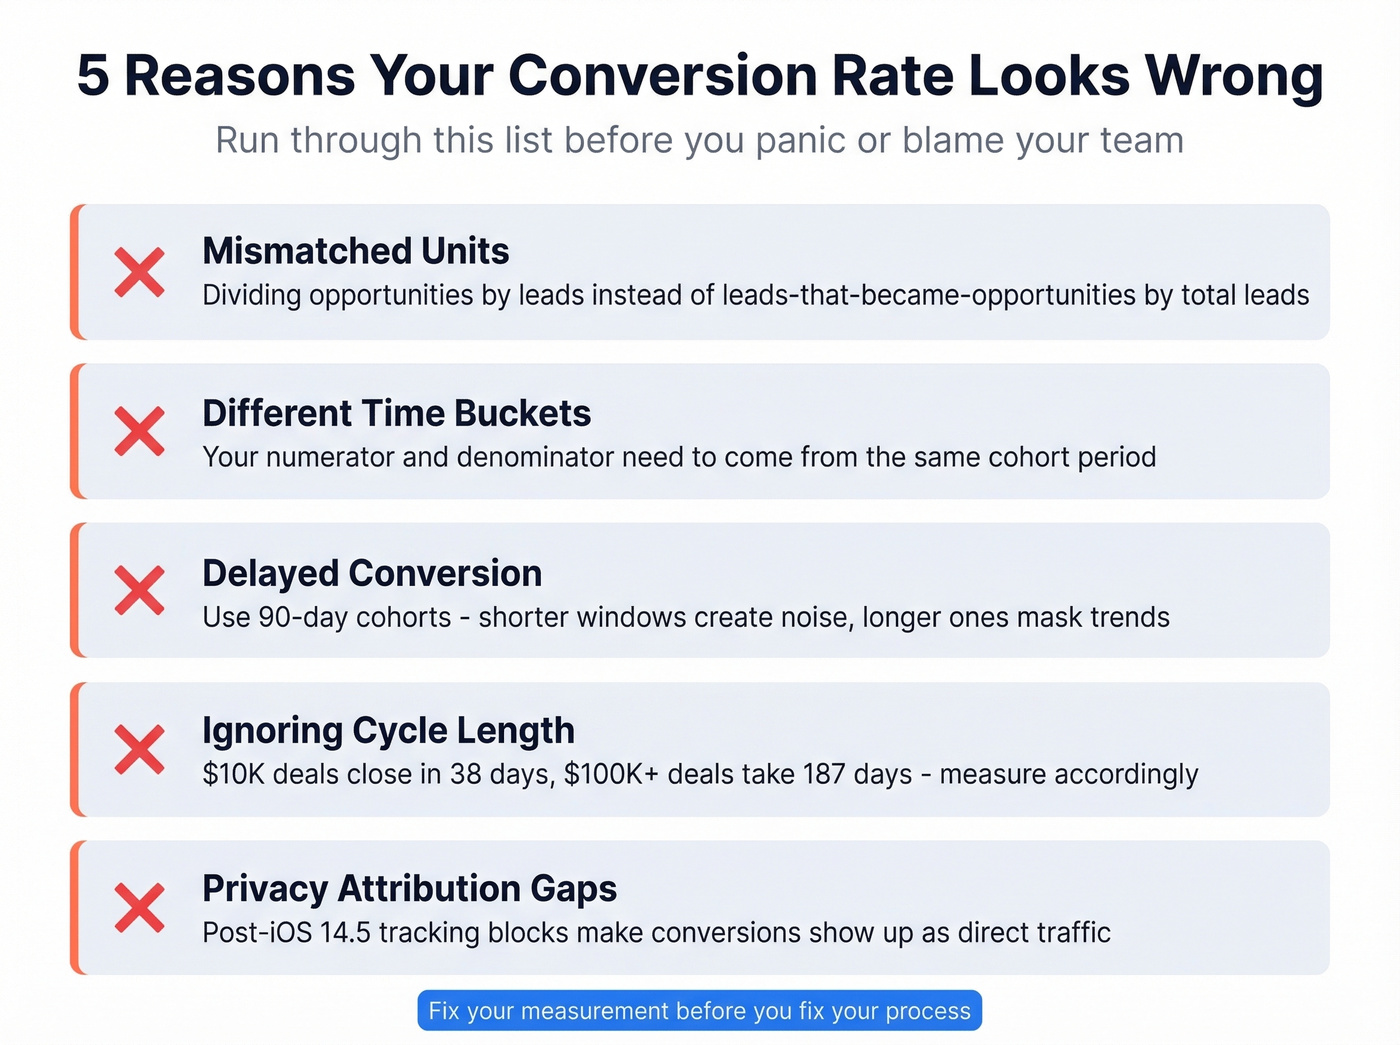
Mismatched units. Are you dividing opportunities by leads instead of leads-that-became-opportunities by total leads? These produce very different numbers.
Different time buckets. Your numerator and denominator need to come from the same cohort. Dividing March closes by January leads creates phantom rates.
Delayed conversion. "Converted so far divided by total" is the most common and most incorrect formula. Use 90-day cohorts - shorter windows create noise, longer ones mask trends.
Ignoring cycle length. A team selling $10K-$25K ACV deals has a 38-day median cycle. At $50K-$100K ACV, that jumps to 128 days. Above $100K, you're looking at 187 days. Measuring conversion on a 30-day window for six-figure deals guarantees an artificially low rate.
Privacy-driven attribution gaps. Post-iOS 14.5, a growing share of conversions show up as "direct" traffic because tracking gets blocked. If your attributed conversion rate dropped without a corresponding revenue drop, your real performance didn't change - your measurement did.
A common complaint on r/sales is teams comparing their enterprise close rates to SMB benchmarks. Don't be that team.
How to Actually Improve Your Close Rate
Clean Your Data First
Bad contact data is the silent conversion rate killer. If a third of your emails bounce, your reps burn capacity on dead leads, and your SQL-to-Closed rate reflects data rot - not sales ability.
Meritt experienced this directly: their bounce rate dropped from 35% to under 4% after switching to Prospeo, and pipeline tripled from $100K to $300K per week. When your email accuracy sits at 98% and data refreshes every 7 days, reps spend time on real conversations instead of chasing invalid addresses.
If you’re troubleshooting deliverability, start with email bounce rate benchmarks and the root-cause fixes in our email deliverability guide.

Speed Up Lead Response
Contacting leads within 24 hours increases conversion by 5x. That's not a marginal improvement - it's the difference between a pipeline that works and one that leaks. Automate the handoff from marketing to sales and measure time-to-first-touch as a KPI. If your average response time is over 48 hours, skip every other optimization on this list and fix that first.
If you need copy that gets replies fast, keep a set of sales follow-up templates ready for the first 24 hours.
Benchmark by Deal Size, Not Industry
Stop comparing your $200K enterprise deals to an industry average built on SMB transactions. Segment your conversion rates by deal size band, measure each cohort on its own cycle length, and you'll finally have numbers that mean something.
A 15% close rate on $500K deals is strong. The same rate on $5K deals is a problem. Let's be honest - most "low conversion rate" panic we've seen comes from this exact mismatch.
MQL-to-SQL is where most funnels bleed out. Bad contact data means reps waste cycles on leads that never connect. Prospeo's 300M+ verified profiles and 92% enrichment match rate ensure your pipeline is filled with real, reachable buyers - not ghost records.
Fix the handoff with data your reps can actually convert.
FAQ
What's a good sales conversion rate?
For SQL-to-closed deals, 13-25% is the typical range across most industries. Teams closing sub-$10K deals should aim for 20%+. Above $100K, 10-15% is strong. Always segment by deal size first - industry averages alone don't tell you much.
Why is my conversion rate lower than benchmarks?
Most likely you're comparing the wrong metric, your average deal size is larger than the benchmark assumes, or bad contact data is dragging down your pipeline. Check your email bounce rate first - if it's above 5%, that's the place to start before you change anything else in your process.
How often should I recalculate conversion rates?
Use 90-day cohorts for the most reliable signal. Make sure your numerator and denominator come from the same time window, and account for your average sales cycle length. Measuring 30-day conversion on 120-day deals produces meaningless numbers.