How to A/B Test Reply Rates - And When Not To
You sent 300 emails per variant. Variant B pulled a 4% reply rate versus 2% for Variant A. You declared B the winner, rewrote your playbook, and scaled the campaign. Here's the problem: at 300 sends per variant, that "lift" is well within the range of normal variance, list quality differences, or deliverability noise. It's not a result. It's a coin flip.
Most cold email A/B tests are underpowered. And a surprising number fail not because the copy was wrong, but because the data was bad before the first email ever sent.
What You Need Before Testing
Before you design a single test, nail these three things:
- Hard bounce rate above ~1%? Fix your contact data first. Bounces shrink your delivered pool and skew results across variants unevenly.
- You need ~1,000+ sends per variant for a practical shot at detecting big lifts. Anything less is guesswork dressed up as science.
- Test targeting and offer first, subject lines and CTAs second. Most testing guides get this priority order completely backwards, and it costs teams months of wasted volume.
Reply Rate Formula (Done Right)
Reply Rate = Unique Human Replies / Delivered Emails x 100
Delivered means sent minus hard bounces - not total sends. Exclude auto-replies, out-of-office messages, and system notices. Count only the first reply per contact.
Then there's positive reply rate, the metric that often gets buried in reporting: positive replies / total replies x 100. In most outbound motions, only 20-40% of total replies are genuinely positive. The rest are "not interested," "remove me," or auto-generated. When someone reports a 12% reply rate, ask what percentage were positive. The answer is usually uncomfortable.
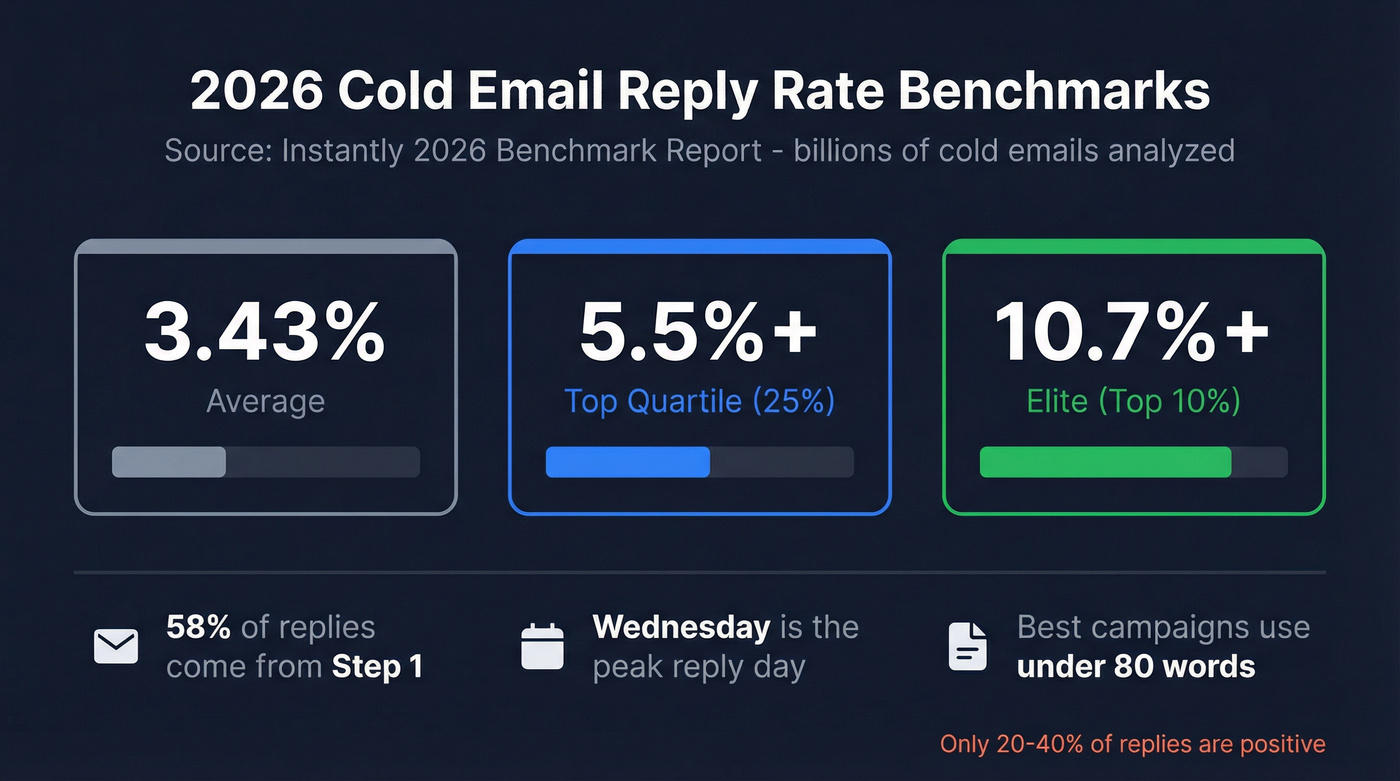
2026 Reply Rate Benchmarks
The Instantly 2026 benchmark report - based on billions of cold email interactions across thousands of workspaces - gives us the clearest picture:
| Tier | Reply Rate |
|---|---|
| Average | 3.43% |
| Top Quartile | 5.5%+ |
| Elite (Top 10%) | 10.7%+ |
GMass puts the broad range at 1-5%, and Backlinko's outreach study found an 8.5% average response rate. The spread is wide because targeting quality varies enormously. Roughly 95% of cold emails fail to generate any reply at all, which is exactly why testing methodology matters so much.
A few other data points worth noting: 58% of all replies come from Step 1, with 42% from follow-ups. Wednesday is the peak reply day. And the best-performing campaigns keep emails under 80 words.
Bad data doesn't just kill deliverability - it kills every A/B test you run. When 35% of emails bounce, your variants aren't split evenly and your results are noise. Prospeo's 98% email accuracy and 7-day refresh cycle keep your delivered pool clean so your tests measure what you're actually changing.
Stop A/B testing on a broken foundation. Start with verified data.
Diagnose Before You Test
If your infrastructure is broken, no split test will produce reliable results. Run through this diagnostic before you touch a single subject line.
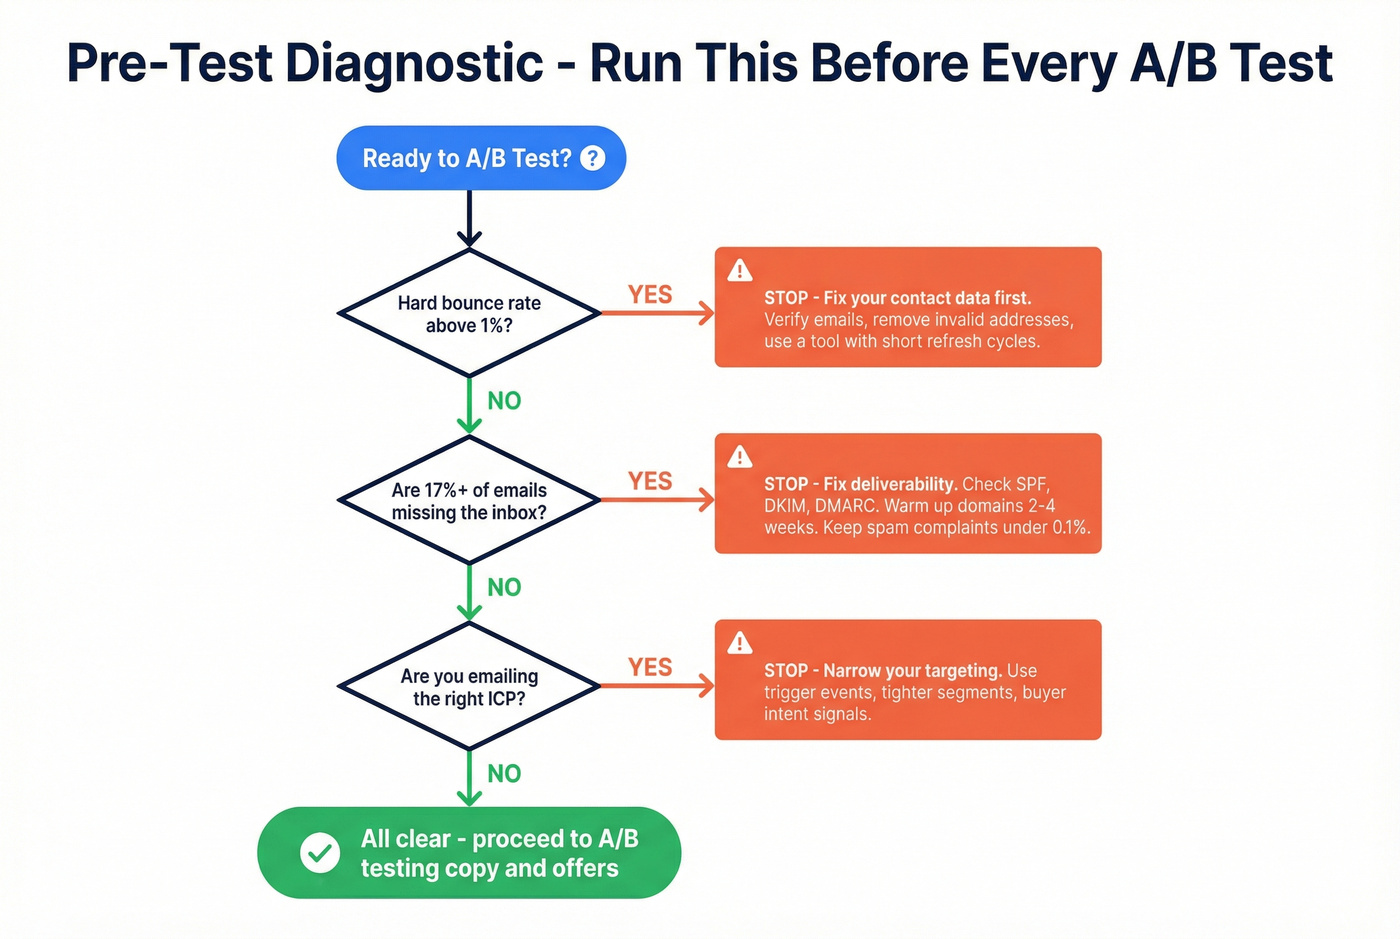
Is your hard bounce rate above ~1%? Your delivered denominator is getting distorted. Fix data quality first. (If you need a deeper breakdown, start with hard bounce rate basics.)
Are ~17%+ of your emails missing the inbox? That's a deliverability problem. Check SPF, DKIM, and DMARC records. Warm up new domains for 2-4 weeks before scaling. Keep spam complaints under 0.1% - and at or below 0.3% to meet Gmail bulk-sender expectations.
Are you emailing the right people? If your ICP is too broad, even perfect copy won't save you. Fix targeting before optimizing messaging. (For a framework, see choosing targets for cold outreach.)
Only when all three pass should you proceed to testing copy.

Stale data is the silent killer of A/B tests. An email that was valid three months ago and bounces today skews your results without you knowing. Prospeo verifies emails at 98% accuracy on a 7-day refresh cycle, and customers like Meritt saw bounce rates drop from 35% to under 4%. Clean data isn't a nice-to-have for testing - it's a prerequisite. (If you're auditing your list, compare email verification approaches and refresh cycles.)
What to Test to Improve Reply Rates
This is where most guides go wrong. They start with subject lines because they're easy to test. But the variables that actually move reply rates follow a different priority order entirely.
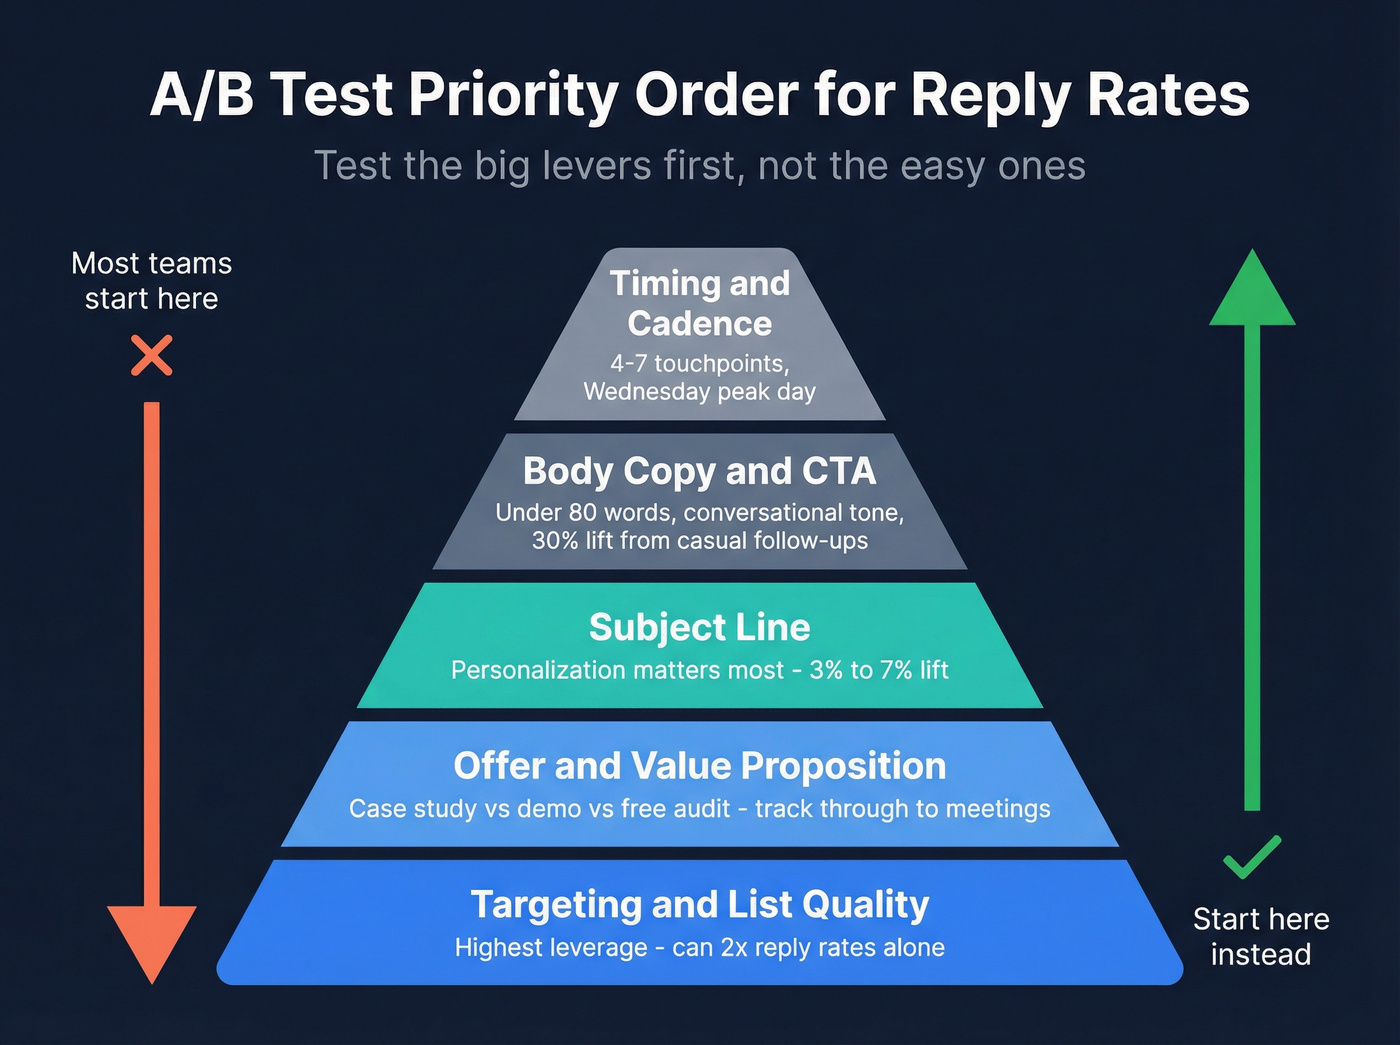
Targeting & List Quality
The highest-leverage variable, and it's not close.
A narrow ICP combined with trigger events - new funding, job changes, tech adoption - can push reply rates well above baseline averages. We've seen teams double their numbers by splitting a broad list into tighter segments and writing one version of copy for each. No subject line tweak will ever produce that kind of lift. (If you want more examples, use these cold email tactics to prioritize high-impact tests.)
Offer & Value Proposition
What you're offering matters more than how you phrase it. A case study offer versus a demo request versus a free audit will produce wildly different reply rates - and wildly different downstream conversion.
Here's the thing: if you're optimizing for replies without tracking what happens next, you're optimizing for vanity. A variant with 8% replies but 1% meetings booked is worse than one with 5% replies and 3% meetings. Track through the entire funnel, not just the inbox. (To connect replies to outcomes, use a sales funnel view, not just email metrics.)
Subject Line
A Belkins study of 5.5 million emails found that personalized subject lines lifted reply rates from 3% to 7%, with 2-4 word subject lines yielding 46% open rates. The real insight isn't "test 3 words versus 5 words." It's that personalization is the variable that matters, and everything else is marginal. (For more, see personalization in outbound sales.)
Body & CTA
| Don't | Do |
|---|---|
| Write 150+ word emails | Keep it under 80 words |
| Send formal follow-ups | Make Step 2 feel like a reply, not a reminder |
| Test body copy before targeting | Only test copy once ICP and offer are locked |
Conversational follow-ups outperform formal ones by roughly 30%. But don't expect body copy changes to move the needle as much as targeting or offer changes. (If you need structure, borrow a proven sales email structure.)
Timing & Follow-Up Cadence
48% of reps never send a second message. That's not a testing insight - that's just leaving money on the table. One follow-up alone lifts replies by 65.8% per Backlinko's outreach study. The sweet spot is 4-7 touchpoints: under 4 gives up too early, beyond 7 hits diminishing returns. (For timing rules, see when should I send a follow up email.)
The Math Most Guides Skip
A HubSpot worked example using a 2% baseline reply rate, a 20% minimum detectable effect, and 95% confidence requires roughly 20,000 emails per variant. That's 40,000 total sends to detect a small improvement.
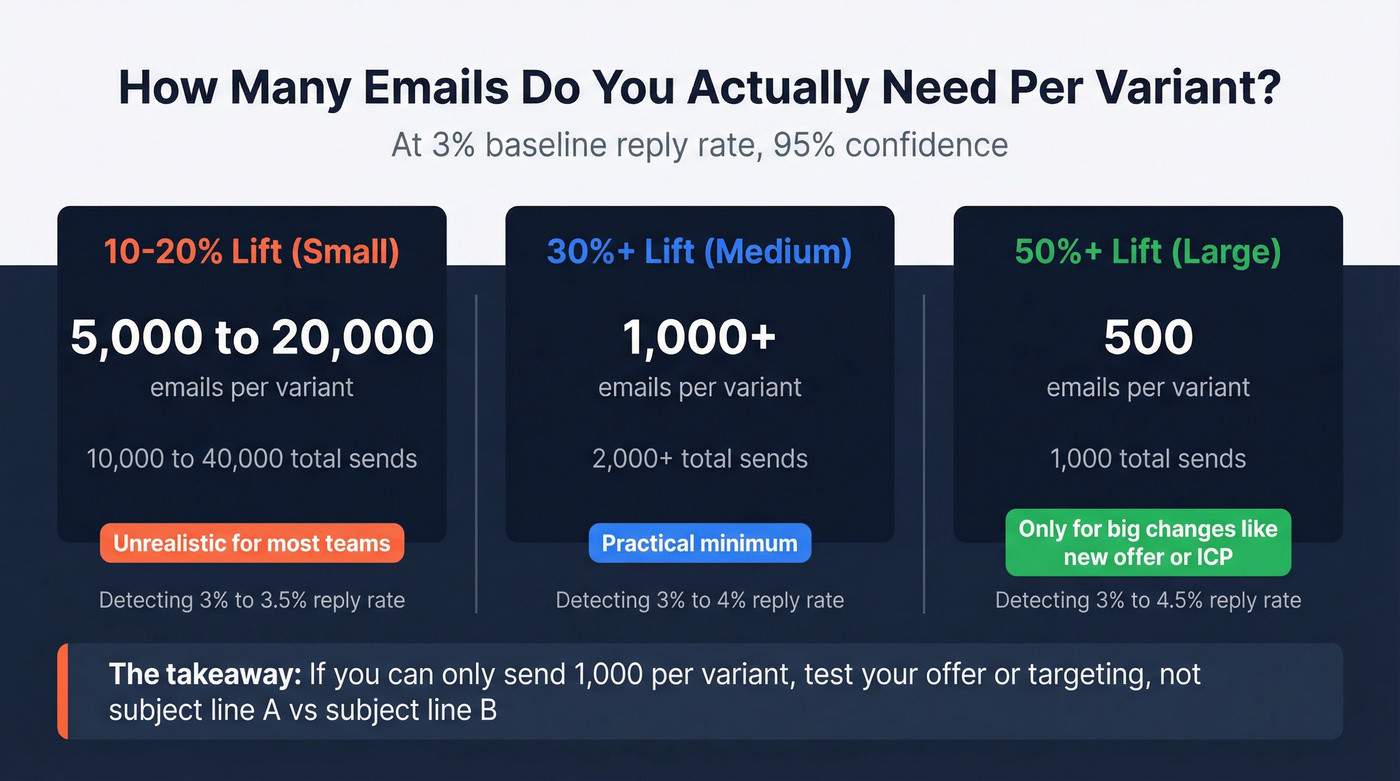
For most cold email teams, that's unrealistic.
The practitioner shortcut: 1,000 emails per variant works for detecting 30%+ lifts - the kind of large effects you'd see from changing your offer or targeting, not from swapping one subject line for another. Use the Evan Miller calculator or Optimizely's analysis tools to run your own numbers. (If you're comparing platforms, start with email A/B testing tools.)
In our experience, most teams don't have the volume for statistically rigorous tests. That's exactly why the priority framework above matters more than the math. If you can only run 1,000 sends per variant, spend that budget testing your offer against a different offer, not subject line A against subject line B.
Let's be honest: if you're sending 500 emails per variant at a 3% baseline, you're flipping a coin and calling it data.
Mistakes That Kill Your Tests
Testing multiple variables at once. Changed the subject line AND the CTA AND the send time? You have no idea what caused the lift. Isolate one variable per test, always. (If you want a full methodology, follow a dedicated split testing workflow.)
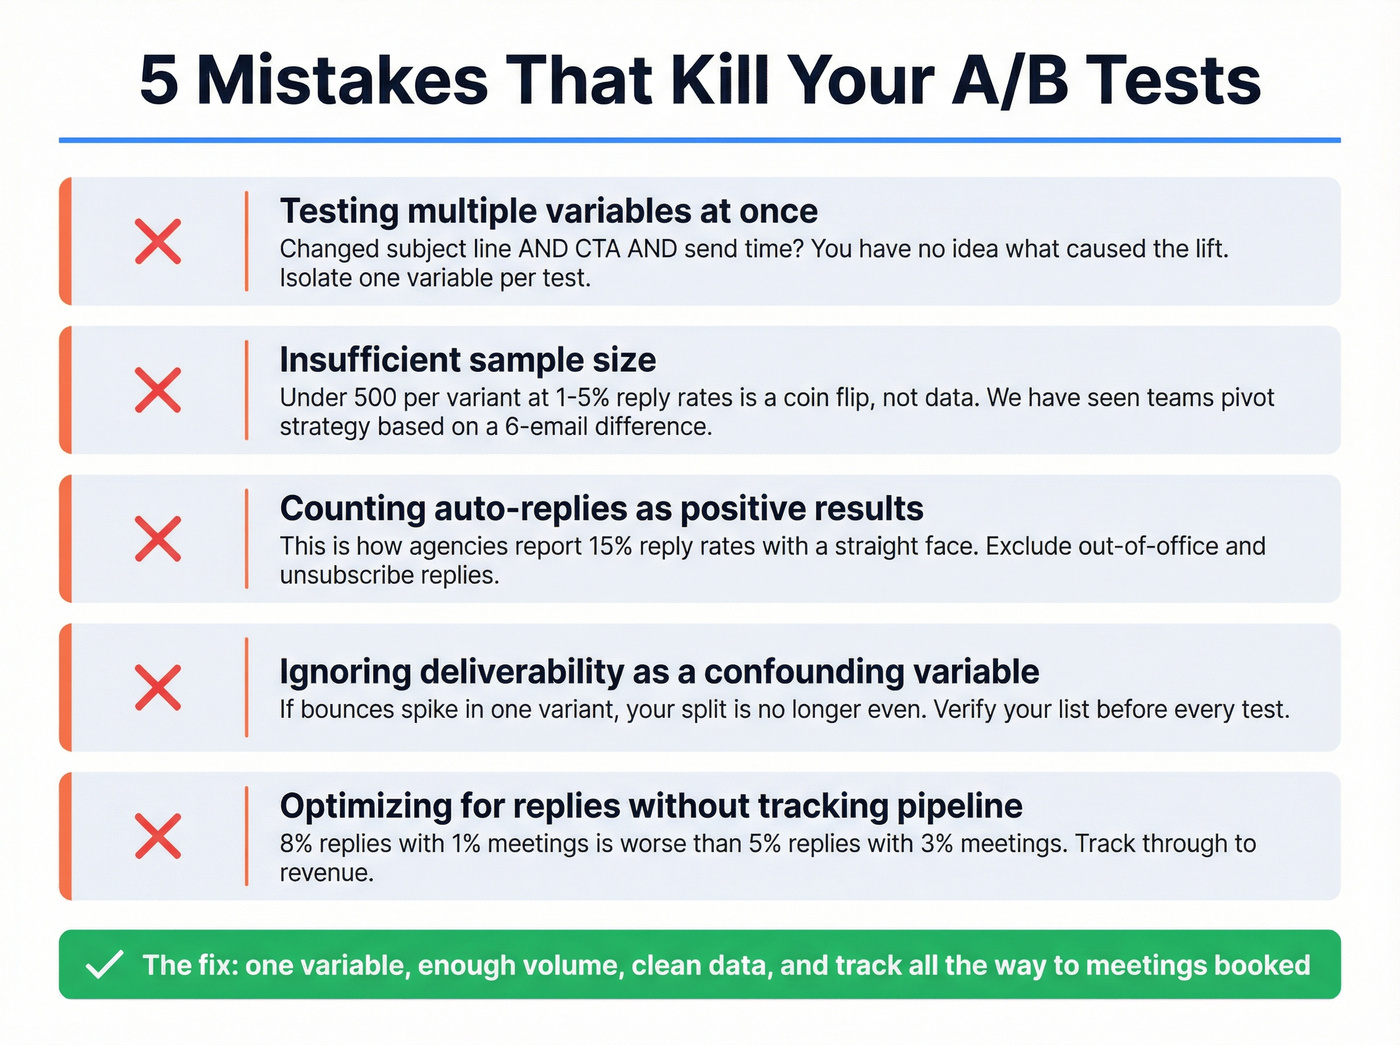
Insufficient sample size. Under ~500 per variant rarely produces statistically reliable results at 1-5% reply rates. We've watched teams make major strategic pivots based on a 6-email difference between variants. Don't be that team.
Counting auto-replies as positive results. This is how agencies report 15% reply rates with a straight face.
Ignoring deliverability as a confounding variable. If your hard bounces spike, no subject line test will produce reliable data. Verify your list before launching any test - bad data is the silent confounder that invalidates everything downstream. (Use an email checker tool to catch issues before you send.)
Optimizing for reply rate without tracking meetings or pipeline. The metric that matters is revenue, not inbox activity. Skip this mistake and you'll save yourself months of misdirected effort.
This article proves targeting beats subject lines every time. Prospeo gives you 30+ filters - buyer intent, job changes, tech stack, funding, headcount growth - so you can split-test the variable that actually moves reply rates. At $0.01 per email, you can afford the volume real A/B tests demand.
Test smarter segments, not just smarter subject lines.
FAQ
What's a good reply rate in 2026?
Average is 3.43%, top-quartile senders hit 5.5%+, and the top 10% exceed 10.7% according to Instantly's 2026 benchmark data. Positive reply rate is what actually matters - expect only 20-40% of total replies to be genuinely interested.
How many emails do I need per variant?
At a 3% baseline, you need ~1,000+ emails per variant to detect a 30%+ lift with 95% confidence. For smaller improvements in the 10-20% range, plan for 5,000-20,000 per variant. Use the Evan Miller calculator for precise numbers.
Should I test subject lines or body copy first?
Neither. Test targeting and offer first - they produce the largest lifts by far. Once those are locked, test personalized subject lines, then body copy. Most teams waste their limited send volume on low-impact subject line tweaks when the real problem is they're emailing the wrong people.
How do I keep bounce rates from ruining my tests?
Use a verification tool with a short refresh cycle. Prospeo's 5-step verification process and 7-day data refresh keep bounce rates under 4% for most teams, compared to the 6-week refresh cycle that's standard with other providers. Verify every list before sending - not after your test results look weird.