Demand Generation Pipeline: A System, Not a Strategy List
Your VP of Sales just told the board that marketing's leads are garbage. Again. Meanwhile, marketing contributes nearly 50% of pipeline across most B2B companies, and 68% of marketers say their pipeline is unpredictable. The disconnect isn't effort - it's architecture. A demand generation pipeline is a measurable system with stages, conversion rates, and velocity. It's not a blog post listing 14 tactics you should "consider." (If you need examples of what “good” looks like, see demand generation programs that actually worked.)
Here's what actually moves the number: know your conversion rates at every stage, calculate your pipeline velocity today, and fix the bottleneck. For most teams, that bottleneck is MQL-to-SQL conversion or bad contact data rotting everything downstream.
What a Revenue Waterfall Actually Is
A pipeline isn't a buyer journey. Forrester's B2B Revenue Waterfall draws this line clearly: a buyer journey maps the prospect's external experience, while a revenue waterfall tracks how demand flows through your organization internally. Conflating the two is how teams end up with stages nobody agrees on. (If your stages are mapped to the wrong thing, revisit your B2B buyer journey model.)
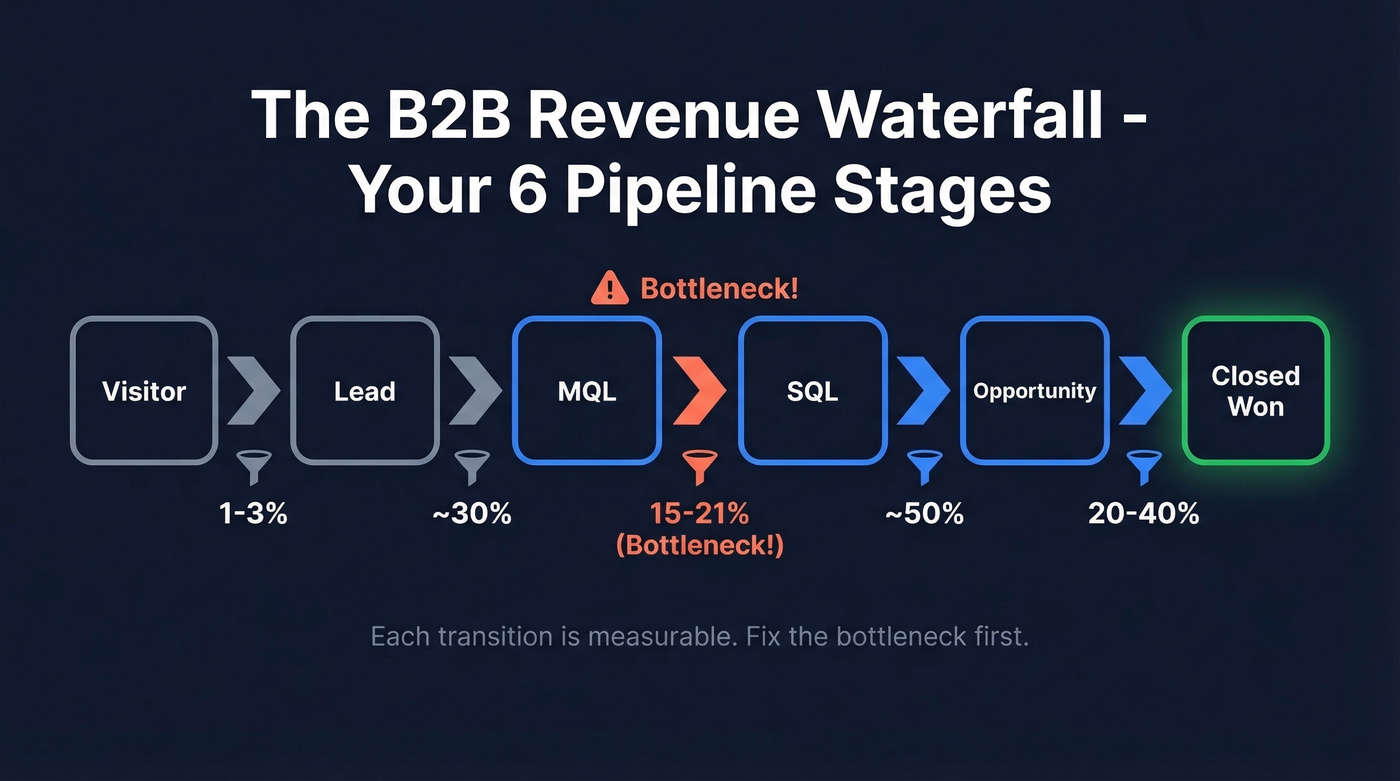
The operational model most B2B teams should start with has six stages: Visitor, Lead, MQL, SQL, Opportunity, Closed. Each transition has a measurable conversion rate, and each rate tells you where your system is leaking.
Browse any B2B sales community and the same complaint surfaces: sales rejects the majority of MQLs because the definition was never agreed upon. That's a pipeline architecture problem, not a lead quality problem. (This is exactly what B2B marketing and sales alignment is meant to prevent.)
Conversion Benchmarks by Channel
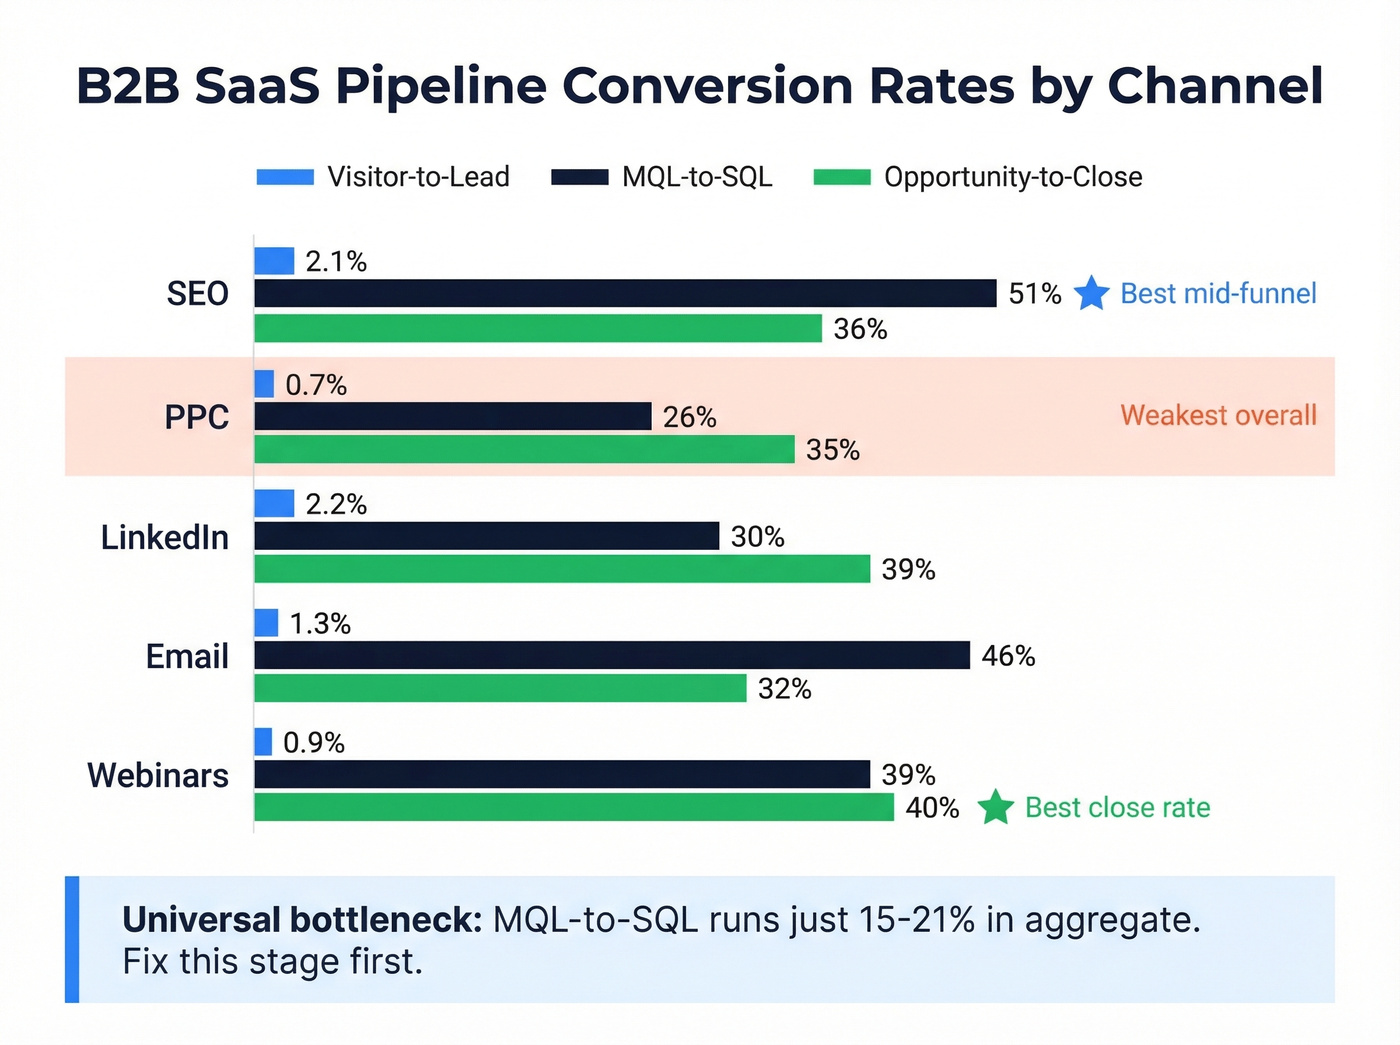
These benchmarks come from First Page Sage's B2B SaaS dataset across 50+ companies:
| Channel | Visitor-to-Lead | MQL-to-SQL | Opportunity-to-Close |
|---|---|---|---|
| SEO | 2.1% | 51% | 36% |
| PPC | 0.7% | 26% | 35% |
| 2.2% | 30% | 39% | |
| 1.3% | 46% | 32% | |
| Webinars | 0.9% | 39% | 40% |
SEO and email lead the mid-funnel - MQL-to-SQL conversion at 51% and 46% respectively. Webinars show the strongest close rate at 40%. PPC underperforms across the board.
The universal bottleneck across all channels is MQL-to-SQL, running 15-21% in aggregate. If you fix one stage this quarter, fix that one. (To go deeper on what to track, use a demand generation metrics framework.)
Pipeline Velocity Formula
This formula turns your pipeline from a dashboard decoration into a revenue predictor:
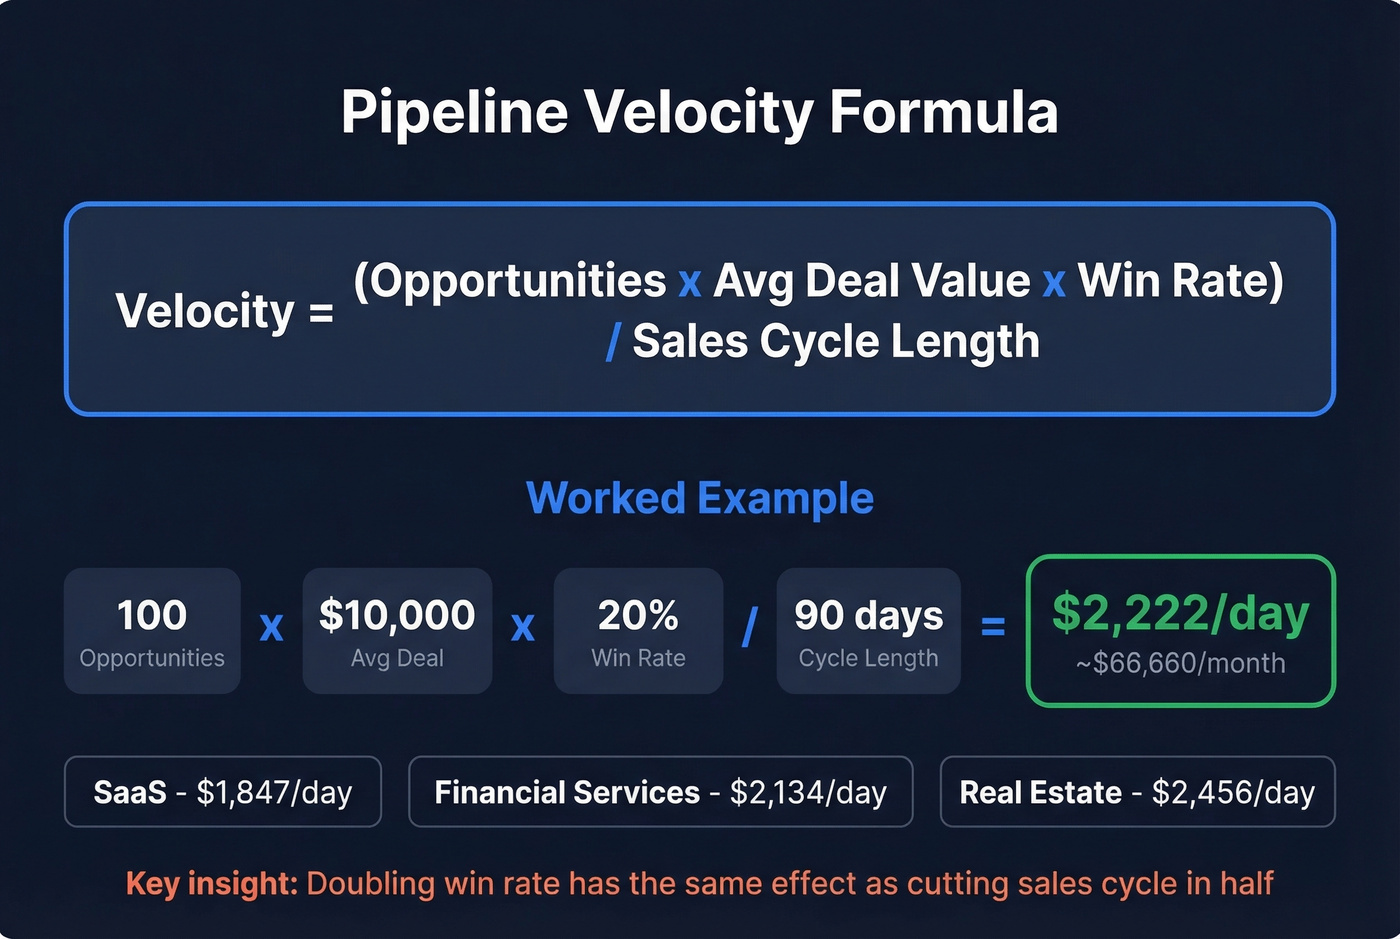
Pipeline Velocity = (Opportunities x Avg Deal Value x Win Rate) / Sales Cycle Length
Worked example: 100 opportunities x $10,000 average deal x 20% win rate / 90 days = $2,222/day (~$66,660/month).
Here's the insight that should change how you prioritize: doubling your win rate has the same mathematical effect as cutting your sales cycle in half. Most teams obsess over generating more opportunities when improving close rates would move the number faster and cheaper. Teams that align demand gen with sales objectives report 30-50% shorter sales cycles - a velocity lever that costs nothing to pull. (If you’re operationalizing this, it helps to think in RevOps terms.)
Industry benchmarks for context: SaaS runs about $1,847/day, Financial Services $2,134/day, Real Estate $2,456/day.
Pipeline velocity depends on every stage converting. When bounce rates hit 35%, your sequences fail and domain reputation tanks - killing velocity at the source. Prospeo's 98% email accuracy and 7-day data refresh keep your pipeline flowing clean.
Snyk dropped bounces from 35% to under 5% and added 200+ opportunities per month.
The 4 Channels That Drive 70%
70% of marketing-sourced pipeline comes from just four channels - SEO, events, social media, and paid search. Yet 50% of companies spread budget across 11-15 channels. The math doesn't work. (If you’re rationalizing spend, start with the B2B marketing channels that consistently drive pipeline.)
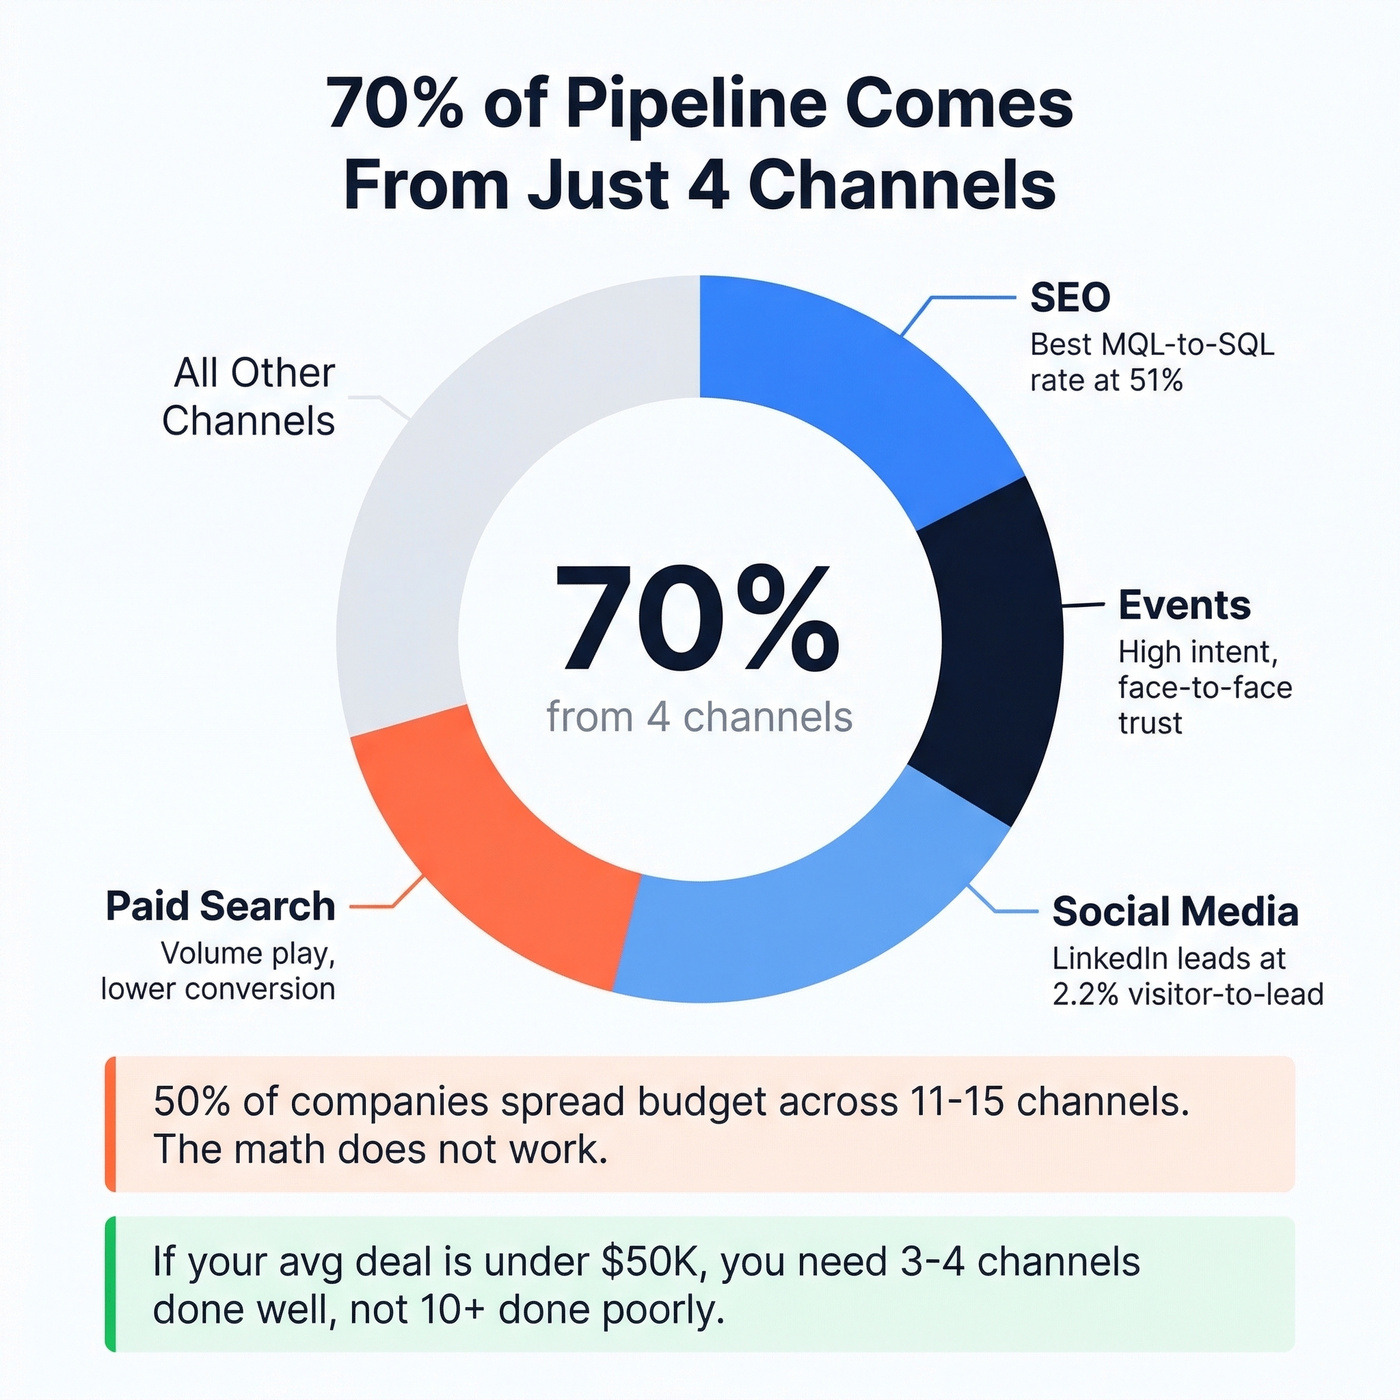
If your average deal size is under $50K, you don't need more than 3-4 channels. You need 3-4 channels done well. We've watched teams running 10+ channels get outperformed by focused competitors with half the headcount. FullFunnel's case study backs this up: by concentrating on social selling and ABM, they generated 9 enterprise-qualified opportunities and closed 3 contracts at 10x their previous ACV. (If you’re building that motion, borrow from proven ABM strategy playbooks.)
The lesson is simple. Depth on fewer channels beats shallow coverage across many, every time.
Mistakes That Kill Pipeline Performance
Volume over quality. Only 27% of B2B leads are sales-ready when they first engage. Flooding sales with raw leads builds resentment, not revenue.
Sales-marketing misalignment. More than half of B2B organizations admit marketing and sales aren't aligned. Aligned teams close deals 67% more efficiently. One shared definition of "sales-ready" is worth more than a 50-page SLA document nobody reads. (If you need a practical process, use a how to align sales and marketing checklist.)
Nurture that isn't nurture. When 73% of leads aren't ready to buy and your nurture is a 3-email drip, they go cold. That's abandonment with extra steps.
Overcomplicated martech. Gartner estimates nearly 25% of martech spend is wasted on duplicated or underused tools. We've seen teams running 8 tools that could be replaced by 3, and the consolidation alone improved their pipeline reporting because data finally lived in one place. (A marketing data platform can help centralize and govern this.)
Bad contact data. This is the silent pipeline killer. When bounce rates climb into the 30-40% range, sequences fail, domain reputation degrades, and velocity collapses. Snyk's team experienced exactly this - bounce rates of 35-40% before switching to Prospeo, which dropped bounces to under 5%. AE-sourced pipeline jumped 180%, generating 200+ new opportunities per month. Bad data doesn't just waste credits. It poisons every stage downstream. (If you’re evaluating providers, compare sales databases by accuracy and refresh rate.)

How to Measure Demand Gen Impact
Let's be honest: if your marketing team reports on MQLs instead of pipeline value, you're measuring the wrong thing. 25% of companies still evaluate marketing on MQLs generated rather than pipeline created. That's like judging a restaurant by how many people walk in the door instead of how many pay the check. (A better north star is marketing sourced pipeline.)
For B2B teams with 60+ day sales cycles, W-shaped attribution is a strong default. It gives weighted credit to first touch, lead creation, and opportunity creation - the three moments that actually matter. Single-touch models lie to you. Linear models dilute signal into noise. (If you want to choose a model deliberately, start with pipeline attribution.)
And none of it works without clean, centralized data. If each platform claims 100% credit, your attribution is fiction.
Audit Your Demand Generation Pipeline This Week
Skip the quarterly planning cycle. You can run this audit in a single afternoon:
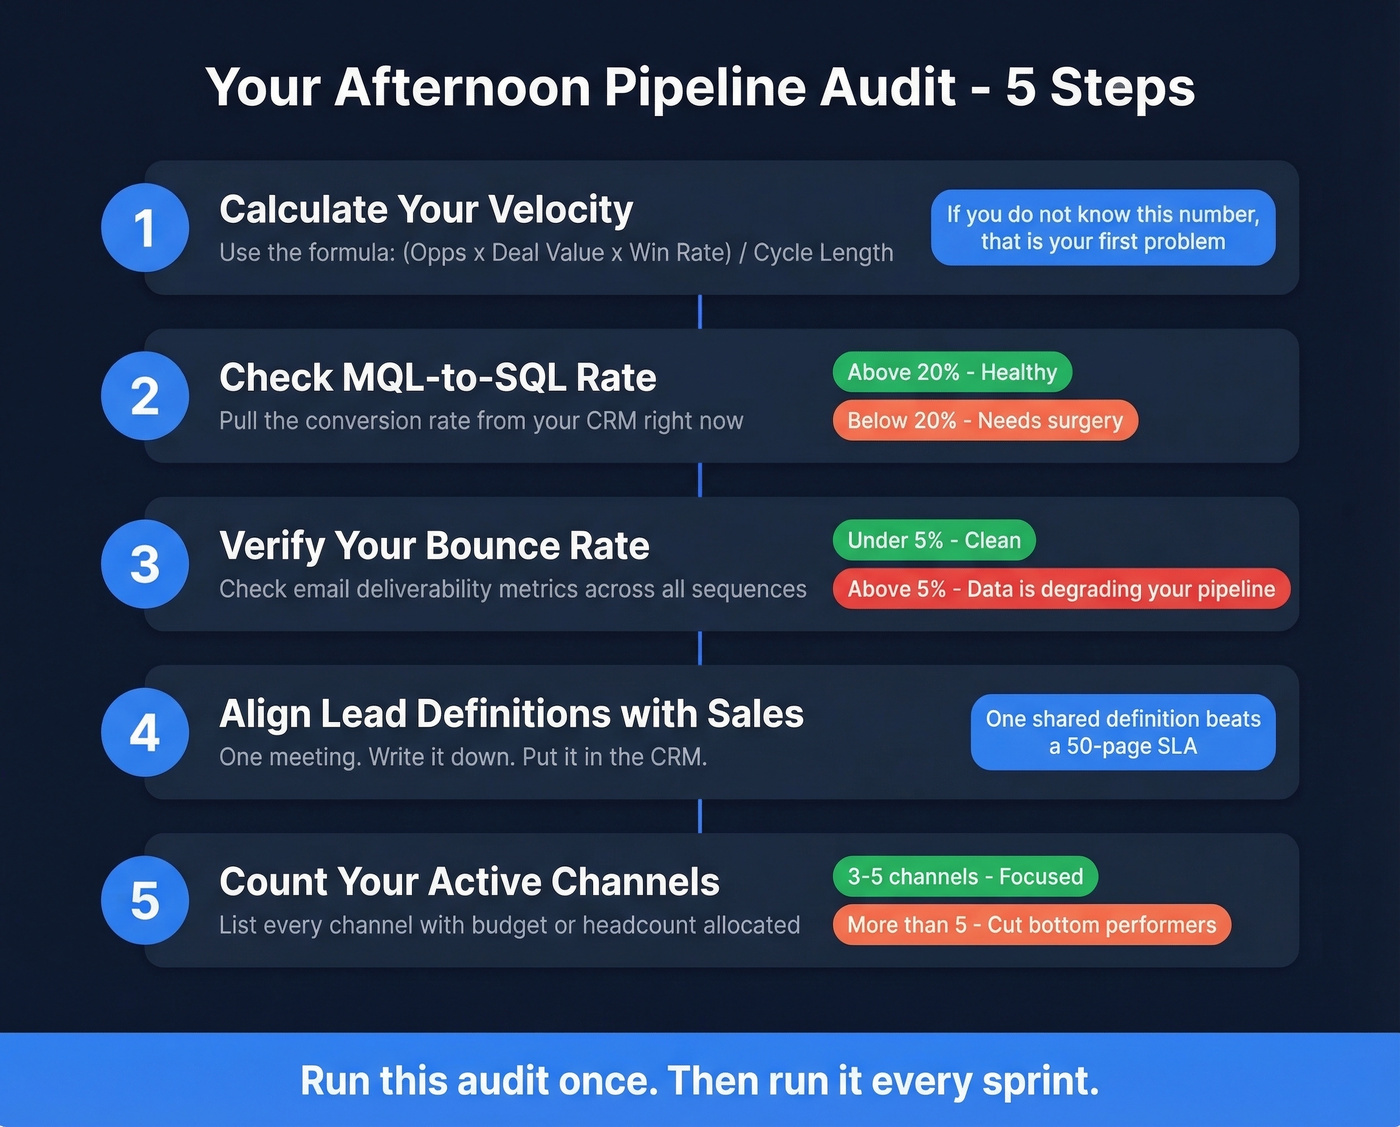
- Calculate your velocity using the formula above. If you don't know the number, that's your first problem.
- Check your MQL-to-SQL rate. Below ~20% usually means your lead definitions need surgery.
- Verify your bounce rate. Above 5% means your contact data is degrading your pipeline and sender reputation.
- Align on lead definitions with sales. One meeting. Write it down. Put it in the CRM.
- Count your active channels. More than 5? Cut the bottom performers and reinvest.
Run this audit once. Then run it every sprint. The teams that treat their demand generation pipeline as a living system - measured weekly, tuned monthly - are the ones that stop getting called out in board meetings.
You just calculated your pipeline velocity. Now protect it. Bad contact data is the silent bottleneck most teams miss - it degrades every stage downstream. Prospeo gives you 300M+ verified profiles at $0.01/email, so your MQL-to-SQL rate reflects lead quality, not data rot.
Stop losing pipeline to bad data. Start your audit with contacts you can trust.