How to Build a Drip Campaign Flowchart That Actually Drives Revenue
The top 10% of email workflows generate $16.96 in revenue per recipient. The average? $1.94. That's a 9x gap, and it has almost nothing to do with copywriting or subject lines. It comes down to how the drip campaign flowchart is built.
With 392.5 billion emails sent daily in 2026, your automated workflow design is the difference between inbox and oblivion. Automated sequences up to 30x more revenue per recipient than one-off campaigns - but most flowcharts fail before a single email sends. The logic is too simple, the branching is nonexistent, or the contact list is full of dead addresses that tank deliverability from day one.
Here's the short version if you're in a rush:
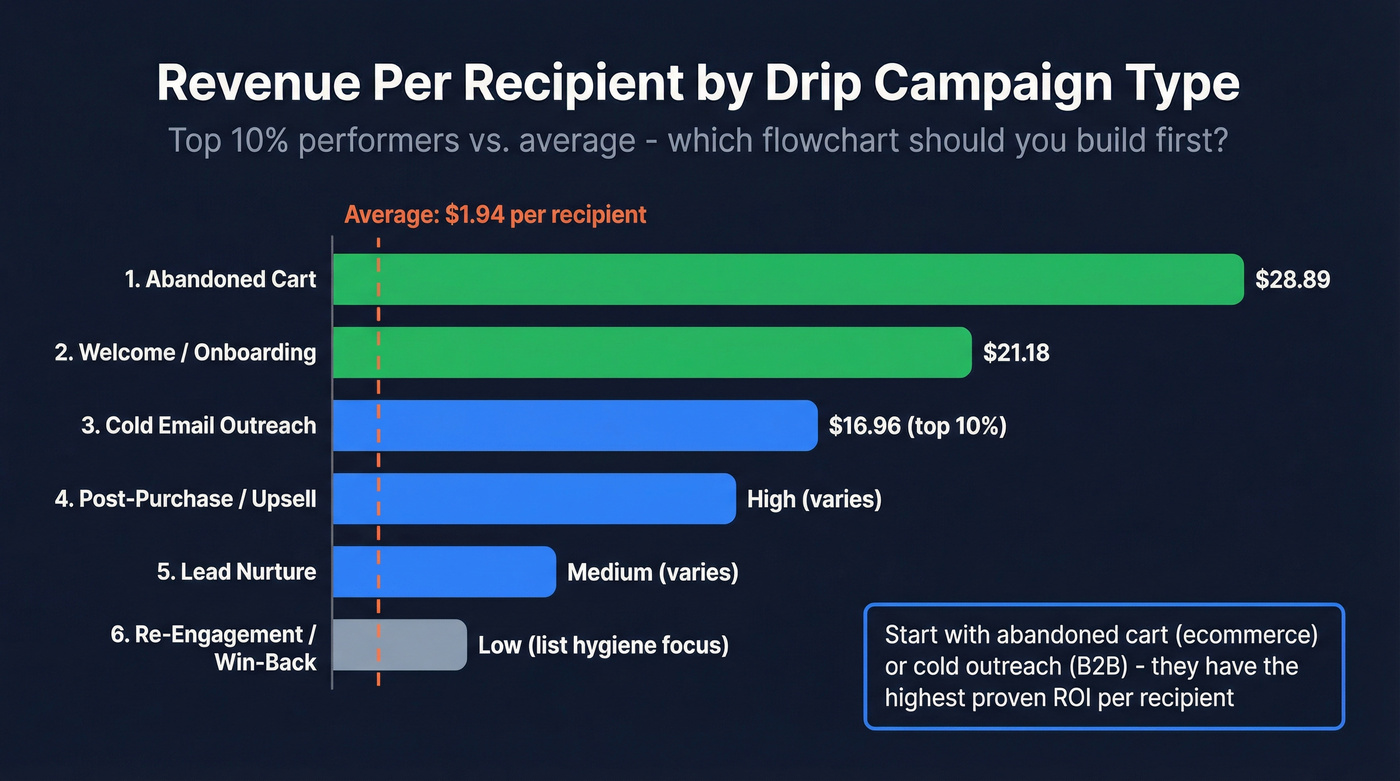
- Start with abandoned cart (ecommerce) or cold email outreach (B2B). Abandoned cart flows generate $28.89 per recipient for top performers - the highest of any automation type.
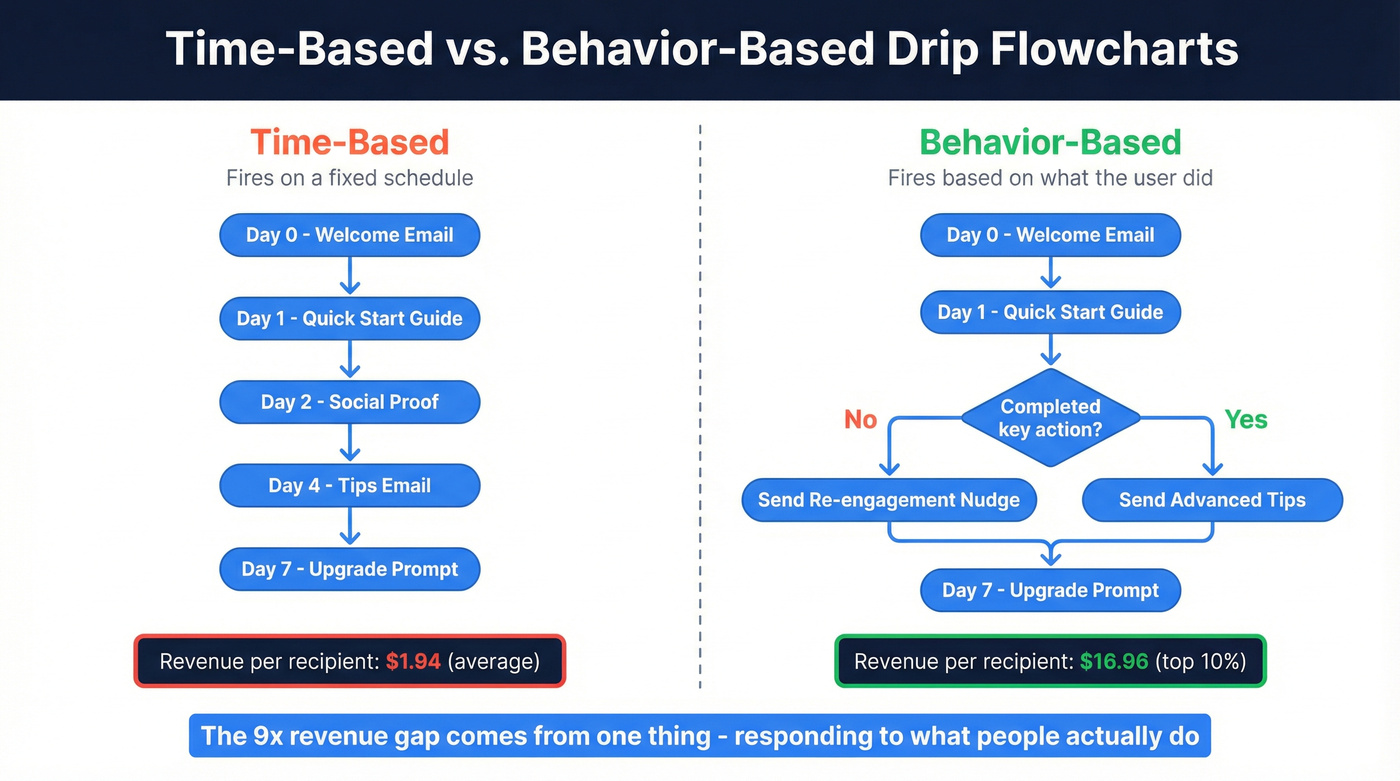
- Design around behavior, not time. The single biggest design decision in your flowchart is whether emails fire based on what the contact did or just how many days passed. Behavior-based branching is what creates that 9x revenue gap.
What Is a Drip Campaign Flowchart?
A drip campaign flowchart is a visual map of every email, decision point, delay, and exit ramp in an automated sequence. It's the blueprint you build before you touch your marketing automation platform. Without one, you're configuring workflows blind - and debugging them later is a nightmare.

The key distinction: a drip campaign is a series of pre-written messages sent at a specific cadence, triggered by a single event. That's different from a one-off triggered email (like a password reset) or a manual broadcast. Drip campaigns build on each other. Each message assumes the recipient saw - or didn't see - the previous one.
Every flowchart uses the same five symbols:
| Symbol | Shape | What It Represents | Example |
|---|---|---|---|
| Start/End | Oval | Entry or exit point | "User signs up" |
| Process | Rectangle | An action or email | "Send welcome email" |
| Decision | Diamond | A yes/no branch | "Opened email 1?" |
| Input/Output | Parallelogram | Data in or out | "Add to CRM segment" |
| Arrow | Line | Flow direction | Connects all nodes |
If your flowchart doesn't have at least two diamonds, it's not a drip campaign. It's a scheduled blast with extra steps.
Time-Based vs. Behavior-Based Flowcharts
This is the design decision that matters most, and most teams get it wrong.
Use time-based flowcharts when:
- You're running a simple educational drip (e.g., a 5-day course)
- Your audience is homogeneous and the content doesn't depend on engagement
- You don't have the data infrastructure to track in-app behavior
Use behavior-based flowcharts when:
- You're doing anything related to revenue - onboarding, cart recovery, cold outreach, upsell
- You have access to engagement data (opens, clicks, page visits, product usage)
- You want to be in the top 10%, not the average
Here's a real email drip campaign flowchart example: a PLG SaaS company runs a 5-email onboarding sequence. Emails fire at Immediate, Day 1, Day 2, Day 4, Day 7. Open rates run 72%, 58%, 52%, 45%, 48%. But the Day 4 email only fires if the user hasn't invited their team yet. That single behavioral trigger - checking whether the user completed a key activation step - is the difference between a generic drip and a sequence that drives product adoption.
Enterprise SaaS sequences that use milestone-based triggers see 85% open rates on Email 1, which is 13 points higher than the PLG example, because the timing adapts to each user's progress rather than following a fixed calendar.
The gap between $16.96 and $1.94 per recipient isn't about subject lines. It's about whether your flowchart responds to what people do.
Your drip flowchart is dead on arrival if bounce rates exceed 2%. Prospeo's 5-step email verification delivers 98% accuracy - so your sequences actually reach inboxes instead of destroying sender reputation.
Fix your list before you fix your flowchart. Start with 100 free credits.
6 Drip Campaign Flowchart Templates You Can Copy
1. Cold Email Outreach Flowchart
Cold email is where most B2B teams start, and the math is compelling. A single cold email averages a 4.5% reply rate. A 10-email sequence generates a cumulative 22.37% reply rate - nearly 5x the response from the same list.

Here's the flowchart, node by node:
Build prospect list. Source verified emails before anything else. Bounce rates above 2% will crater your sender reputation and kill the entire sequence before it gains momentum.
Send Email 1 (personalized intro, single CTA). Wait 2 days.
Decision diamond - did they reply?
- Yes: Check sentiment. Positive = schedule demo. Negative/opt-out = remove from sequence.
- No: Continue to Email 2.
Send Email 2 (value-add, case study or social proof). Wait 4 days.
Decision diamond - reply? Same branching logic. No reply leads to Email 3.
Send Email 3 (different angle, address a specific objection). Wait 4 days.
Emails 4-9 follow the same pattern with 5+ day spacing. Each email should shift the angle - don't just "bump" the thread.
A/B test branch: After Email 1, split 50/50 on subject line variants for Email 2. Route the winner forward for Emails 3+. This is where most cold email flowcharts stop being basic and start generating data you can actually use. (If you want a tighter framework, use sales sequence best practices as your guardrails.)
Exit ramp: After a clear rejection or opt-out, remove immediately. After 9 follow-ups with no engagement, move to a long-term nurture list or archive. Total sequence duration: 10-25 days.
2. Welcome / Onboarding Flowchart
Welcome workflows are the second-highest revenue generator at $21.18 per recipient for top performers, and they convert at an absurd rate - 58.26% click-to-conversion. If you're only going to build one marketing automation, this is it.
Immediate (within minutes of signup): Welcome email. Confirm the subscription, set expectations, deliver any promised lead magnet. This email gets the highest open rate in the entire sequence - 72% in one PLG SaaS benchmark.
Day 1: Quick-start guide. One specific action the user should take. Single CTA.
Day 2: Social proof or use case. Show what other users have accomplished.
Day 4: Behavioral branch - the critical node. Has the user completed the key activation step? If yes, send advanced tips. If no, send a re-engagement nudge focused on that specific step.
Day 7: Upgrade prompt or next-level feature introduction. By now, engaged users have experienced enough value to consider expanding their usage. The open rate actually recovers slightly here - the unengaged have already dropped off, and you're talking to people who genuinely care.
3. Abandoned Cart Flowchart
This is the money flowchart. Top performers generate $28.89 per recipient - more than any other automation type. Targeted abandoned cart campaigns recover 5-15% of lost sales. And yet, across 497 brands studied by TargetBay, the average sequence is only 1.52 emails. Most brands are leaving enormous revenue on the table.

The 70% cart abandonment rate means this flowchart will fire constantly. Here's the 3-email structure:
Email 1 - 1 hour after abandonment: Simple reminder with product image. No discount. Just "You left something behind." Over 90% of brands include an offer in their cart sequence - many in Email 1, which I'd argue is premature. You're training customers to abandon carts for discounts.
Decision diamond: Cart value above $100?
- Yes: Route to a higher-touch path with stronger incentives in Emails 2-3.
- No: Standard path.
Email 2 - 24 hours: Social proof and scarcity. Customer reviews. For high-value carts, add a small incentive (free shipping, 5% off).
Email 3 - 3-5 days: Final notice with a time-limited offer. For carts over $100, make it meaningful (10-15% off). For smaller carts, free shipping is usually enough.
Best send time for cart recovery emails: 6-9 PM local time, with 7 PM as the peak.
Here's the deliverability reality: inbox placement drops from 46% on Email 1 to 28% on Email 2 to 15% on Email 3. Going beyond three emails hits severe diminishing returns. Cap it. Build an exit ramp after Email 3 that moves non-converters to a general re-engagement list.
For mobile-dominant audiences, tighten the first send to 15-30 minutes. The closer to the abandonment moment, the higher the recovery rate.
4. Lead Nurture Flowchart (Post-Download / Webinar)
The trigger here is a content interaction - someone downloaded your whitepaper, attended your webinar, or signed up for a resource. They've raised their hand, but they aren't sales-ready yet.
The key design principle: lead nurture flows should have multiple exit points that route to sales, not just one at the end.
Trigger fires (form submission, webinar attendance). Immediately send a thank-you email with the promised content.
Day 2: Related content that goes deeper on the same topic. If they downloaded a guide on "ABM strategy," send a case study showing ABM results.
Day 5: Decision diamond - engagement score. Has the contact opened both previous emails AND visited the pricing page?
- Yes: Route to sales handoff. Create a task in CRM, notify the assigned rep, send a "let's talk" email from a human sender.
- No: Continue nurture path.
Day 8: Third-party validation - analyst report, industry benchmark, or customer testimonial.
Day 14: Soft CTA. "Want to see how this works for your team?" If no engagement after this email, move to a long-term nurture cadence (monthly or bi-weekly).
5. Re-Engagement / Win-Back Flowchart
Trigger: No open or click in 60-90 days.
Skip this flowchart if your list is under 500 contacts. At that size, a personal email from a human will outperform any automation. This flow is for lists where manual outreach isn't feasible.
Email 1 - "We miss you": Acknowledge the silence. Highlight what's new since they last engaged. Keep it warm, not desperate.
Email 2 (5-7 days later) - Exclusive offer: Give them a reason to come back. Discount, free trial extension, early access to a new feature. For high-value segments, add an SMS branch here - SMS open rates hit 98% vs. ~20% for email, so a text message can break through when email can't.
Email 3 (7-10 days later) - Final notice: "Should we remove you from our list?" This isn't a bluff - actually remove non-responders. Your deliverability depends on a clean, engaged list.
Decision diamond after Email 3: Did they engage with any of the three emails?
- Yes: Move back to active segment. Reset engagement tracking.
- No: Suppress from all campaigns. Remove from active list.
This flowchart is as much about list hygiene as it is about revenue.
6. Post-Purchase / Upsell Flowchart
Cometeer, the coffee company, nails this. After your first order, they send brewing tips tailored to your specific capsules, then a referral prompt, then a replenishment nudge timed to when you're running low. It feels helpful, not salesy - and that's the entire design philosophy for post-purchase flows.
Top performers generate $5.14 per recipient. That's lower than cart or welcome flows, but the audience is already a customer - the trust barrier is gone.
| Timing | High-Value Path | Standard Path | |
|---|---|---|---|
| Order confirmed | Confirmation + delivery timeline | Same | Same |
| Delivery + 2 days | Follow-up | Personalized "get the most out of [product]" guide | "How's your order?" + review request |
| 14 days | Cross-sell/upsell | Category-specific recommendation | Related accessories |
| 30 days | Referral prompt | Incentive for both parties | Incentive for both parties |
| 60-90 days | Replenishment/renewal | Renewal nudge | Replenishment reminder |
Branch by product category and purchase value early in the flow - a first-time buyer of a $20 item needs a completely different sequence than a repeat customer who just spent $500.
Branching Logic Deep-Dive
Once you've mapped your flowchart, the branching logic is where it gets real. HubSpot and Customer.io have the most sophisticated branching, and they approach it differently.
| Feature | HubSpot | Customer.io |
|---|---|---|
| Binary branch | If/then | True/False |
| Multi-path | Up to 250 branches | Multi-Split |
| A/B testing | Random distribution | Random Cohort |
| Logic type | AND/OR (up to 20) | JSON dot notation |
| Tier required | Professional+ | Growth+ |
HubSpot's single-property branch supports up to 250 paths - useful for routing contacts by region, industry, or product interest. Their AND/OR branches handle more complex logic, like "opened Email 1 AND visited pricing page OR requested a demo."
Customer.io's True/False branches are simpler but faster to configure. Their Multi-Split lets you create multiple paths with independent conditions - a series of if/then checks stacked together.
The timing detail that matters: Add an 80-minute delay before any branch that depends on analytics data (page views, event tracking). Analytics platforms need time to process. For email-engagement branches (opened, clicked), a 5-minute delay is enough.
Here's a practical example: in a welcome sequence, after Email 2, add a random distribution branch - 50% get Subject Line A for Email 3, 50% get Subject Line B. After 48 hours, check click rates. Route the winning variant forward for the rest of the sequence. This is how you systematically improve your flowchart over time instead of guessing. (If you're formalizing this, borrow a rubric from A/B testing lead generation campaigns.)
Why Your Flowchart Fails Before Email 1
You can build the most sophisticated automated workflow in the world, and it won't matter if 35% of your email addresses are invalid.
I've seen this exact scenario play out: a team launches a 5-email cold outreach sequence to 5,000 contacts. Email 1 bounces on 1,800 of them. Their sender reputation craters. By Email 3, even the valid addresses are landing in spam. The flowchart was perfect. The data was garbage.
Bounce rates must stay below 2% to protect sender reputation. That's not a guideline - it's a hard threshold. Above 2%, ESPs start throttling your sends. Above 5%, you're looking at blacklisting. And remember the deliverability decay from abandoned cart flows: inbox placement drops from 46% to 28% to 15% across a 3-email sequence under normal conditions. Compound that with bad data, and your third email might as well not exist.
The fix is simple but non-negotiable: verify every email address before it enters your flowchart. Tools like Prospeo handle this with a 5-step verification process - catch-all handling, spam-trap removal, honeypot filtering - delivering 98% email accuracy with a 7-day data refresh cycle. The free tier covers 75 email verifications per month, which is enough to test your first campaign without risking your sender reputation. (If you need a broader shortlist, start with email verifier websites and compare limits.)
Best Tools for Building and Executing Drip Campaigns
In our experience, teams that skip the flowchart step and jump straight into their automation platform spend 3x longer debugging. On Reddit, one Salesforce user described spending weeks trying to build drip logic inside Flow because they couldn't afford Pardot. Don't do this. A $9/month diagramming tool plus a free-tier automation platform will get you further, faster.
Here's what's worth your time:
| Tool | Best For | Free Tier | Paid Price |
|---|---|---|---|
| Lucidchart | Solo operators | 3 docs | $9/mo |
| Miro | Team collaboration | 3 boards | $8/user/mo |
| Whimsical | Clean aesthetics | 3 boards | $10/user/mo |
| SmartDraw | Speed | None | $9.95/user/mo |
| yEd | Zero budget | Full features | Free |
| Mermaid Chart | Devs/text-first | 5 diagrams | $6.67/user/mo |
My pick for most teams: Lucidchart. It's the industry standard for a reason - the drip email marketing flow chart templates get you 80% of the way there, and the data-linking features let you import contact segments directly into your flowchart. The free tier (3 documents) is enough for most campaigns.
For collaborative teams: Miro. If your flowchart needs input from marketing, sales, and ops, Miro's real-time collaboration is unmatched.
For zero budget: yEd. Fully free with advanced features that rival paid tools. The interface is dated, but the functionality is there.
Already on Zapier? Zapier Canvas lets you map automation logic visually and then wire it directly to Zaps. If your drip campaign lives in Zapier anyway, this eliminates the translation step between diagram and execution.
Skip the flowchart entirely? If you're running ecommerce on Shopify or WooCommerce, Drip offers 16 pre-built workflow templates - welcome series, abandoned cart, post-purchase, win-back. You can be live in an hour without drawing a single node.
Benchmarks to Build Into Your Decision Nodes
Your flowchart's decision diamonds need thresholds. Here are the numbers to use:
| Metric | Benchmark |
|---|---|
| Avg open rate | 39.26% |
| Avg click rate | 6.21% |
| Drip vs. non-drip CTR | +119% |
| Cart abandonment rate | ~70% |
| Bounce rate ceiling | <2% |
Revenue per recipient by workflow type (top 10%):
| Workflow | Revenue/Recipient |
|---|---|
| Abandoned cart | $28.89 |
| Welcome | $21.18 |
| Browse abandonment | $7.21 |
| Post-purchase | $5.14 |
Together, abandoned cart, welcome, and browse abandonment account for 87% of all automation-driven orders. If you're only building three flowcharts, build those three.
Industry matters too. Media/Publishing sees 43.16% open rates while E-Commerce sits at 35.66%. If your sequence is hitting below 30%, your flowchart needs a re-engagement branch - you're underperforming even the lowest industry benchmarks.
Look, if your deals typically close under five figures, you probably don't need a 12-node flowchart with multi-path branching. A 3-email behavior-based sequence with one decision diamond will outperform a complex flowchart that nobody maintains. Complexity is the enemy of execution. Build the simplest flowchart that includes at least one behavioral branch, measure it for 30 days, then add complexity where the data tells you to. (If you're tightening ops around this, treat it like data quality work, not “marketing tweaks.”)
Common Drip Campaign Flowchart Mistakes (and How to Fix Them)
Mistake 1: Designing 12-email marathons. Deliverability drops and reply rates plateau after 9 emails in cold outreach. For cart flows, the ceiling is 3. Build exit ramps, not marathons. If you're unsure on spacing, start from an email cadence baseline.
Mistake 2: Ignoring behavioral triggers. Sending the same flow to a cart abandoner and a first-time visitor is lazy. Your flowchart needs at least one behavioral decision diamond. Even a simple "opened Email 1?" branch doubles the relevance of everything downstream.
Mistake 3: No exit ramps. Contacts stuck in infinite loops destroy deliverability and annoy people. Every flowchart needs a clear end state: converted, opted out, or moved to a different segment. No exceptions.
Mistake 4: Never reviewing metrics. Only ~10% of marketers can effectively measure automation program impact. Build a review cadence - monthly at minimum. Check open rates against the 39.26% benchmark, click rates against 6.21%, and revenue per recipient against the workflow-specific numbers above. (You can structure this like email outreach analytics so it's not a vibe check.)
Mistake 5: Skipping data quality checks upstream. Your flowchart assumes every email address is real. If it isn't, nothing else matters. Verify before you send. Every time. Use an email verification list SOP so it’s repeatable.
Cold email sequences generate 22% reply rates - but only when emails land. Prospeo gives you verified contacts from 300M+ profiles at $0.01/email, refreshed every 7 days so your outbound drip campaigns hit real buyers.
Stop feeding dead addresses into your carefully designed sequences.
FAQ
How many emails should a drip campaign have?
Three to five emails works for most campaigns. Cold email sequences can stretch to 9 follow-ups - cumulative reply rates scale from 4.5% to 22.37% - but deliverability drops sharply after email 3 in cart and marketing flows. Build exit ramps at each stage rather than defaulting to long sequences.
Which drip campaign flowchart template generates the most revenue?
Abandoned cart flows generate $28.89 per recipient for top performers - the highest of any automation type. Welcome flows come second at $21.18. Together with browse abandonment ($7.21), these three workflow types account for 87% of all automation-driven orders.
What's the ideal bounce rate for a drip campaign?
Stay below 2%. Above that threshold, ESPs start throttling your sends. Above 5%, you risk blacklisting. Verifying your list before the first send protects the entire sequence downstream.
What's the best free tool for creating a drip campaign flowchart?
yEd is fully free with advanced features comparable to paid tools like Lucidchart and Miro. If you need real-time collaboration, Miro and Lucidchart both offer free tiers with up to 3 boards or documents - enough for most teams getting started.
How do I create a drip campaign flowchart from scratch?
Define your trigger event (signup, cart abandonment, form submission), then map the email sequence with at least one behavioral decision diamond between messages. Use a diagramming tool like Lucidchart or yEd to lay out the nodes, and always include exit ramps for contacts who convert, opt out, or stop engaging. The six templates above cover the most common use cases - pick the closest one and adapt it.