Email Outreach Analytics in 2026: What to Measure (and What to Ignore)
Most cold email dashboards are lying to you - politely. Apple Mail Privacy Protection makes opens noisy, security scanners inflate clicks, and "reply rate" is often divided by the wrong thing. If you want email outreach analytics you can actually run a business on, fix your denominators first, then measure outcomes.
Hot take: if your average deal size is small, you don't need a perfect engagement dashboard. You need three numbers that predict meetings, plus guardrails that keep you out of spam.
What you need (quick version)
Pick 3 weekly metrics and stop there
- Positive reply rate (on delivered)
- Meeting booked rate (from delivered)
- Inbox placement rate (inbox/delivered)
Say it out loud: Open rate isn't a KPI Track opens only as a diagnostic (and even then, treat it as noisy). If you’re still tempted, use a dedicated guide on open tracking to sanity-check what’s measurable.
Standardize denominators
- Delivered-based rates for outreach performance
- Sent-based rates for volume planning
- Never mix them in the same dashboard
Install guardrails before you scale
- Delivery rate ~98%
- Bounce rate <2% (if you’re seeing spikes, start with 550 recipient rejected triage)
- Spam complaints <0.1% ideal / <0.3% guardrail
- Inbox placement <90% = investigate immediately (if you need the mechanics, see seed list testing)
Filter bots before you trust clicks
- Don't use clicks for lead scoring or A/B tests until you've filtered scanners (CTR definitions matter - see click-through rate)
Build attribution once
- UTMs -> GA4 -> CRM campaign fields
- Validate in GA4 Realtime
- Don't tag internal links (it'll poison your data)
Report outcomes, not activity
- Replies -> meetings held -> opps -> revenue
- Activity metrics (sends, steps, opens) are for operators, not leadership
Those three weekly metrics are the whole game.
- Positive reply rate (delivered) tells you whether your targeting + offer resonates with humans. Not "engagement"--actual intent.
- Meeting booked rate (delivered) tells you whether your replies convert into calendar reality (and exposes handoff/follow-up problems).
- Inbox placement rate (inbox/delivered) tells you whether your program is even getting a fair shot.
Denominators are where teams accidentally gaslight themselves. Example: Campaign A delivers 980/1,000 and gets 20 positive replies (2.04% on delivered). Campaign B delivers 900/1,000 and gets 19 positive replies (2.11% on delivered). If you divide by sent, B looks worse (1.9%) and you might kill the better campaign - or miss that B has a deliverability problem.
If a guardrail breaks, don't "optimize copy." Pause scaling and triage in this order: bounces -> complaints -> inbox placement. Fix the thing that can burn your domain first (and if you suspect reputation issues, start with domain reputation).
Why opens (and many clicks) lie in 2026
Apple Mail Privacy Protection (MPP) didn't just reduce accuracy; it changed what an "open" means. Apple preloads tracking pixels through proxy infrastructure, masking IPs and generating machine opens that look human. Twilio's MPP explainer puts it plainly: open tracking isn't reliable, so teams should stop treating opens like a performance signal and move to stronger outcomes.
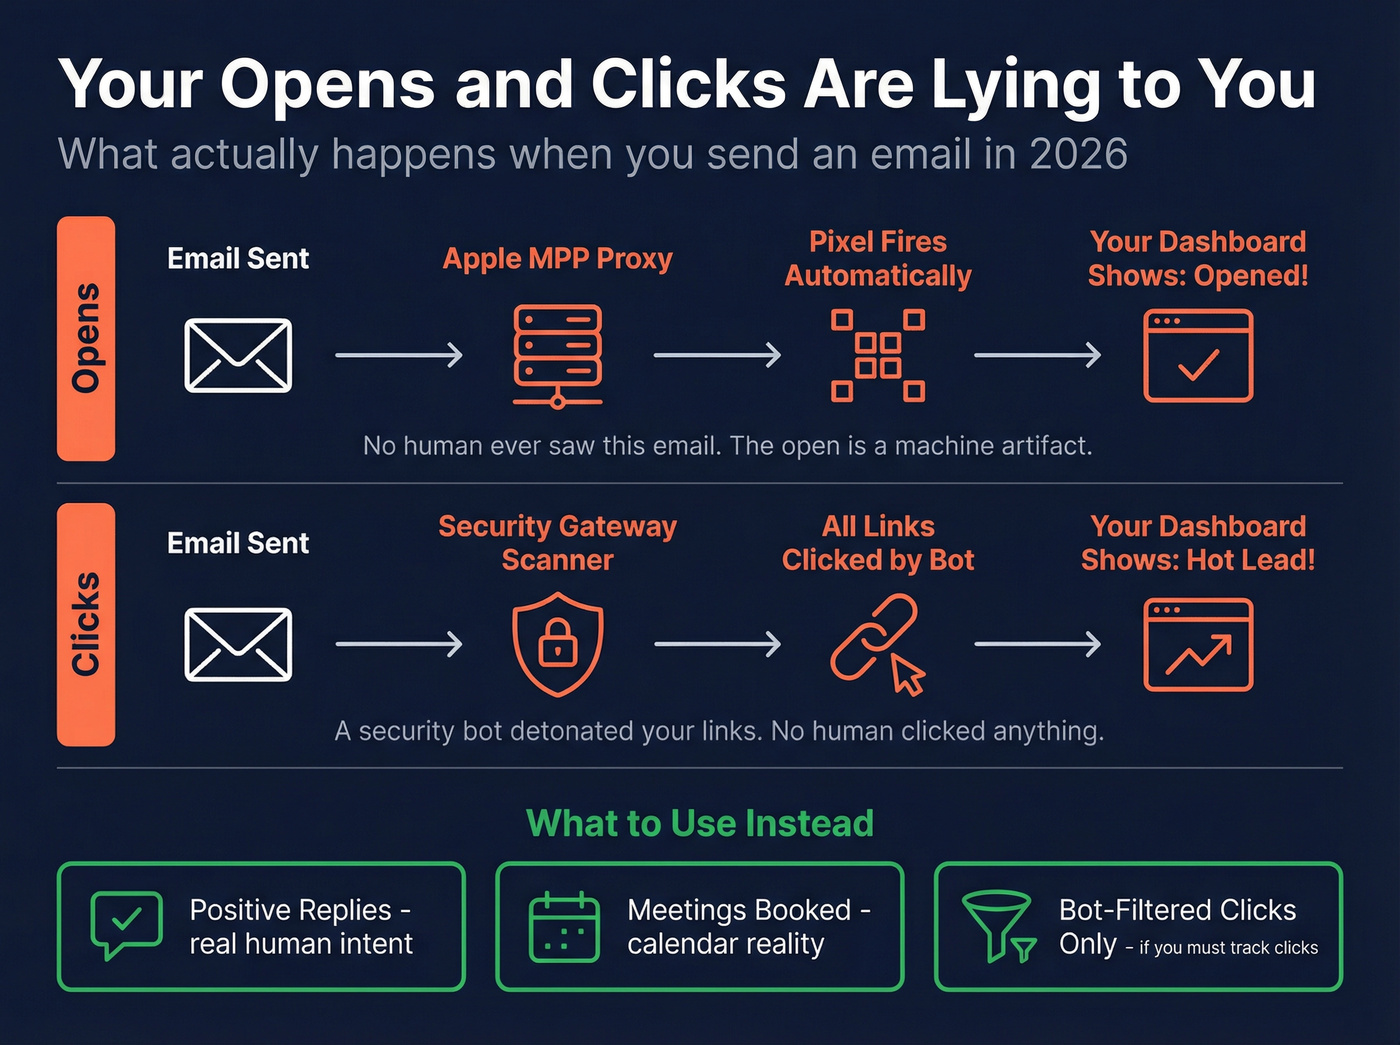
Clicks feel safer - until you look closely. Security gateways and inbox scanners click links to detonate them safely before a human ever sees the email, which inflates click-through rates, breaks A/B tests, and triggers false "hot lead" alerts.
The most painful version of this is open-triggered automation. It's easy to set up, it looks data-driven, and it's wrong.
Stop doing
- Routing leads to SDRs because they "opened 3 times"
- A/B testing subject lines using open rate as the winner (use a real framework for A/B testing instead)
- Scoring accounts based on opens + clicks without bot filtering
- Reporting "engagement" up the chain without tying it to meetings
Do instead
- Use reply and positive reply as your primary engagement signals
- Use meetings booked/held as your performance truth
- Use clicks only after filtering (timing + IP + user-agent patterns)
- Use GA4 conversions (demo request, signup, meaningful page depth) as the tie-breaker when replies are low-volume
One pattern I've seen too many times: a team celebrates a "lift" in opens, then wonders why meetings didn't move. They optimized for Apple's proxy and a corporate scanner, not for buyers.
What practitioners complain about (and they're right)
- "Our open rate is 70% but nobody replies." That's MPP + scanning.
- "Clicks look great but GA4 shows nothing." That's scanners + broken attribution.
- "Reply rate dropped overnight." That's usually inbox placement or list decay, not suddenly-bad copy.
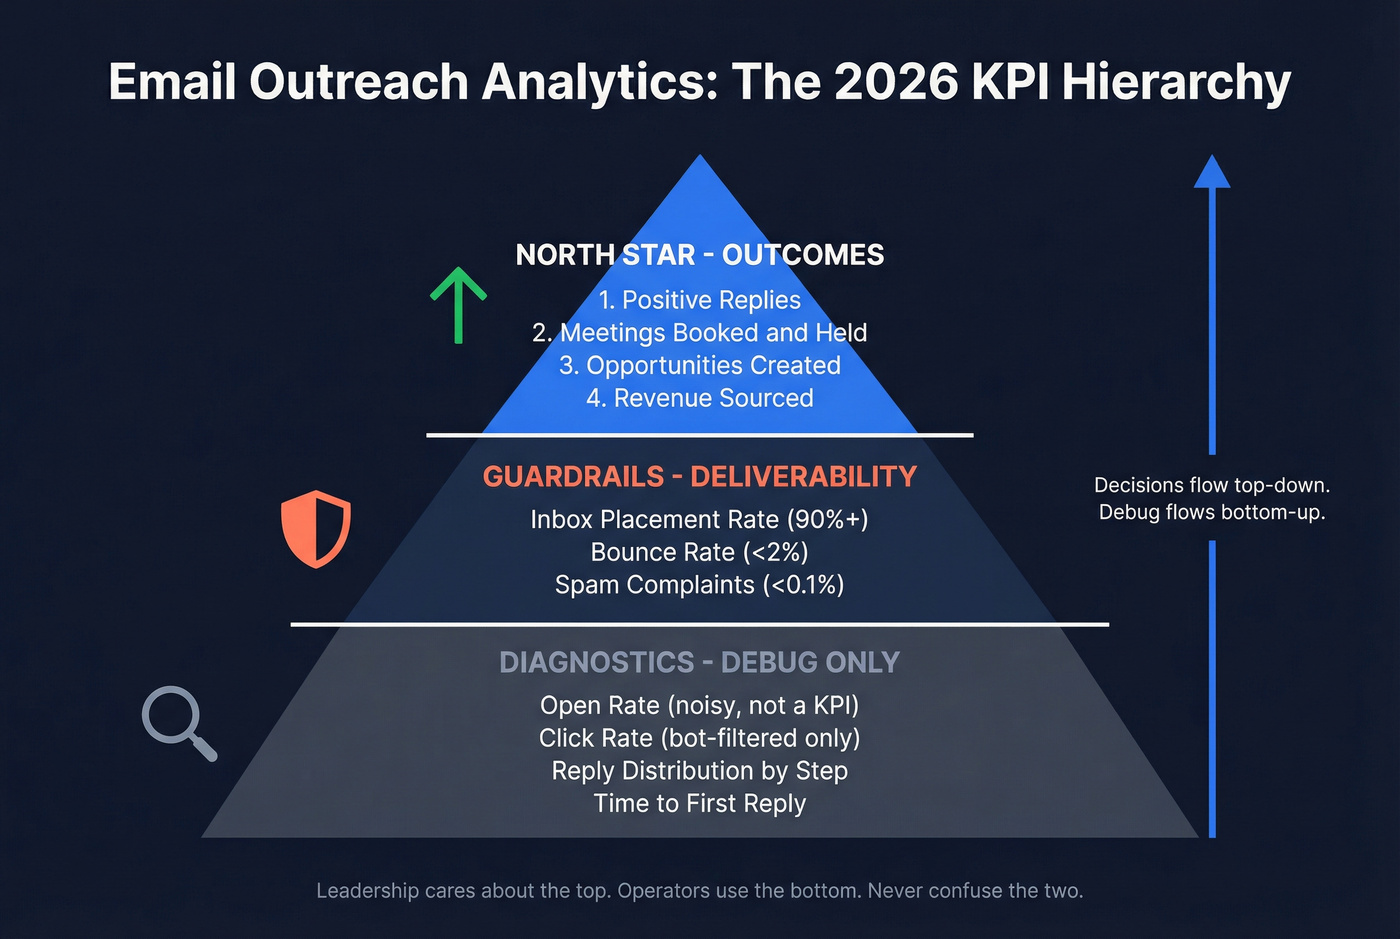
Email outreach analytics KPIs: the 2026 hierarchy
If you want a measurement system that drives decisions, you need a hierarchy. Otherwise you'll end up with 40 metrics, 12 dashboards, and zero clarity.
This hierarchy also maps cleanly to cold email analytics and outbound email analytics: outcomes first, then guardrails, then diagnostics.
The north-star chain (what leadership should care about)
- Positive replies
- Meetings booked -> meetings held
- Opportunities created
- Revenue influenced / sourced
Everything else is either a guardrail (deliverability) or a diagnostic (copy/list issues).
The operator layer (what the team uses to debug)
- Inbox placement rate (inbox/delivered)
- Bounce rate (bounced/sent)
- Spam complaint rate (complaints/delivered)
- Reply distribution by step (Step 1 vs follow-ups)
- Time-to-first-reply (fast replies usually mean relevance)
The biggest KPI mistake: wrong denominators
Most outreach tools will happily show you "reply rate" without forcing you to think about what it's divided by. That's how teams compare:

- Campaign A with 98% delivery
- Campaign B with 90% delivery (because the list is decayed)
...and declare B the winner because the "reply rate" looks higher.
Reply metrics belong on a delivered denominator. It removes list hygiene noise, makes campaigns comparable, and forces deliverability to be a first-class metric.
Mini formulas (the ones you'll actually use)
- Positive reply rate (delivered) = positive replies ÷ delivered
- Meeting booked rate (delivered) = meetings booked ÷ delivered
- Opportunity rate (delivered) = opps created ÷ delivered
- Revenue per 1,000 delivered = revenue ÷ delivered × 1,000
That last one turns outreach from "email performance" into unit economics. Once you trend it weekly, you stop arguing about vanity metrics and start fixing the stage that limits revenue.
Worked example: 1,000 delivered -> pipeline math you can act on
Here's a clean way to diagnose where the system is leaking.
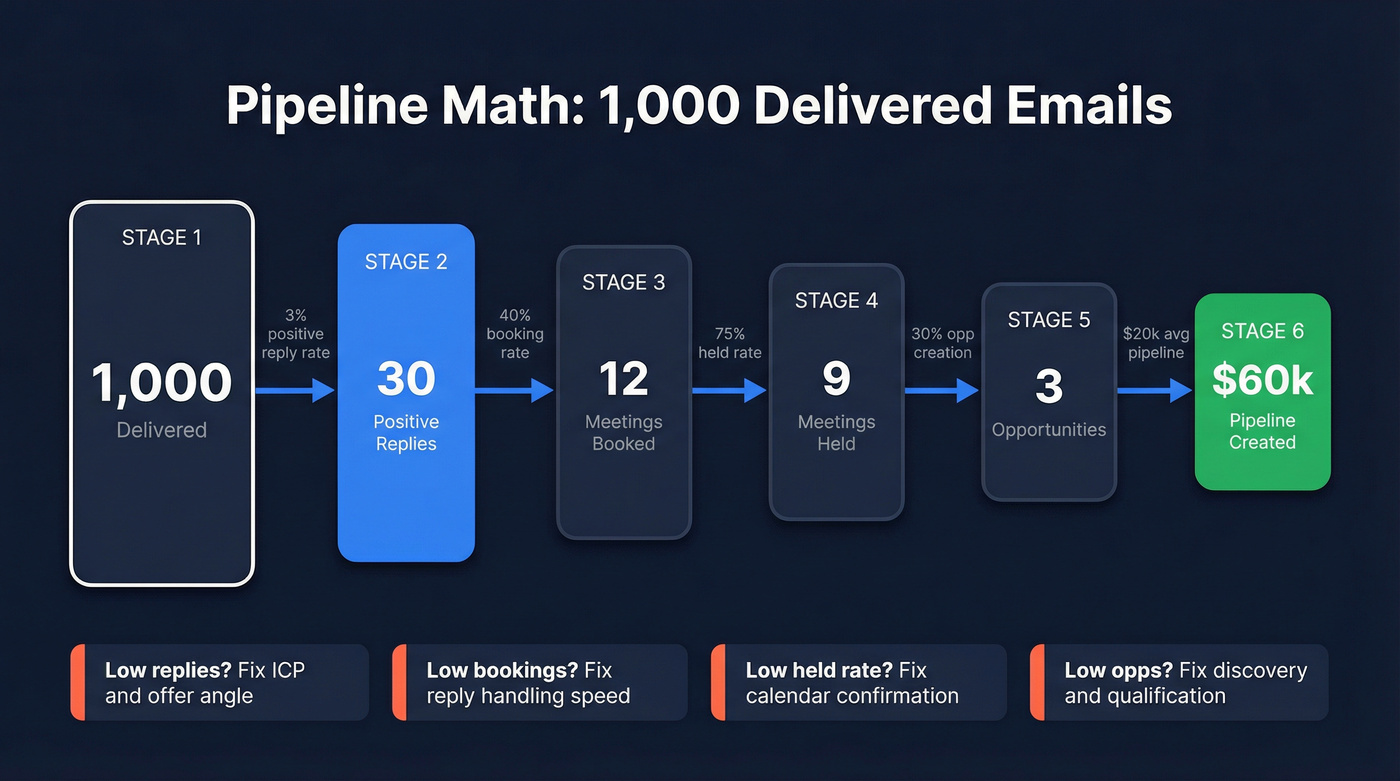
Assume 1,000 delivered emails in a week:
- Positive reply rate: 3% -> 30 positive replies
- Booking rate from positive replies: 40% -> 12 meetings booked
- Held rate: 75% -> 9 meetings held
- Opp creation rate from held: 30% -> 3 opps
- Average pipeline per opp: $20k -> $60k pipeline per 1,000 delivered
Now the actionability:
- If positive replies are low (say 1%): fix ICP, list filters, and offer angle before you touch follow-up cadence (start with ideal customer clarity).
- If positive replies are fine but meetings booked are low: your reply handling is weak (slow response time, unclear next step, too many options).
- If meetings booked are fine but held is low: your calendar process is broken (no confirmation, wrong persona, weak value framing).
- If held is fine but opp creation is low: qualification and discovery are the bottleneck, not email.
This is why I like "pipeline per 1,000 delivered." It forces you to stop debating dashboards and start fixing the actual constraint, even if that constraint lives outside the outreach tool.
KPI definitions & formulas (denominator fixes)
Below is the table I wish every sequencer forced you to adopt.
| Metric | What it tells you | Formula | Guardrail | Performance target | Notes |
|---|---|---|---|---|---|
| Delivery rate | Server acceptance | delivered ÷ sent | ~98% | - | Baseline health check |
| Bounce rate | List hygiene | bounces ÷ sent | <2% | - | Hard bounces damage reputation |
| Inbox placement rate | Inbox vs spam | inbox ÷ delivered | investigate if <90% | 90%+ | Placement is the real "deliverability" |
| Reply rate | Engagement | replies ÷ delivered | - | 1-10% | Use delivered denominator |
| Positive reply rate | Qualified interest | positive ÷ delivered | - | ~2-4% | Define "positive" consistently |
| Meeting booked rate | Conversion | meetings ÷ delivered | - | 0.5-2% | Track booked + held |
| Meeting held rate | Real conversion | held ÷ delivered | - | 0.4-1.5% | Filters no-shows |
| Spam complaint rate | Reputation risk | complaints ÷ delivered | <0.3% | <0.1% | Pause scaling if you hit guardrail |
| Unsubscribe rate | Relevance | unsubs ÷ delivered | - | <0.5-1% | Cold varies by ICP |
| Revenue per 1k delivered | Unit economics | revenue ÷ delivered × 1,000 | guardrails stable | increase WoW | Trend it weekly |
A detail people miss: delivery isn't inbox placement. Delivery means the receiving server accepted the message; placement is where it landed after that. Mailgun explains the distinction clearly, and it matters because "delivered" can still mean "spam."
Some tools also compute reply rate off opens or other proxies. That's fine for internal comparisons inside one platform, but it's not universal math, and it makes cross-tool reporting a mess.
You just read that bounce rates above 2% break your guardrails. Most teams hit that wall because their data provider refreshes every 6 weeks. Prospeo refreshes every 7 days - delivering 98% email accuracy and keeping your bounce rate under control so your analytics actually mean something.
Stop debugging bounces. Start with data that doesn't decay.
Deliverability analytics (guardrails that protect every KPI)
You can't optimize outreach performance if deliverability is drifting. You're just changing how many emails get a chance to perform.

Litmus found 70% of emails show at least one spam-related issue. And teams with successful programs are 22% more likely to monitor deliverability and inbox placement. In our experience, that's the difference between "steady gains" and the dreaded month where everything flatlines and nobody knows why.
Use this if / Skip this if (deliverability analytics edition)
Use deliverability analytics if
- You're sending from new domains or rotating many inboxes
- You're scaling volume week over week
- You're testing new ICPs (complaints spike when targeting is off)
- You're seeing sudden KPI swings without copy/list changes
Skip deep deliverability work (for now) if
- You're sending tiny volume (<500 delivered/week) and validating messaging
- You don't have basics set (SPF/DKIM/DMARC, consistent sending, list hygiene) - if you need a checklist, use SPF/DKIM/DMARC
Thresholds (print these and tape them to your monitor)
Guardrails for cold outreach
- Delivery rate: ~98%
- Bounce rate: <2%
- Spam complaints: <0.1% ideal, <0.3% guardrail
- Inbox placement: investigate if <90%
These aren't theoretical. They're the difference between "we're improving" and "we're burning domains."
When a guardrail breaks: triage order (do this, not vibes)
1) Bounce rate spikes (e.g., 1.5% -> 4%)
- First check: list source + age (old exports rot fast)
- Then: suppress past bounces + role accounts + obvious typos
- Then: verify before sending and stop mixing unverified segments into "tests" (use a repeatable email verification list SOP)
- Pause scaling volume until bounces are back under control
2) Spam complaints spike (e.g., 0.08% -> 0.35%)
- First check: targeting mismatch (wrong persona/industry) and frequency (too many touches)
- Then: copy that sounds deceptive (fake "Re:" threads, bait-y subject lines)
- Then: offer/CTA friction (asking for too much too soon)
- Pause the segment generating complaints; keep sending to proven segments only
3) Inbox placement drops (e.g., 94% -> 86%)
- First check: content and link domain changes (new tracking domain, new redirect, new link shortener)
- Then: sending pattern changes (sudden volume jump, new inboxes, uneven distribution)
- Then: provider split (Gmail fine / Outlook bad is a common signature)
- Action: run a seed test with the exact email, then simplify links and stabilize volume until placement recovers
The data-quality lever most teams ignore (and why it breaks analytics)
If your bounce rate is 4-8%, every performance metric becomes suspect because your denominator is broken. You're not measuring outreach performance; you're measuring list decay.
Look, this is where teams waste weeks. They rewrite copy, tweak follow-ups, and argue about subject lines while quietly sending to stale records that never had a chance of landing in the inbox.
Prospeo's 5-step verification includes catch-all handling plus spam-trap and honeypot removal, which is exactly the unglamorous stuff that prevents silent deliverability decay.

How to measure inbox placement (seed tests) + cadence
Inbox placement is the metric everyone talks about and almost nobody measures correctly. Your ESP can tell you "delivered," but it can't reliably tell you "inbox vs spam" across providers without testing.
Seed testing, explained simply
A seed test is a controlled send to a list of test inboxes across major mailbox providers. You send your real campaign email to the seed list, then the tool reports where each message landed: inbox, promotions, or spam.
What "good output" looks like isn't a single percentage. It's a provider-by-provider breakdown, because Gmail and Microsoft often behave like two different planets.
Step-by-step checklist (practical cadence)
- Build or buy a seed list that covers the mailbox providers you care about
- Send your actual campaign email (same links, same formatting)
- Record results by provider and by sending domain
- Track inbox placement rate as your core output
- Run tests:
- Before scaling a new domain
- After major changes (new infra, new copy style, new link domain, new list source)
- Weekly during active sending (daily if you're high-volume and rotating aggressively)
Store results like an operator (simple logging schema)
Use a sheet or database table with one row per provider per domain:
- date
- sending_domain
- provider (Gmail, Outlook, Yahoo, etc.)
- placement (inbox / promotions / spam)
- subject_line
- link_domain (your site vs tracking domain)
- notes (volume change, new template, new segment)
This makes placement a trend you can debug, not a screenshot you forget.
How to interpret provider splits (and what to do)
- Gmail fine, Outlook bad: Microsoft is often stricter on reputation + patterns. Stabilize volume, simplify formatting, and remove extra links/tracking until Outlook recovers.
- Promotions rising (but not spam): your content looks "marketing-y" (multiple links, heavy formatting). For cold outreach, that's a hint to go plainer and reduce link surface area.
- Spam rising: treat it as an emergency. Pause scaling, run seed tests on the exact template, and fix list quality + content + sending pattern together.
Standardize the formula (or your trendline will lie)
Different tools use different denominators. Standardize on inbox ÷ delivered so you isolate routing from bounce behavior.
Bot/scanner filtering protocol (so clicks don't corrupt reporting)
Clicks are tempting because they feel real. In practice, they're often scanners.
Security scanners click links to evaluate risk. Some prefetch pages. Some load tracking pixels. The result: your dashboard shows "high engagement," but your site analytics and pipeline show nothing.
Minimum viable click hygiene spec (adopt this definition)
Treat a click as "human" only if it passes at least these checks:
- Timing filter: exclude clicks that occur <60-120 seconds after send
- Infrastructure filter (if you can): exclude known security ASNs/IP ranges and obvious bot user agents
- Downstream confirmation: require one of:
- time on page >10s, or
- a second pageview, or
- a form start / key event in GA4
If a click doesn't pass, it stays in the noise bucket. You can still log it; you just can't let it drive decisions.
Worked example: when CTR is invalid (and what to do)
You send 2,000 emails and see 120 clicks (6% CTR). Sounds great - until you inspect timing:
- 72 of the 120 clicks (60%) happen within 2 minutes of send
- they come from three IP ranges
- GA4 shows near-zero engaged sessions and no form starts
That's scanner traffic. Treat CTR as invalid for that campaign.
Your next move isn't "rewrite the CTA." Your next move is to quarantine click-based workflows, reduce link surface area, and go back to signals that correlate with revenue: positive replies, meetings held, and confirmed on-site conversions.
Troubleshooting playbook (what to do Monday morning)
1) Look for timing spikes Clicks clustering minutes after send is scanner behavior.
2) Look for pattern repetition Same IP ranges, same user agents, same geos across many recipients.
3) Compare clicks to downstream engagement High clicks + no engaged sessions + no form starts + no replies = fake engagement.
4) Quarantine click-based workflows
- Don't route "clicked" leads to SDRs
- Don't use clicks for lead scoring
- Don't use clicks to pick A/B winners
5) Reduce link surface area One primary CTA link beats three "helpful resources."
6) Use stronger signals Replies, positive replies, meetings held, and on-site conversions beat clicks every time.
Email outreach analytics attribution: outreach -> GA4 -> CRM
If you want to answer "did outreach create pipeline?" you need a clean path from email click to site session to CRM record. Otherwise you'll live in dashboard arguments forever.
This is the part of outreach reporting that turns "we sent emails" into something leadership trusts: which segments and offers created meetings, opps, and revenue.
Implementation steps (durable version)
1) Define your UTM standard (and enforce it)
Minimum viable UTMs:
utm_source(e.g.,cold_email,outreach_tool_name)utm_medium=emailutm_campaign(a stable campaign key, not a sentence)
Optional but useful:
utm_content(variant, persona, angle)utm_term(segment or list name)
2) Example UTM schema (copy/paste)
utm_source=cold_emailutm_medium=emailutm_campaign=2026q1_it_directors_namutm_content=variant_a_problem
Keep naming lowercase and consistent. GA4 treats casing as different values.
3) Validate in GA4 Realtime before you ship volume Click your own link, then confirm:
- session source/medium is correct
- campaign is populated
- landing page keeps UTMs (no redirect stripping)
4) Never tag internal links UTMs are for inbound links only. Internal UTMs overwrite original attribution and poison acquisition reports.
5) Map GA4 -> CRM
- capture UTMs on form submits (hidden fields)
- store first-touch and last-touch UTMs on the lead/contact
- attach campaign key to opportunities when created
If you're wiring enrichment and routing into your CRM, integrations matter. Prospeo's integrations list is a useful reference for common outbound + CRM stacks, especially if you're trying to keep campaign keys consistent across Smartlead/Instantly/Lemlist and Salesforce/HubSpot.
Apple tracking nuance (so you don't build brittle attribution)
Twilio notes Apple can strip tracking parameters (like UTMs) in certain contexts, which is why some teams see missing parameters on iOS flows. Separately, iOS 26 Link Tracking Protection broadly strips click IDs; standard UTM parameters aren't impacted.
The practical rule: validate your exact click path on iOS Mail/Safari, and watch redirects.
UTM survival checklist
- avoid redirect chains that drop query strings
- avoid link shorteners that don't preserve parameters
- test on iOS Mail -> Safari specifically
- confirm in GA4 Realtime before scaling
Use this / Skip this (attribution edition)
Use server-side tracking if
- you have engineering bandwidth
- you need high-confidence multi-touch attribution
- you're running high volume and privacy changes are breaking client-side tags
Skip server-side tracking (for now) if
- you can't reliably maintain it
- you don't yet capture UTMs on forms into your CRM
Start with UTMs + form capture + clean campaign keys. That gets you most of the value.
Why GA4 doesn't match your outreach dashboard (fix list)
GA4 and your outreach tool answer different questions. Outreach tools count email events; GA4 counts sessions and events that survive browsers, consent, redirects, and tag timing. When they don't match, it's usually one of these:
- Processing delay: GA4 can lag up to 48 hours in some reports. Reconcile weekly, not hourly.
- "(not set)": attribution info didn't get captured.
- Fix: make sure
session_startfires reliably and your landing page isn't stripping parameters.
- Fix: make sure
- "Unassigned": GA4 can't map your source/medium into a channel group.
- Fix: align UTM values with GA4 channel grouping rules (or customize grouping).
- Tag firing order: your Google tag fires too late.
- Fix: in GTM, fire the tag on Initialization so session attribution isn't missed.
- Consent mode limits: consent settings reduce observable attribution.
- Fix: implement consent mode correctly and set expectations with stakeholders.
- Invalid UTMs: typos, inconsistent casing, missing required parameters.
- Fix: lock a UTM builder and naming conventions.
- Redirects stripping UTMs: query strings dropped on redirect chains.
- Fix: preserve query strings end-to-end (and test the final URL, not the first).
If you use server-side tagging or Measurement Protocol (common hidden breakages)
These are the mistakes that create "GA4 shows nothing" even when clicks are real:
- Preserve
client_id: don't generate a new client_id server-side; pass the original through, or GA4 treats it as a new user/session. - Reuse
session_idcorrectly: don't create a new session_id per event; keep events in the same session when they belong together. - Don't block
session_start: server-side filters, consent logic, or misconfigured tags can prevent session_start from being recorded, which cascades into "(not set)" and "Unassigned."
If you're doing anything advanced here, test with a single click end-to-end and confirm the session + campaign fields populate before you scale.
Benchmarks for 2026 (use ranges + guardrails, not absolutes)
Benchmarks are sanity checks, not self-worth. Your ICP, offer, list quality, and domain reputation matter more than any "industry average."
Here are ranges that work in practice when guardrails are stable (bounces <2%, complaints <0.3%, placement 90%+):
| Metric | OK | Strong | Elite |
|---|---|---|---|
| Reply rate (delivered) | 1-8.5% | 10-15% | 15%+ |
| Positive reply rate (delivered) | 2-4% | 4-8% | 8%+ |
| Meeting booked rate (delivered) | 0.5-2% | 2-4% | 4%+ |
| Inbox placement (inbox/delivered) | 90-93% | 94-97% | 98%+ |
| Spam complaints (complaints/delivered) | <0.3% | <0.1% | <0.05% |
Interpretation notes:
- Woodpecker's 1%-8.5% reply-rate range is honest because it admits variance.
- Instantly's benchmark framing is more aggressive: 10-15% is excellent and 15%+ is best-in-class - achievable with tight targeting and clean data.
- A community summary of Instantly's 2026 report notes a common pattern: a meaningful share of replies come from follow-ups. Translation: if you aren't running follow-ups, you're voluntarily cutting your reply volume (use cold email cadence templates to pressure-test your follow-up plan).
Tool analytics reality check (what platforms count - and what they miss)
Tools don't just report metrics; they define them. Normalize definitions before you compare campaigns across platforms.
If you're comparing outbound email analytics across tools, the first step is to standardize denominators (delivered vs sent) and align what "positive reply" means in your process.
What the platforms actually measure (and where it breaks)
| Platform | Opens | Clicks | Replies | Denominator gotchas |
|---|---|---|---|---|
| Outreach | Pixel-based | Total clicks | Threaded | Forwarded opens can count; opens inflated by scanning |
| Smartlead | Unique opens | Clicked | Positive Reply label | Reply rate can be shown as replies/opens |
| Instantly | Pixel-based | Link tracking | Reply labels | Uses delivered for reply metrics |
Short notes you should know:
- Outreach warns automated security scanning can inflate opens dramatically (sometimes close to 100%), so treat opens as unreliable. Outreach also notes click tracking can impact deliverability unless you use safer settings like branded tracking domains, and it reports total clicks without showing which specific link was clicked.
- Smartlead's Positive Reply depends on labeling in the inbox. That's good (it forces a definition). It's also a process dependency, so audit it.
- Instantly prices modules separately, so costs stack if you expect "full-funnel analytics": Outreach $47-$358/mo + CRM $47-$97/mo + Leads $47-$197/mo (if you need it).
- Pricing anchors:
- Smartlead: $39 / $94 / $174 / $379 per month; SmartDelivery add-on $49-$599/mo
- Instantly: Outreach $47 / $97 / $358 per month; CRM $47 / $97 per month
- Outreach: typically $15k-$50k/year depending on seats and modules
If you're building a stack, choose tools based on what you need to be true. If you need clean denominators, you need reliable verification and freshness upstream; if you need clean attribution, you need UTMs and form capture downstream; and if you need click metrics, you need bot filtering in the middle, because raw CTR is a trap (tool selection help: cold email outreach tools).
Weekly reporting template (copy/paste for leadership)
Leadership trusts one page that shows outcomes, guardrails, and a decision. They don't trust a dashboard tour.
Weekly email outreach analytics (template)
Week of: YYYY-MM-DD Audience/ICP: (segment name) Volume: sent / delivered
Top 3 outcome metrics (weekly)
- Positive reply rate (positive ÷ delivered): __% (WoW: __)
- Meeting booked rate (meetings ÷ delivered): __% (WoW: __)
- Inbox placement rate (inbox ÷ delivered): __% (WoW: __)
Deliverability guardrails
- Delivery rate (delivered ÷ sent): __%
- Bounce rate (bounces ÷ sent): __%
- Spam complaint rate (complaints ÷ delivered): __%
Funnel reality (so we don't lie to ourselves)
- Meetings held: __
- Opportunities created: __
- Pipeline created: $__
- Revenue closed-won: $__ (if applicable)
What changed this week
- List source/filters changed? (yes/no + what)
- Copy/offer changed? (yes/no + what)
- Sending pattern changed? (domains, volume, timing)
Actions taken this week
- (bullet list: 3-6 items, concrete)
Decision this week
- (pause scale / keep volume flat / scale by __% / change ICP / change offer)
Next week's plan
- (bullet list: 3 items max)
Explicit rule: Don't include open rate as a success metric.
Example "one-slide" narrative (what you'd say in the meeting)
Positive reply rate rose from 2.6% to 3.4% on delivered after tightening the segment and simplifying the CTA. Inbox placement stayed at 94% and bounces held at 1.3%, so the lift is real, not a deliverability artifact. Meetings booked increased to 1.6% of delivered; decision this week is to keep volume flat and test a second offer angle.
Final recommendation (clean denominators, then optimize)
If bounce rate's over 2%, your dashboards are lying because your denominator's broken. This week, do three things: verify/suppress bad addresses, run a weekly seed test, and normalize every performance rate on delivered. Once guardrails are stable, then you've earned the right to obsess over copy and sequencing - and your email outreach analytics will produce decisions instead of noisy charts.
Your revenue-per-1,000-delivered metric is only useful if those 1,000 emails actually land. Prospeo's 5-step verification with catch-all handling and spam-trap removal means your delivered denominator stays clean - so the KPIs you report reflect real performance, not list rot.
Clean denominators start at $0.01 per verified email.
FAQ
What are the most important email outreach metrics to track in 2026?
Track positive reply rate (delivered), meeting booked rate (delivered), and inbox placement rate (inbox/delivered) as your weekly big three. Use bounce rate (<2% of sent) and spam complaints (<0.1% ideal, <0.3% guardrail) as safety rails. Treat open rate as a diagnostic only.
What's a good bounce rate and spam complaint rate for cold outreach?
A healthy bounce rate is under 2% of sent, and spam complaints should stay under 0.1% of delivered (with 0.3% as a hard stop). If bounces hit 3%+ or complaints cross 0.3%, pause scaling and fix list hygiene, targeting, and inbox placement before changing copy.
Why is GA4 showing "Unassigned" for my email outreach traffic?
GA4 shows "Unassigned" when your UTMs don't map cleanly into channel rules - most often from inconsistent casing, typos, missing parameters, redirects that drop query strings, or tags firing too late. Standardize utm_source/medium/campaign, validate in GA4 Realtime, and fire your Google tag on Initialization in GTM.
What's a good free tool to improve list quality before sending?
Prospeo's free tier is a practical starting point: 75 email credits plus 100 Chrome extension credits per month, with 98% verified email accuracy and a 7-day refresh cycle. If you're comparing options, prioritize anything that removes catch-alls, spam traps, and stale records to keep bounces under 2%.