How to Measure Intent Data (2026): A Practical Measurement System
72% of the "intent ROI" decks I see are just attribution screenshots with a new label. That's not measurement. That's storytelling.
If you're trying to figure out how to measure intent data in a way Finance won't laugh out of the room, you need a system that separates signal quality, execution, and incremental impact, then ties those pieces back to results you can defend.
Here's the hook: you can get to a defensible answer in six weeks, without a data science team, if you set up the right fields and run one clean holdout.
What you need (quick version)
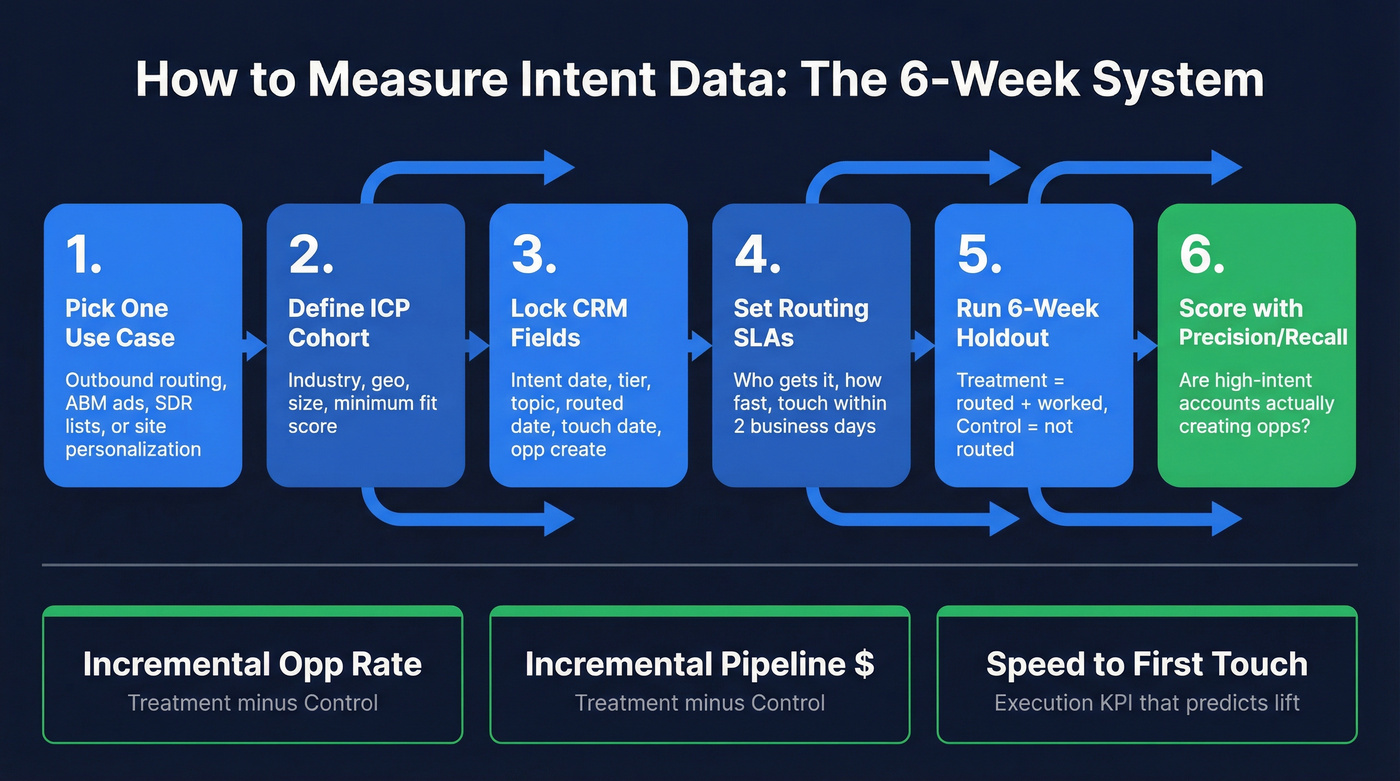
- Pick one use case (start narrow): outbound routing, ABM ads, SDR call-down lists, or website personalization.
- Define your ICP cohort (accounts eligible for intent): industry, geo, employee range, and a minimum "fit" score. (If you need a clean definition, start with an ideal customer template.)
- Lock your influence windows + fields in CRM: intent date, tier, topic, routed date, first sales touch, meeting, opp create, close.
- Set routing SLAs: who gets the account, how fast, and what "worked" means (touch within 2 business days is a solid starting bar). If you want benchmarks, use speed-to-lead metrics.
- Run a 6-week holdout test first: treatment = routed + worked; control = not routed (or routed later).
- Score signal quality with precision/recall at the account level: are your "high intent" accounts actually creating opps, or are you generating busywork?
- Review weekly, decide monthly, re-allocate quarterly: weekly is for ops hygiene; monthly is for topic/tier tuning; quarterly is for budget decisions.
The 3 KPIs that matter most (because they're hard to fake):
- Incremental opp rate (treatment minus control)
- Incremental pipeline $ (treatment minus control)
- Speed-to-first-touch on routed intent accounts (execution KPI that predicts lift)
Your first experiment: a 6-week audience holdout on a single segment and a single routing motion.
What intent data really measures (and why it's probabilistic)
Intent data doesn't tell you who's buying. It tells you who's behaving like buyers tend to behave.
Third-party intent is built from a huge observation layer. Bombora has shared that its network spans 5,000+ sites and 17B interactions per month across ~5M unique domains, resolved to 2.8M businesses with a 19,200-topic taxonomy. That scale is why it's useful, and it's also why it's noisy: you're looking at patterns, not certainties, and the same behavior can mean different things in different contexts.
A "surge" isn't an absolute number. It's baseline-relative. The same account reading 10 pages this week might be a surge for one company and totally normal for another.
Why "high intent" depends on company size (the part reps feel, but dashboards hide)
One of the most practical Demandbase insights is that "high" intent thresholds vary by company size. Bigger companies generate more background activity, so the bar for "meaningful change" is higher.
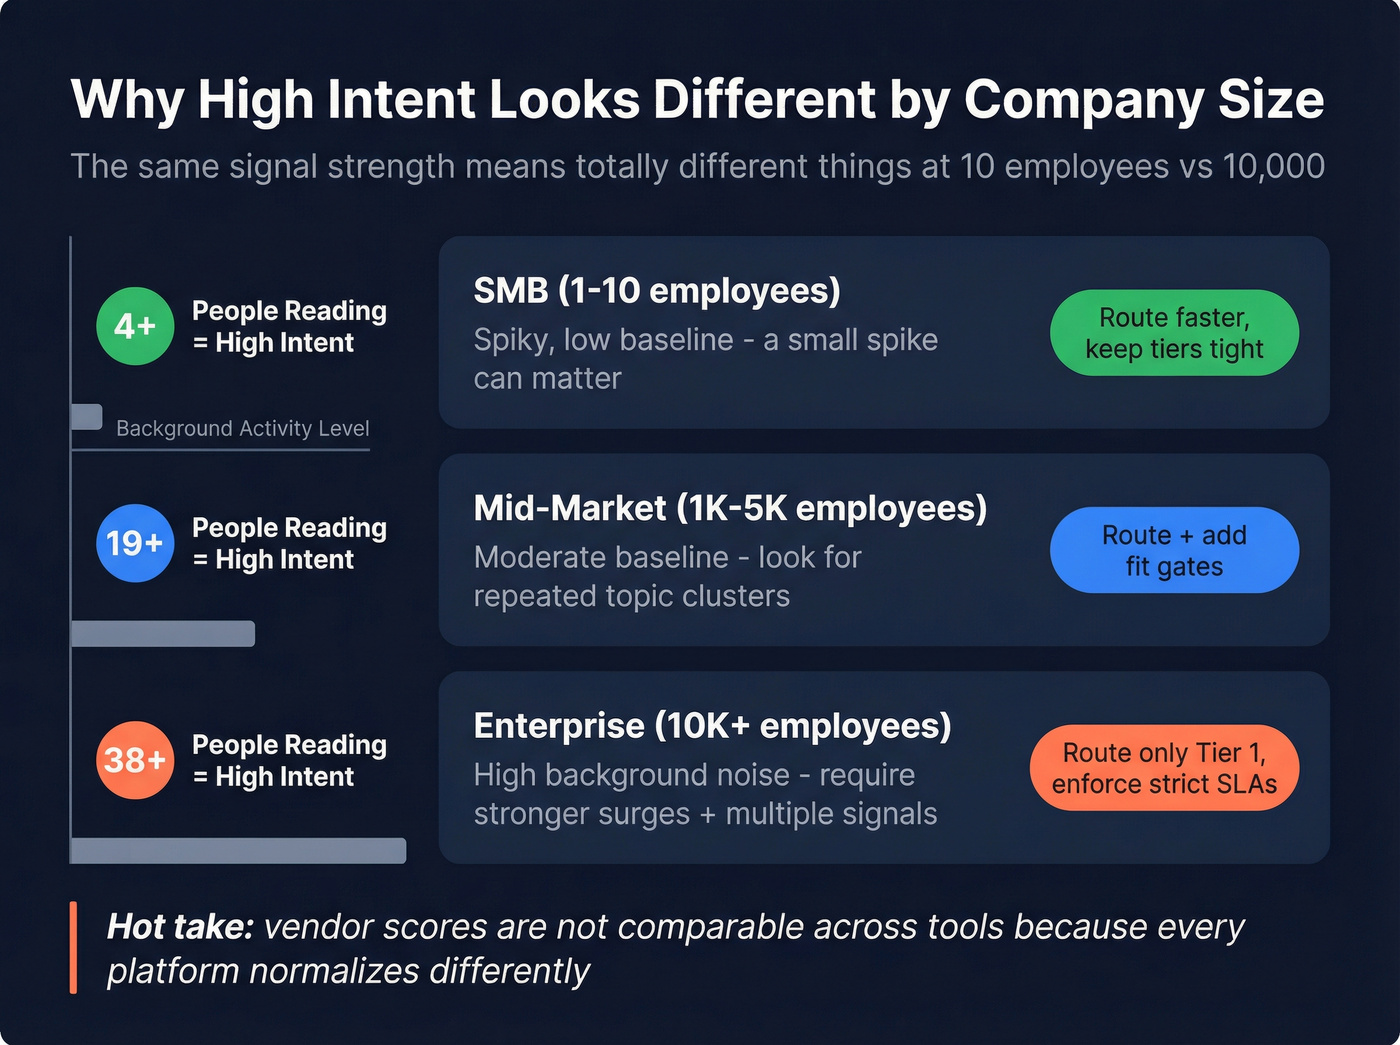
Demandbase even publishes different intent-strength thresholds by employee band. For example:
- 1-10 employees: High intent can be 4+ people reading
- 1K-5K employees: High intent can be 19+
- >10K employees: High intent can be 38+
Here's the operational takeaway:
| Company size | What "normal" looks like | What "high intent" needs to look like | What to do with it |
|---|---|---|---|
| SMB | Spiky, low baseline | A small spike can matter | Route faster; keep tiers tight |
| Mid-market | Moderate baseline | Look for repeated topic clusters | Route + add fit gates |
| Enterprise | High background noise | Require stronger surges + multiple signals | Route only Tier 1; enforce strict SLAs |
This is why vendor scores don't compare cleanly across tools (or even across segments inside the same tool): every platform normalizes differently, and your ICP mix changes the baseline.
Hot take: if your average deal is small, you probably don't need a "perfect" intent stack. You need fast routing, verified contacts, and a simple holdout test. Most teams overspend on signal and underinvest in execution.
The measurement framework: scale, accuracy, overlap, incremental impact
Forrester's lens is the cleanest way to think about intent measurement: scale, accuracy, and overlap (with what you already have) determine incremental impact. The punchline is simple: vendor scores aren't comparable across tools because each vendor normalizes differently.

Use this framework to measure your program, not the vendor's marketing, and to standardize the intent data metrics you'll use across teams.
| Dimension | What it means | How you measure | Starting heuristic (calibrate to your ICP + sales cycle) |
|---|---|---|---|
| Scale | Enough signals in ICP | % of ICP accounts with signals in a month | You want "enough to run tests," not "as much as possible" |
| Accuracy | Signals predict outcomes | Precision/recall by tier/topic | Precision should rise as tiers tighten |
| Overlap | Net-new vs redundant | % overlap with 1P engagement + existing target list | If overlap's very high, you're paying for what you already know |
| Incremental impact | Causal lift | Holdout lift in opp rate + pipeline $ | Positive lift with a CI that doesn't live on zero |
Two truths from bake-offs we've run:
- The biggest feed often loses because it floods reps with low-quality accounts.
- The prettiest score often wins on slides and loses in pipeline because routing's slow and contacts bounce.
So don't start by arguing about which vendor's "A" score is better. Start by measuring whether your workflow creates lift.
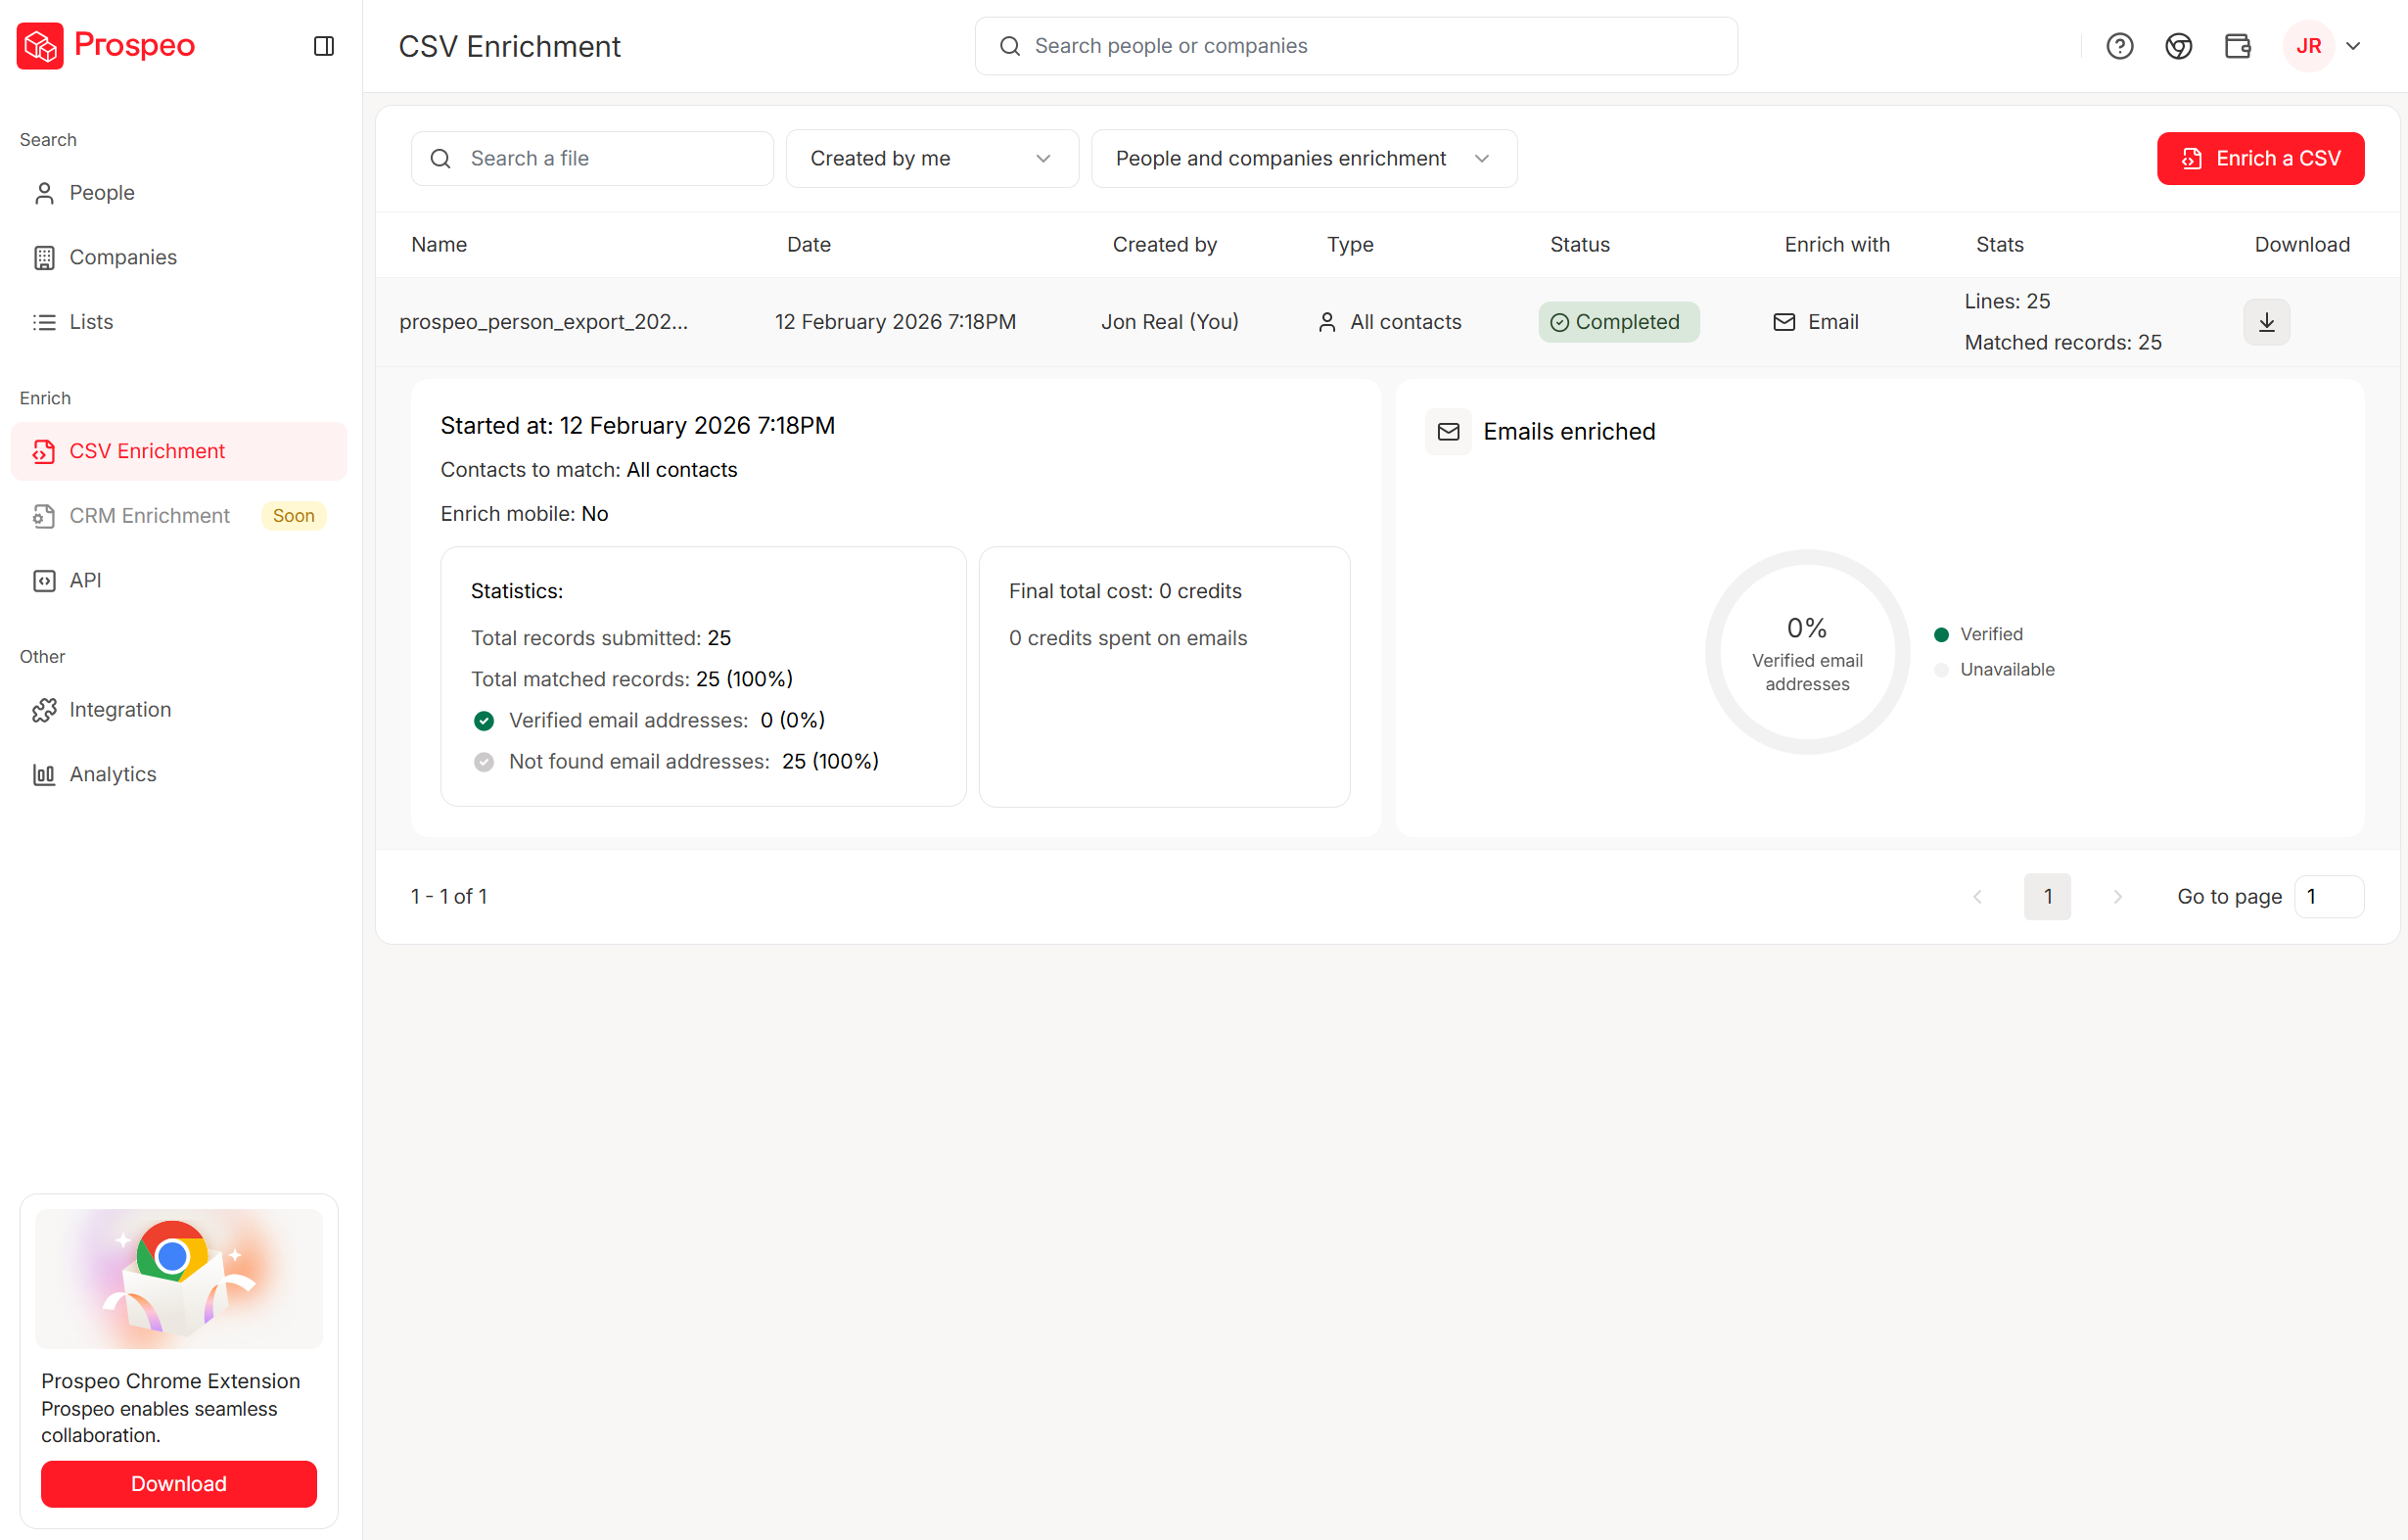
Your intent holdout test is only as good as the contacts you route to reps. Bad emails turn a winning signal into a failed experiment. Prospeo's 98% verified emails and 125M+ direct dials mean your treatment group actually gets worked - so you measure real lift, not bounced outreach.
Stop letting bad data poison your intent measurement.
Baseline before you turn it on (so lift is measurable)
If you don't baseline, you'll end up "discovering" ROI that was already happening.
Baseline checklist (do this for the segment you'll test intent on):
- Define the cohort: accounts in ICP + target geos + target industries.
- Pull 4 quarters of funnel velocity (so seasonality doesn't fool you).
- Pull 1 year of CAC baseline (so you don't optimize for cheap leads that never close). (If you need the math and benchmarks, use a CAC LTV ratio reference.)
- Separate marketing-generated vs SDR-generated where possible.
- Capture current outreach volume (touches/week) so you can detect effort bias later.
Mini formulas block (funnel baselines):
- Inquiry->MQL = MQLs / Inquiries
- MQL->SAL = Marketing SALs / MQLs
- SAL->SQL = Marketing SQLs / SALs
- CAC baseline over 1 year
- Funnel velocity over 4 quarters
You don't need perfect stage definitions. You need consistent ones. If your org uses PQL instead of MQL, swap it in and keep the math.
The baseline output you want is a single worksheet that answers:
- "What's our normal opp creation rate for this cohort?"
- "What's our normal pipeline per 100 accounts per month?"
- "How long does it take to create an opp after first touch?"
That's what you'll compare intent against.
Instrumentation: fields, timestamps, routing SLAs (the setup most teams skip)
Most intent programs fail in measurement because the CRM can't answer one basic question: did Sales act on the signal in time?
If you can't separate "signal didn't work" from "we didn't work the signal," you'll kill good programs and keep bad ones.
Minimum viable instrumentation (fields + timestamps)
Implementation checklist:
- Choose your account grain: account-level intent is the default.
- Create an "Intent Signal" record (preferred) or fields on Account that can store multiple topics over time.
- Log routing events: who got it, when, and what tier it was.
- Log sales touches: first touch date, meeting date, opp create date.
- Set SLAs: e.g., Tier 1 intent must be touched within 2 business days.
Minimum viable schema:
On Account (or Account Intent object)
- account_intent_topic (multi-select or child records)
- intent_date (date of signal)
- intent_source (third-party / review-site / 1P / blended)
- intent_tier (Tier 1/2/3)
- first_seen_intent (timestamp)
- last_seen_intent (timestamp)
On Account + Activity/Opp
- routed_date (timestamp)
- first_sales_touch_date (timestamp)
- meeting_date (timestamp)
- opp_create_date (timestamp)
- close_date (timestamp)
Cadence reality that changes your measurement windows:
- Many topic feeds sync weekly, not daily.
- If you're training predictive scoring on top, wait at least a month before retraining after you start syncing topics. Otherwise you're evaluating a model mid-flight. (If you're deciding between approaches, see AI lead scoring vs traditional lead scoring.)
Minimum viable reports (3) you should build on day one
These three reports turn "intent" from a vibe into a measurable workflow.

SLA compliance by tier (execution report)
- Metric:
% of routed accounts touched within SLA - Calculation:
first_sales_touch_date - routed_date - Slice by: tier, SDR, segment, week
- Metric:
Opp creation within X days by tier/topic (signal report)
- Metric:
opp created within 30/60/90 days of intent_date - Slice by: topic cluster, tier, fit band (A/B/C), region
- Output: a pivot that makes it obvious which topics are wasting time
- Metric:
Treatment vs control lift table (ROI report)
- Metric: opp rate, meetings per 100 accounts, pipeline per 100 accounts
- Output: one row per segment (SMB/MM/ENT or region) with lift and confidence interval
If you can't build these, you're not ready to judge ROI, because you can't tell whether you've got a signal problem or an execution problem.
Keep measurement honest: remove "false negatives" from bad contact data
Bad contact data quietly wrecks intent measurement. Reps "work" the account, bounce half the emails, never connect by phone, and the dashboard blames the signal.
We've seen this in our own tests: the moment you clean up deliverability and direct-dial coverage, the same intent feed suddenly "gets better" because the team can actually reach the people they're supposed to reach. If you want a deeper SOP, start with B2B contact data decay.
Prospeo is the publisher's product, and it's built for this exact integrity problem: 98% email accuracy, a 7-day data refresh, and real-time verification so your "worked" accounts are reachable. Prospeo also includes intent data across 15,000 topics (powered by Bombora), plus enrichment that returns 50+ data points per contact with an 83% enrichment match rate.
How to measure intent data: signal quality (precision/recall + tier tuning)
Most teams measure intent with "conversion rate." That hides the real question: how many of your routed accounts were worth routing?
Precision/recall is the cleanest operational model.
Definitions:
- Precision = TP / (TP + FP)
- Recall = TP / (TP + FN)
Worked example (account-level):
Choose X = 60 days as your "intent-to-opp" window. It's long enough to cover weekly sync + routing + a few touches, and short enough to avoid crediting intent for deals already in motion.
Define outcomes:
- True Positive (TP): Account had Tier 1 intent, and opp created within 60 days of the intent date.
- False Positive (FP): Account had Tier 1 intent, but no opp within 60 days.
- False Negative (FN): Account had no Tier 1 intent, but opp created anyway (within the same cohort/time period).
Now run the math:
- Routed 200 Tier 1 intent accounts
- 50 created opps within 60 days -> TP = 50
- 150 didn't -> FP = 150 Precision = 50 / (50 + 150) = 25%
Non-intent accounts in cohort: 300
- 30 created opps anyway -> FN = 30 Recall = 50 / (50 + 30) = 62.5%
Interpretation:
- Precision tells you whether you're wasting SDR cycles.
- Recall tells you whether you're missing pipeline by being too strict.
Tier tuning playbook (simple thresholds that work)
Use precision to manage tiers like a portfolio:
- If Tier 1 precision <10% for a topic cluster -> demote it (Tier 2/3) or add a fit gate.
- If Tier 1 precision is 10-25% -> keep it Tier 1 but cap volume (route only top fit band).
- If Tier 1 precision >25% and volume's low -> promote adjacent topics or widen the cohort slightly.
- Always cap routed volume: if SDRs can only work 60 accounts/week, routing 200/week guarantees failure and makes the signal look worse than it is.
A concrete win we've seen: in one rollout, Tier 1 precision doubled after we added a strict fit gate (only A-fit accounts) and enforced a 48-hour SLA. The intent feed didn't change. Execution did.
Define "influenced pipeline" so it doesn't turn into a political fight
Influenced pipeline is useful when it's consistent and falsifiable. It's a vanity metric when it's "any signal ever touched this account at any time."
Use a ruleset a skeptical CFO will accept.
A clean template comes from the way G2 Performance Analytics defines influence: a deal is influenced if the signal occurs within 180 days of key deal timestamps and before close.
Influence logic (three conditions):
A deal is "influenced" if:
- An intent signal occurs within 180 days before the deal Created Date, OR
- An intent signal occurs within 180 days before or after the deal's last Updated Date, AND
- The intent signal occurs before the deal Close Date.
Then add the fix that stops stale credit: a recency filter.
If you're using first-touch influence, require: first touch within the last 90 days.
Influence logic table (copy/paste into your ops doc):
| Rule | Window | Why it exists |
|---|---|---|
| Pre-create influence | 180d before create | captures discovery |
| Post-update influence | +-180d of update | captures re-open |
| Must be pre-close | before close | avoids nonsense |
| First-touch recency | 90d | avoids stale credit |
The real-world pain: view-through + "Website" overwrites everything
Here's the scenario that breaks trust fast:
- You run intent-driven display. Someone sees an ad (view-through).
- A week later they visit directly, fill out a form, and the CRM lead source becomes Website.
- Marketing says "display influenced it," Sales says "it was inbound," Finance says "prove it."
Your influence ruleset prevents the fight by anchoring credit to timestamps (signal date relative to opp create/update/close) instead of whatever the CRM happened to overwrite last. It won't make everyone happy, but it'll make the metric defensible.
Influenced pipeline still isn't ROI. It's a debugging KPI. ROI needs incrementality.
Measuring intent ROI with incrementality tests (playbook + templates)
Incrementality is the counterfactual: what would've happened anyway if you didn't use intent.
Attribution answers "what touched the deal." Incrementality answers "what caused lift." If you don't run a holdout, you're guessing, especially with intent, where signals correlate with buying behavior by definition.
Real talk: this is the part teams avoid because it forces a yes-or-no answer.
Budget reality check (why testing's non-optional)
Most intent contracts are annual and land in the five figures to low six figures depending on ICP size, seats, and activation channels. That's real money. If you can't prove lift, you're buying a dashboard.
Also compute the decision metric Finance actually cares about:
- Incremental CAC / iCPC = incremental spend ÷ incremental outcomes (meetings, opps, or closed-won)
Lift without cost is a feel-good chart.
Pragmatic sample size / power heuristics (so you don't run "tests" that can't work)
You can do formal power calculations, but teams rarely do. Use these heuristics to avoid wasting six weeks:
- Aim for >=300-500 accounts per cell (treatment and control) for a first pass on opp-rate lift.
- If you're smaller than that, use meetings as the primary KPI first (more frequent than opps), then roll up to opps/pipeline once volume grows.
- Extend runtime until you've got enough events to read a signal. A flat result with tiny samples is inconclusive, not a failure.
- Always report lift with a confidence interval. If the CI crosses zero, treat it as "not proven yet," not "didn't work."
Pre-commit template (copy/paste before you launch)
Write this down before week 1. This prevents p-hacking and keeps stakeholders aligned.
Hypothesis
- "Routing Tier 1 intent accounts to SDRs within 2 business days increases opp rate vs control."
Cohort definition (inclusions)
- ICP accounts, target regions, target segments, fit score threshold
Exclusions
- Existing open opps at start date
- Accounts touched in the last X days (to avoid crediting active plays)
- Strategic named accounts (if Sales refuses randomization)
Randomization plan
- Split method (50/50), stratify by segment if needed (SMB/MM/ENT)
Treatment
- What exactly changes: routing rules, sequences, ads, talk tracks
Control
- Business-as-usual or delayed routing (define the delay)
Primary KPI + window
- Opp created within 60 days of intent_date (or meetings within 30 days)
Secondary KPIs
- Speed-to-first-touch, meetings per 100 accounts, pipeline per 100 accounts
Contamination rules (non-negotiable)
- Reps can't cherry-pick control accounts
- No manual overrides without logging a reason code
- If an account crosses from control to treatment, mark it and analyze separately
Analysis plan
- Compare outcome rates; compute lift and CI; segment cuts you will and won't do
Decision rule
- Ship if lift >= +20% and SLA compliance >=80%
- Iterate if lift's positive but CI crosses zero
- Kill if lift's negative and execution KPIs were healthy
Audience holdout (my default for intent routing)
When it works best: you're routing intent accounts to SDRs, sequences, or ads.
Steps:
- Build your eligible cohort (ICP accounts only).
- Randomly split into Treatment and Control (50/50 is fine).
- Treatment gets the intent-based routing + plays.
- Control stays business-as-usual (or delayed routing).
- Run for six weeks.
- Compare outcomes: opp rate, pipeline, meetings, and time-to-first-touch.
Critical rule: cohort exclusivity. If reps cherry-pick control accounts because they look hot, your test is contaminated and your lift number's fiction.
Geo experiment / geo-holdout (best for paid + mixed channels)
Geo tests are powerful when you can't randomize at the user level and you need privacy-durable measurement.
- Geo test: turn on intent-driven activity in selected markets; other markets are control.
- Geo-holdout: pause an existing activity in selected markets; compare to markets where it continues.
Operational heuristic: geo needs >=20 markets to be stable. Fewer than that and one big deal can swing your results.
Time-series on/off (use when you've got no other option)
This is the "flip the switch" test: run intent for a period, pause it, compare.
It's easy and fragile:
- seasonality,
- launches,
- staffing changes,
- budget shifts.
If you do time-series, pair it with a matched control cohort (even if imperfect).
How to calculate lift (and how to read it like an adult)
Use the simplest lift math:
Lift = (Outcome_rate_treatment - Outcome_rate_control)
Example:
- Treatment opp rate = 8%
- Control opp rate = 6% Lift = +2 percentage points (or +33% relative lift)
Then report the confidence interval. If the CI crosses zero, call it inconclusive and extend the test or tighten execution. Don't declare victory. Don't declare failure.
KPI scorecard + dashboard template (weekly vs monthly vs quarterly)
Most teams track too many intent KPIs and trust none of them.
A study summary from N.Rich (50 sales and marketing leaders) shows what people actually use: conversion rate (32%), influenced pipeline (16%), ROI/ROAS (14%), SQLs (9%), meetings (7%), revenue/new sales (5%), sales velocity/deal size/lead quantity (4%), and CAC/LTV/lead quality (2%). Translation: everyone wants ROI, but most teams settle for proxies.
Use a scorecard that matches decision cadence, and make sure it includes both execution and outcome intent data metrics so you can separate "signal" from "system."
KPI scorecard (template)
| Cadence | KPI | Why it matters | Owner |
|---|---|---|---|
| Weekly | Speed-to-1st-touch | execution quality | RevOps |
| Weekly | SLA compliance (by tier) | prevents intent decay | SDR Mgr |
| Weekly | Routed acct volume | workload control | SDR Mgr |
| Monthly | Precision (Tier 1) | signal quality | RevOps |
| Monthly | Opp rate (treatment vs control) | early ROI read | RevOps |
| Quarterly | Incremental pipeline $ | budget decision | Rev+Fin |
| Quarterly | Incremental CAC / iCPC | efficiency | Finance |
Dashboard layout (simple, not fancy):
- Top row (weekly): routed accounts, SLA compliance, touches, meetings set
- Middle (monthly): precision/recall by tier/topic, opp rate by tier, influenced pipeline (debug only)
- Bottom (quarterly): incremental pipeline $, incremental CAC/iCPC, win rate and cycle time deltas
How to interpret 3 common dashboard patterns (and what to do next)
Pattern #1: Precision drops, routed volume rises
- Symptom: Tier 1 precision falls below 10-15% while routed accounts spike.
- Cause: topic sprawl or missing fit gates.
- Fix this week: demote broad topics, add fit threshold, cap routed volume to SDR capacity.
- Fix this month: rebuild Tier 1 around late-stage topics (pricing/comparison/vendor) and keep awareness topics in Tier 2/3.
Pattern #2: Precision is fine, but opp lift is flat
- Symptom: Tier 1 precision holds >20%, but treatment vs control opp rate is unchanged.
- Cause: execution isn't translating (slow routing, weak plays, wrong personas), or your KPI window's wrong.
- Fix this week: enforce SLA; require first touch within 2 business days; audit talk tracks.
- Fix this month: change the play (topic-specific messaging, multi-threading, better offers). If you don't change behavior, you're just labeling accounts.
Pattern #3: SLA slips, and everything looks worse
- Symptom: SLA compliance drops under 70-80% and meetings/opps fall.
- Cause: capacity or process break, not signal break.
- Fix: reduce routed volume, rotate coverage, or automate routing. Don't retune topics until execution's stable, otherwise you'll "optimize" your way into a smaller, quieter program that only looks good on paper.
Map topics to journey stages (and measure each stage differently)
Topic selection is where most intent programs get noisy. The fix is to map topics to buyer journey stages and measure each stage on the right KPI.
| Journey stage | Topic examples | Primary KPI | What "good" looks like |
|---|---|---|---|
| Problem aware | "reduce churn," "SOC 2," "forecasting" | engagement + meeting rate | messaging resonance |
| Solution aware | "best X software," "X platform" | meetings per 100 accounts | SDR conversion |
| Vendor aware | competitor names, "alternatives" | opp creation within 60 days | pipeline creation |
| Pricing/comparison | "pricing," "implementation," "ROI" | opp + pipeline lift | highest precision |
| Customer/renewal | "integration," "add-on," "upgrade," competitor research | expansion opps / churn risk | retention lift |
If you measure problem-aware topics on opp creation, you'll call the program a failure. Those topics are top-of-funnel by definition.
Customer intent: churn risk + expansion lift (separate scorecard)
Customer intent is a different game. Measure it separately so you don't mix acquisition and retention economics.
- Churn risk signal: customers researching competitors or "alternatives" topics
- KPI: renewal rate delta, time-to-save, support escalation rate
- Expansion signal: customers researching add-ons, integrations, advanced features
- KPI: expansion opp rate, expansion pipeline per 100 accounts
Run holdouts here too when you can (even a simple "CSM play vs no play" split). Retention lift is often easier to prove than net-new because you've got more baseline history.
If you want one outbound link to sanity-check KPI choices, N.Rich's breakdown is a good reference point: N.Rich's "13 ways to measure intent impact".
What breaks in real life (and how to fix it fast)
Intent fails for boring reasons, not mystical ones.
Common failure modes we've seen (and that Demandzen also calls out):
Scenario 1: "Sales says the accounts are trash"
What's actually happening:
- You routed interest without fit gates, so reps worked accounts that were never viable.
Fix:
- Add fit gating (industry/size/tech stack), demote broad topics, and cap Tier 1 volume.
- Hold the line on SLAs. If reps touch accounts a week late, you're measuring decay, not intent.
Scenario 2: "Marketing says it influenced everything, Finance believes none of it"
What's actually happening:
- View-through and lead source overwrites create a story where every deal looks touched by everything.
Fix:
- Use the influenced pipeline ruleset (timestamp-based windows + recency).
- Then run a holdout. The holdout ends the argument because it answers the only question that matters: did outcomes change?
Scenario 3: "The dashboard looks great, but pipeline doesn't move"
What's actually happening:
- You optimized for internal metrics (influence, clicks, "engaged accounts") without changing sales behavior.
Fix:
- Make the play non-optional: topic-specific sequences, relevant proof points, and multi-threading. (If you need a concrete workflow, use ABM multi-threading.)
- Track speed-to-first-touch and meeting rate as execution gates. If those aren't healthy, don't expect lift.
Look, if your routing takes two weeks, stop tuning topics and fix routing.
Use intent if
- You can prioritize signals (pricing/comparison > generic blog reads).
- You can route fast (same week, not next month).
- You can tailor outreach to the topic and stage.
Skip intent if
- You treat all signals equal (you'll drown reps in junk).
- You rely on a single source (you'll miss context and overfit).
- Your SLAs are slow (intent decays fast).
- Your outreach is generic (you'll get "not interested" and blame the data).
Fast fixes that actually move numbers:
- Build a signal hierarchy: pricing/comparison intent gets Tier 1; broad awareness gets Tier 2/3.
- Blend sources: third-party intent + first-party engagement + fit.
- Route in hours/days, not weeks.
- Change the play: topic-specific talk tracks, relevant case studies, and multi-threading.
You nailed the framework: route fast, touch within 2 days, measure incremental pipeline. But if 30% of your emails bounce, your speed-to-first-touch KPI is dead on arrival. Prospeo refreshes every 7 days - not 6 weeks - so intent-routed accounts get real contacts, not stale records.
Fresh data at $0.01/email beats a perfect intent score with dead contacts.
FAQ
What's the best KPI to measure intent data?
The best KPI is incremental pipeline (or incremental opp rate) from a holdout test, because it shows causality rather than "who touched what." For an early read, track speed-to-first-touch and Tier 1 precision; if SLA compliance is under ~80%, pipeline lift won't show up no matter how good the signal is.
How long should you wait to measure intent impact?
Plan on at least 6 weeks for a first read, because weekly topic sync plus routing and sales-cycle lag makes "week 1 ROI" mostly noise. A practical setup is meetings within 30 days for early signal, then opps within 60 days for the main outcome, with treatment vs control lift reported each cycle.
What does "surge" or "trending intent" mean?
A surge is baseline-relative: the account is researching a topic more than it normally does, not hitting a universal magic number. One common definition is Demandbase Trending Intent: signals increased by two standard deviations in the last 7 days compared to the last 8 weeks, which is why cross-vendor score comparisons don't translate cleanly.
What's a good free tool to make intent routing measurable (not just "influenced")?
A good free starting point is Prospeo's free tier (75 emails + 100 Chrome extension credits/month) to verify and enrich contacts before you run your holdout, so "worked" accounts are actually reachable. Pair it with your CRM reports for SLA compliance and a simple spreadsheet lift table; you'll learn more than another attribution dashboard.
Summary: the simplest way to measure intent data without lying to yourself
If you're serious about how to measure intent data, stop arguing about vendor scores and start measuring your workflow: baseline the cohort, instrument timestamps + SLAs, score signal quality with precision/recall, and prove ROI with a 6-week holdout (treatment vs control lift in opp rate and pipeline). Then use influenced pipeline only as a debugging metric, not the headline.
