Pipeline Generation Calculator (2026): 3 Models + Spreadsheet
Most "pipeline generation calculators" are confidence theater. They hide the math, bake in rosy defaults, and spit out a number you can't defend in a forecast call.
The fix is simple: use three models (coverage, funnel, activity) and keep every assumption visible. Then add pacing and WIP so you don't accidentally plan for 185 open deals and call it "ambitious."
If you searched pipeline generation calculator, start with Calculator 2 (pipeline generated) and Calculator 3 (activity required).
What you need (quick version)
Use this checklist before you touch any calculator. It prevents false precision.
- Revenue target (for the period): monthly/quarterly/annual
- Average deal size (or ARPA)
- Win rate (Opp -> Won, not Lead -> Won)
- Sales cycle length (for pacing/WIP)
- Funnel conversion rates (Lead -> Opp, Meeting -> Opp, etc.)
- Activity rates (connect rate, meeting booked rate, show rate)
- One definition of "pipeline" (weighted or unweighted)
3 things to do this week (the stuff that actually moves the needle):
- Standardize your definitions. Decide what "lead," "SQL," "opportunity," and "pipeline" mean in your CRM and reporting. No exceptions.
- Set coverage using the real rule: Coverage ~= 1/win rate + 10-20% buffer. If you skip the buffer, you're pretending deals don't slip.
- Fix list quality before scaling activity. Bad data inflates every downstream metric (connect rate, reply rate, show rate) and makes your calculator lie. (If you’re diagnosing decay, see data refresh cycle benchmarks.)
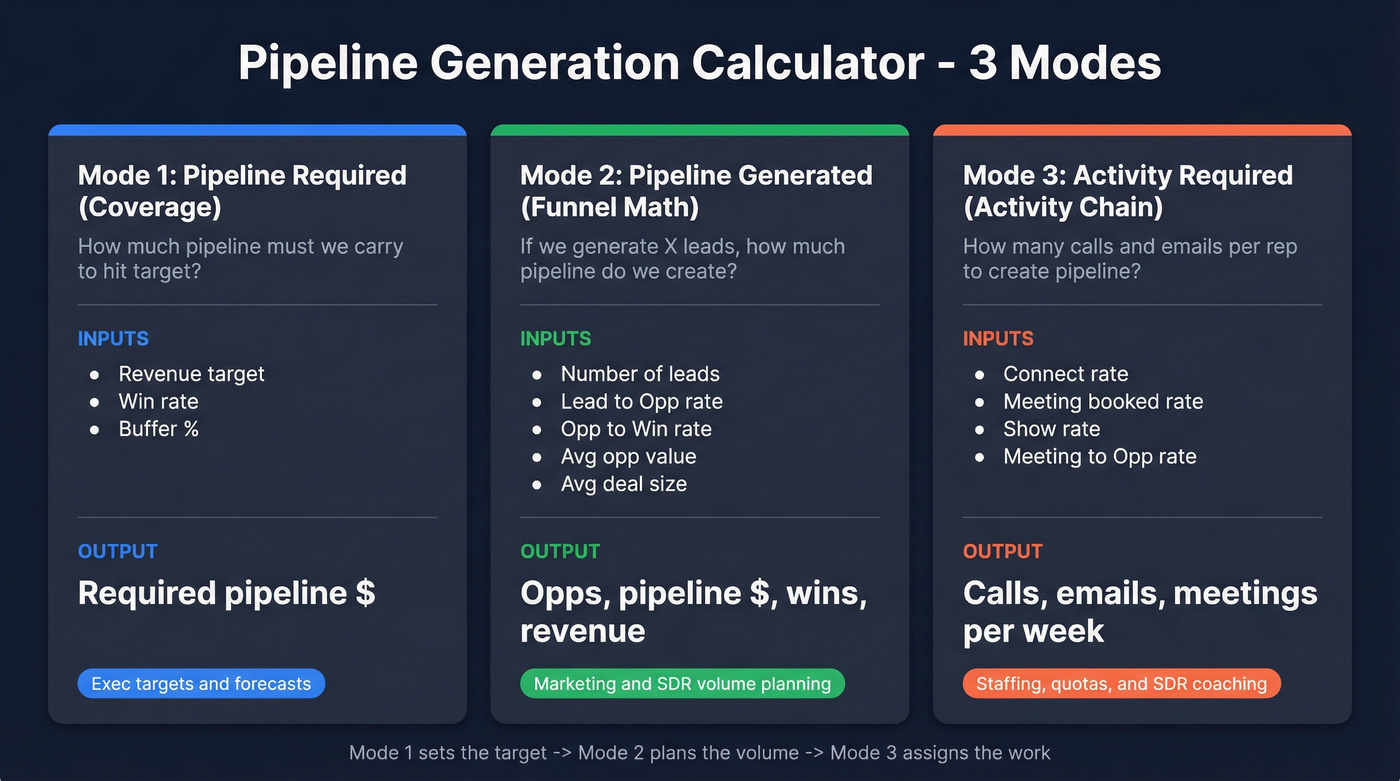
Choose your calculator mode (pick the one that matches your question)
| Mode | What it answers | Inputs you need | Output you get | Use it when... |
|---|---|---|---|---|
| Pipeline required (coverage) | "How much pipeline must we carry to hit target?" | Target, win rate, buffer | Required pipeline $ | You're setting exec targets or sanity-checking a forecast. |
| Pipeline generated (funnel math) | "If we generate X leads, how much pipeline and revenue do we create?" | Leads, L->Opp, Opp->Win, avg values | Opps, pipeline $, wins, revenue | You're planning marketing/SDR volume and want a pipeline number. |
| Activity required (activity chain) | "How many calls/emails per rep to create pipeline?" | Activity->meeting->opp->win rates | Calls/emails/week | You're staffing, quota-setting, or coaching SDR output. |
Quick comparison: popular calculators vs a spreadsheet (what's actually different)
Some calculators give you a single output number. The useful ones do two things a spreadsheet can also do: show the assumptions (conversion rates, selling days, tasks per prospect) and let you add pacing/WIP (new deals/week, concurrent deals, "open window").
If you want to sanity-check vendor defaults, Outreach has a public tool: Outreach's pipeline generation calculator.
Define "pipeline" before you calculate (weighted vs unweighted)
Unweighted pipeline is the raw sum of open opportunity amounts. Five $100k opps open = $500k pipeline. Simple, and usually too optimistic (see pipeline quality for what “good” looks like).
Weighted pipeline multiplies each deal amount by its probability. A $100k deal at 30% = $30k weighted. This only helps if your stage probabilities match reality.
One common HubSpot confusion point is Weighted Amount vs Forecast Amount:
- Weighted Amount = deal amount x deal probability (probability tied to stage)
- Forecast Amount = deal amount x forecast probability (probability tied to forecast category like Pipeline/Best Case/Commit)
Pick one definition for exec reporting, document it, and lock it for the quarter. If you need a framework for the meeting, use a consistent pipeline review cadence.
I've watched teams "fix" a bad quarter by quietly switching from unweighted to weighted mid-stream. It works right up until the CRO asks why coverage dropped 40% overnight.
Start with stage probabilities like: Discovery 10-15%, Demo ~30%, Proposal ~50%, Negotiation up to 80%, Verbal 90-95%. Then replace them with your historical conversion by stage.
Every formula above breaks if your lead-to-opp rate is inflated by bad contact data. Prospeo's 98% email accuracy and 7-day refresh cycle mean your connect rates, reply rates, and show rates reflect reality - not data decay. 15,000+ companies trust it to keep their pipeline math honest.
Stop letting stale data turn your pipeline calculator into fiction.
Calculator 1 - Pipeline required (coverage)
This isn't the main event for "generation," but you still need it to set a sane target.
Formula
Required pipeline (unweighted)
[ \text{Pipeline Required} = \frac{\text{Revenue Target}}{\text{Win Rate}} \times (1 + \text{Buffer}) ]
- Win rate = Opp -> Won (closed-won / closed total)
- Buffer = 10-20% to cover slippage, push-outs, and deal shrink
The practical rule I use (also explained well by HeyIris) is:
Coverage ~= 1/win rate + 10-20% buffer
Example: 25% win rate => 4.5-5x coverage
Quarterly target $500,000, win rate 25%:
- Baseline coverage = 1 / 0.25 = 4.0x
- Add buffer => 4.5-5.0x
So:
- 10% buffer: $500k / 0.25 x 1.10 = $2.2M
- 20% buffer: $500k / 0.25 x 1.20 = $2.4M
Hot take: the "3x pipeline" rule is lazy math
3x coverage implies a ~33% win rate. If your real win rate is 20-25% (normal in mid-market and enterprise), 3x isn't "aggressive." It's a plan to miss. (If you’re rebuilding the system, start with B2B sales pipeline management.)
Coverage cheat sheet (by win rate)
| Win rate | Baseline coverage | With 10-20% buffer |
|---|---|---|
| 40% | 2.5x | 2.8-3.0x |
| 33% | 3.0x | 3.3-3.6x |
| 25% | 4.0x | 4.5-5.0x |
| 20% | 5.0x | 5.5-6.0x |
| 15% | 6.7x | 7.4-8.0x |

If you run weighted pipeline coverage, your ratio looks lower because probability's already applied. Use 2.1x weighted coverage as a starting benchmark in the $5M-$50M ARR band, and 2.8x if you want top-quartile discipline.
Calculator 2 - Pipeline generated (leads -> opps -> pipeline $ -> wins -> $)
This is what most people mean when they type "pipeline generation calculator": start with lead volume and conversion rates, output pipeline created and revenue.
Inputs
Use these five inputs:
- Number of leads
- Lead-to-Opportunity rate (%)
- Average opportunity value ($) (the amount you set when an opp's created)
- Opportunity-to-Win rate (%)
- Average deal size ($) (closed-won average)
If your team sets opportunity amount equal to expected deal size at creation, set Avg opp value = Avg deal size and keep it simple.
Outputs + formulas (copy/paste logic)
Opportunities created [ \text{Opps} = \text{Leads} \times (\text{Lead->Opp}) ]
Pipeline generated ($) [ \text{Pipeline $} = \text{Opps} \times \text{Avg Opp Value} ]
Wins [ \text{Wins} = \text{Opps} \times (\text{Opp->Win}) ]
Revenue [ \text{Revenue} = \text{Wins} \times \text{Avg Deal Size} ]
Worked example: 1,000 leads -> $500k pipeline -> $125k revenue
Assume:
- Leads = 1,000
- Lead -> Opp = 10%
- Avg opp value = $5,000
- Opp -> Win = 25%
- Avg deal size = $5,000

Math:
- Opps = 1,000 x 0.10 = 100
- Pipeline generated = 100 x $5,000 = $500,000
- Wins = 100 x 0.25 = 25
- Revenue = 25 x $5,000 = $125,000
This is the cleanest "generation" view: volume -> pipeline created -> revenue.
If your output looks insane, check these 3 inputs first
- Lead->Opp rate: teams accidentally use "meeting booked" as "opportunity" and inflate opp volume.
- Avg opp value: if reps set $1 on opp creation, your pipeline $ looks broken even when activity's fine.
- Segment mix: SMB inbound and enterprise outbound are different businesses. Don't blend their rates. (If you need a simple way to tier, use account segmentation.)
One more that bites people: if marketing counts "leads" as form fills but sales counts "leads" as worked prospects, your spreadsheet's dead on arrival.
Defaults & benchmarks (so you're not guessing)
If you don't have historicals, you still need a starting point. Use defaults for 30 days, then replace them with your own numbers.
Win rate presets by deal size (use these first)
Optif.ai published win-rate-by-ACV cuts across 939 B2B SaaS companies. Use the median:

| Segment (by ACV) | Win rate range | Median |
|---|---|---|
| SMB (under five figures) | 28-35% | 31% |
| Mid-market ($10k-$50k) | 20-28% | 24% |
| Upper mid ($50k-$100k) | 15-22% | 18% |
| Enterprise (>$100k) | 12-18% | 15% |
Activity benchmarks (outbound reality checks)
Gradient's SDR benchmark roundup is a solid guardrail:
- Cold email reply rate: 1-5%
- Meeting show rate: 70-85%
- Touches per account: 16 touches/account
- Dials per connect: 18+ dials/connect
Use these as guardrails, not goals.
Here's the thing: if your list is stale, none of these benchmarks matter.
The industry average data refresh cycle is 6 weeks. If your contact data updates that slowly, connect rate and reply rate decay every week even if your reps do everything right, and your "activity required" model turns into a bad joke. (For a practical QA workflow, see BDR contact data.)
Calculator 3 - Activity required (back into calls/emails)
Coverage tells you the destination. Funnel math tells you what volume should produce. Activity math tells you what reps do on Monday.
We don't run this as "definition -> formula -> example" in real life. We start from meetings, because meetings are the first thing you can actually coach and inspect, and then we work backward through the chain until the required activity shows up on a rep's calendar.
Step 1: decide the weekly pipeline target (not just activity)
Pick a pipeline goal per rep per week: [ \text{Pipeline $/week} = \frac{\text{Pipeline Required}}{\text{Weeks in Period}} ]
Then translate it into opps: [ \text{Opps/week} = \frac{\text{Pipeline $/week}}{\text{Avg Opp Value}} ]
Step 2: convert opps/week into meetings/week
[ \text{Meetings/week} = \frac{\text{Opps/week}}{\text{Meeting->Opp}} ]
Step 3: convert meetings/week into calls/emails/week
Use your activity chain: [ \text{Activities/week} = \frac{\text{Meetings/week}}{(\text{Connect Rate}) \times (\text{Meeting Booked Rate}) \times (\text{Show Rate})} ]
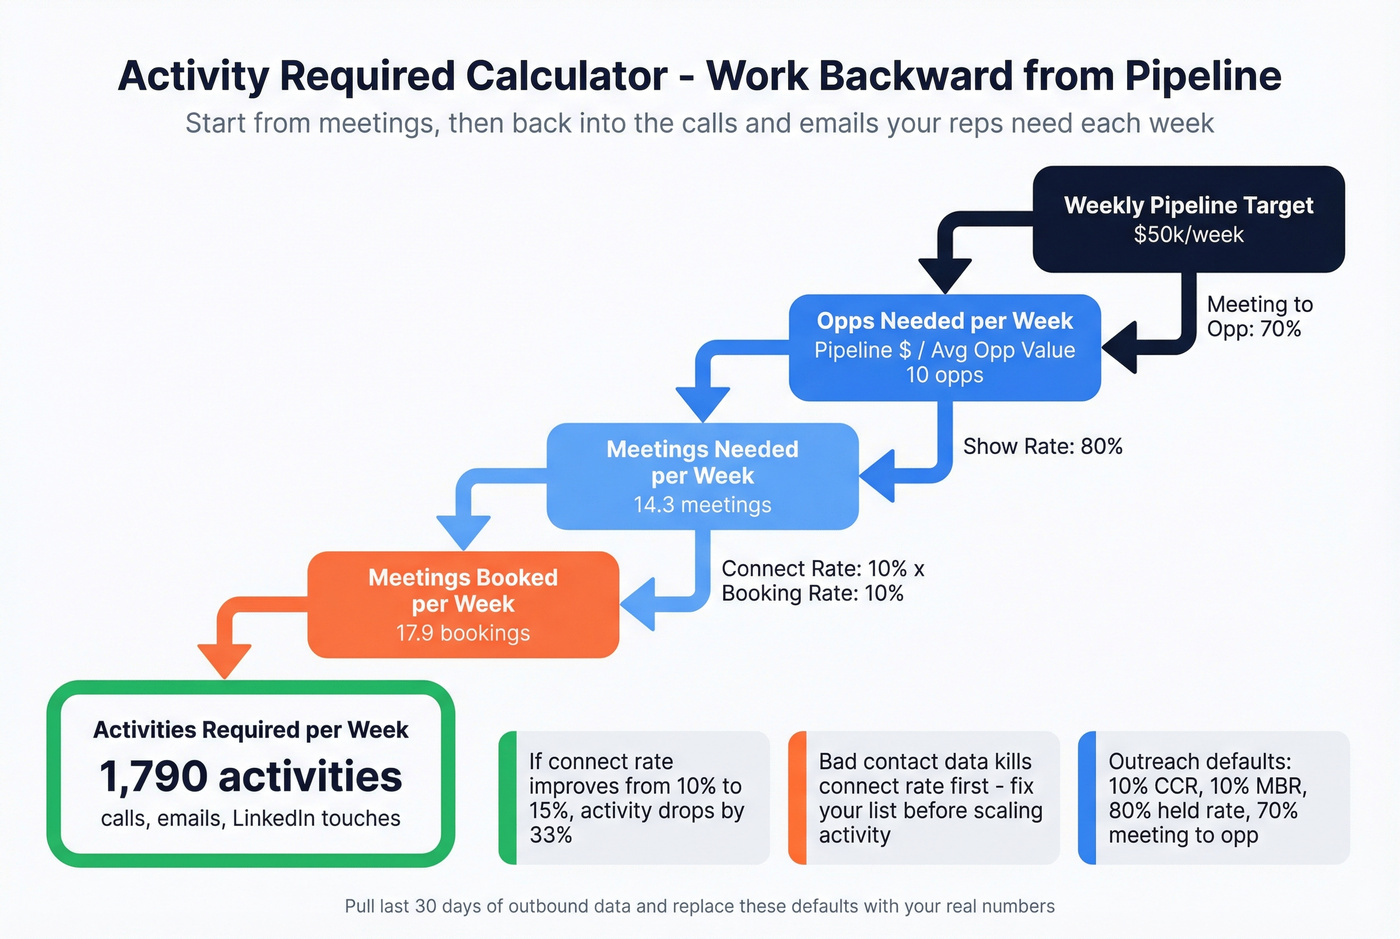
You can split "Activities" into calls + emails, but the math's the same: each step is a conversion rate, and weak steps explode the workload. (To tighten definitions, see contact rate vs connect rate.)
Outreach strike-zone defaults (CCR/MBR) you should steal, then replace
Outreach's calculator uses defaults that match how SDR teams operate. Use them as a baseline if you've got no data:
- Correct Connect Rate (CCR): 10%
- Meeting Booked Rate (MBR): 10%
- Held rate: 80%
- Meeting -> qualified opportunity: 70%
- 60 selling days
- 7 call tasks per prospect
How to replace them without overthinking:
- Pull last 30 days of outbound activity.
- Compute CCR = correct connects / dials.
- Compute MBR = meetings booked / correct connects.
- Compute held rate = meetings held / meetings booked.
- Compute meeting->opp = opps created / meetings held.
- Lock those rates for the next 2 weeks, then update again.
Worked example (simple, staffing-friendly)
Assume per rep per week:
- Pipeline goal = $50,000
- Avg opp value = $10,000 => Opps/week = 50,000 / 10,000 = 5
- Meeting->Opp = 50% => Meetings/week = 5 / 0.50 = 10
- CCR = 10%, MBR = 10%, Show = 80%
Activities/week:
- Meetings booked needed = 10 / 0.80 = 12.5
- Correct connects needed = 12.5 / 0.10 = 125
- Dials needed = 125 / 0.10 = 1,250 dials/week
That number should feel brutal.
I've seen teams stare at it, go quiet, and then finally admit the real problem wasn't "SDR effort" at all - it was ICP sprawl, weak lists, and a meeting->opp rate that looked fine only because nobody enforced qualification. Fix one of those, and the dial count drops fast. Ignore them, and you burn out good reps trying to brute-force bad math.
Skip this model if you're not willing to measure CCR, booked rate, and held rate weekly. Otherwise you'll just argue about the inputs forever.
Pacing & WIP (deals per week, concurrent deals, and the window to open new deals)
Even if your totals are right, you can still miss because you opened deals too late or carried too many at once.
Core pacing formulas
Wins you need [ \text{Wins Needed} = \frac{\text{Revenue Target}}{\text{Avg Deal Size}} ]
Open deals required [ \text{Open Deals Required} = \frac{\text{Wins Needed}}{\text{Win Rate}} ]
New deals per week [ \text{New Deals/Week} = \frac{\text{Open Deals Required}}{\text{Weeks in Period}} ]
Concurrent open deals (WIP) - good planning approximation [ \text{WIP} = \text{New Deals/Week} \times \text{Sales Cycle (weeks)} ]
Window to open new deals (weeks) [ \text{Open Window} = \text{Weeks in Period} - \text{Sales Cycle (weeks)} ]
If you open an opportunity after the window closes, it's not closing in-period unless your cycle's shorter than you think or you're in a weird, one-off spike.
Numeric illustration (the one that wakes people up)
Assume:
- Target = $500,000
- Avg deal = $5,000
- Win rate = 25%
- Period = 13 weeks
- Sales cycle = 6 weeks
Compute:
- Wins needed = 500,000 / 5,000 = 100
- Open deals required = 100 / 0.25 = 400
- New deals/week = 400 / 13 = 30.8
- WIP = 30.8 x 6 = 184.8 concurrent open deals
- Open window = 13 - 6 = 7 weeks
Real talk: if your process can't handle ~185 live opps, your plan's broken even if the spreadsheet "balances."
Spreadsheet template (ungated): fields + copy/paste formulas
We keep hearing the same request: a plug-and-play spreadsheet with the equations visible. That's what this template is.
You need two things:
- A deal table with canonical fields (so pipeline's measurable)
- A calculator tab with transparent formulas (so targets are explainable)
Canonical deal fields (copy these columns)
- Deal name
- Account
- Stage
- Probability
- Amount
- Expected close date
- Next step
- Owner
- Source (inbound/outbound/partner)
- Forecast category (Pipeline / Best case / Commit)
- Created date
- Stage entered date
- Last activity date
- Notes
- Deal age (days) = today - created date (optional but high-value)
- Days in stage = today - stage entered date (optional but high-value)
If you're missing next step and close date, your pipeline report's basically vibes.
Template table (calculator inputs + formulas)
| Cell | Field | Example | Formula (copy/paste) |
|---|---|---|---|
| B2 | Revenue target | 500000 | (input) |
| B3 | Avg deal size | 5000 | (input) |
| B4 | Win rate | 0.25 | (input) |
| B5 | Buffer | 0.15 | (input) |
| B6 | Lead->Opp | 0.10 | (input) |
| B7 | Avg opp value | 5000 | (input) |
| B8 | Wins needed | 100 | =B2/B3 |
| B9 | Opps needed | 400 | =B8/B4 |
| B10 | Pipeline required | 2300000 | =(B2/B4)*(1+B5) |
| B11 | Pipeline generated (from leads) | 500000 | =(Leads*B6)*B7 |
And here's the combined "don't-make-me-think" formula many teams use for top-of-funnel planning:
[ \text{Opps} = \frac{\text{Revenue Target}}{\text{Avg Deal} \times \text{Win Rate}} ]
Then: [ \text{Leads} = \frac{\text{Opps}}{\text{Lead->Opp}} ]
Checklist to make the spreadsheet exec-safe
- Stage probabilities are documented and consistent
- Weighted vs unweighted pipeline is explicit
- Win rate is Opp -> Won (not lead-based)
- Buffer is included (10-20%)
- Segment filters exist (SMB vs enterprise tabs, or at least a segment column)
- A "last updated" date is visible on the calculator tab
Common mistakes that break every pipeline calculator
- Optimistic assumptions. If your win rate was 30% two quarters ago and now it's 22%, your model's wrong.
- Mixing definitions. If "SQL" means "booked meeting" to SDRs and "qualified opp" to AEs, your conversion rates are garbage. (Use a formal lead qualification process to stop the drift.)
- Ignoring leakage steps. No-shows, stalled opps, and unworked leads are real funnel stages. Model them or eat the miss.
- Chasing volume over quality. More activity doesn't fix bad targeting. It burns rep time and domain reputation.
- Black-box defaults. Hidden assumptions are why calculators feel "accurate" right up until they aren't.
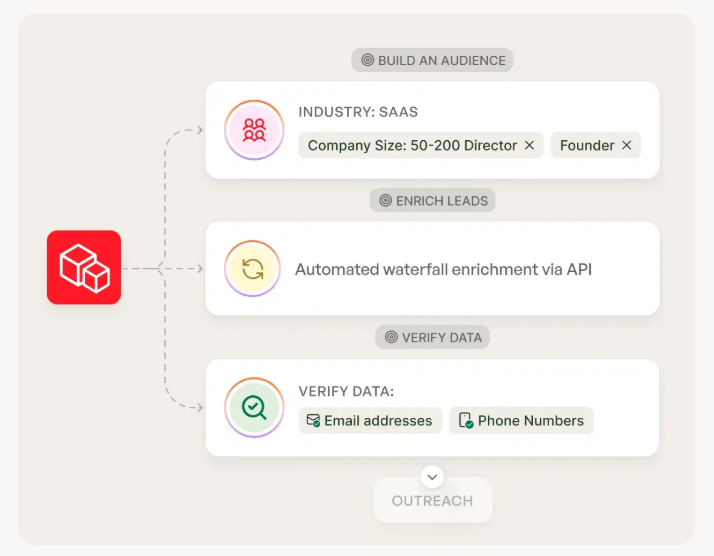
Execution layer - get the contacts that make the math real
Every pipeline model has a hidden variable: reachability. If your emails bounce and your dials don't connect, your "required activity" turns into a punishment plan. (If you’re troubleshooting bounces, start with 550 Recipient Rejected.)
Prospeo ("The B2B data platform built for accuracy") is built for exactly this: 98% verified email accuracy, a 7-day refresh cycle (vs a 6-week industry average), and 125M+ verified mobile numbers with a 30% pickup rate. That combination makes your CCR, reply rate, and meeting rates stop swinging wildly week to week, which is the difference between a model you can run and a model you argue about.
Here's the clean mapping from calculator inputs to what breaks them:
| Calculator input | What breaks it in real life | Fix |
|---|---|---|
| Reply rate | bounces + spam traps | verify emails before you export and sequence |
| CCR / connect rate | wrong numbers + stale roles | use verified mobiles and fresh records |
| Lead->Opp | leads are "real" but unreachable | verify reachability before reps spend touches |
| Activities per meeting | wasted touches on bad-fit accounts | tighten targeting with firm filters and intent signals |
A scenario we see a lot: a team hits the activity number, misses meetings anyway, and leadership blames reps; then someone checks deliverability and finds bounce rates north of 20%, which means the "activity required" calculation was never describing reality in the first place, it was describing a world where the contacts were reachable.

Calculator 3 says you need 200 calls a week per rep. But if 35% bounce, you actually need 300. Prospeo delivers 143M+ verified emails with under 4% bounce rates - so the activity targets you set are the ones your team actually hits.
Cut the phantom activity and hit real pipeline numbers.
FAQ
What's the difference between pipeline coverage and pipeline generation?
Coverage is pipeline required to hit a revenue goal: target / win rate, plus a 10-20% buffer. Generation is pipeline created from leads and activity: leads -> opps -> pipeline $ -> wins -> revenue. Coverage sets the bar; generation is how you clear it.
Should I use weighted or unweighted pipeline in my calculator?
Pick one and stick to it for exec reporting. Unweighted is raw open $. Weighted is open $ x probability. Weighted's only trustworthy when stage probabilities match historical conversion; otherwise it's optimism with decimals.
What win rate should I use if I don't have historical data?
Start with the median by ACV (SMB 31%, mid-market 24%, upper mid 18%, enterprise 15%), run it for 30 days, then replace it with your CRM's Opp->Won rate for the same segment and source mix.
Summary: how to use this pipeline generation calculator without lying to yourself
Use Calculator 1 to set coverage, Calculator 2 to translate lead volume into pipeline created, and Calculator 3 to turn that into weekly rep activity. Then add pacing/WIP so your plan survives reality.
If you want your pipeline generation calculator outputs to hold up in a forecast call, fix reachability first. Bad data makes every "required activity" number explode.