Pipeline Strategy in 2026: Benchmarks, Formulas, and the Math That Actually Moves Deals
Average quota attainment in 2026 is 43%. Billions go into sales tech every year, and more than half of reps still miss their number. The problem isn't a lack of pipeline - it's a lack of pipeline that means anything.
A strong pipeline strategy doesn't start with more deals in your CRM. It starts with fewer deals that actually close.
Most pipeline generation approaches are built on vibes. A rep says a deal is "looking good." A manager eyeballs coverage and calls it sufficient. The forecast goes in, the quarter ends, and everyone's surprised. The fix isn't motivational - it's mathematical. Teams that consistently hit plan aren't working harder; they're working from better numbers, cleaner data, and a review cadence that catches problems before they become misses.
What You Need (Quick Version)
- Probability-weighted coverage - not just raw coverage. A 3.4x raw pipeline that's really 1.8x weighted is a 1.6x gap of phantom deals.
- Weekly 1:1 pipeline reviews using the Create-Advance-Close framework. Teams that review pipeline weekly hit 87% forecast accuracy.
- Contact data quality first. If ~25-30% of your emails bounce, every pipeline metric you calculate is fiction.
What Is a Pipeline Strategy?
A pipeline strategy is the system you use to generate, qualify, advance, and close enough deals to hit your revenue target. It's not the same as a funnel - a funnel describes aggregate conversion rates across the buyer journey, while a pipeline is a deal-level view of active opportunities by stage. Your pipeline is where the work happens.
Here's the thing: most pipelines are wish lists. They're stuffed with deals that haven't moved in weeks, contacts who ghosted after the first call, and "opportunities" that exist only because a rep logged them to hit an activity metric. The result is phantom pipeline - the gap between what your CRM says you have and what you'll actually close.
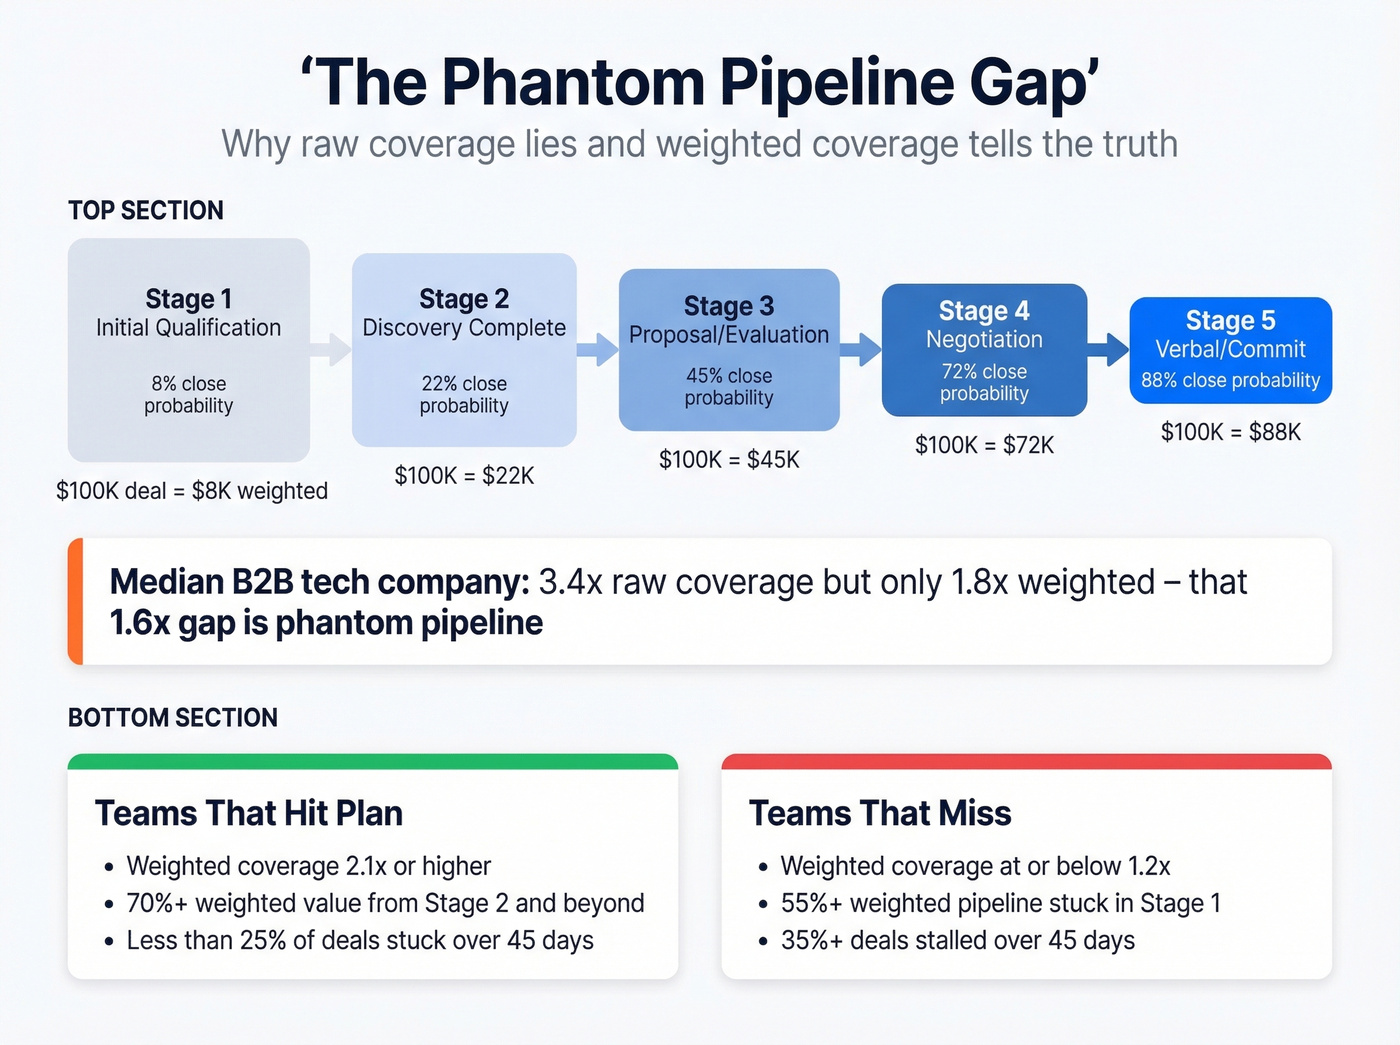
The median B2B tech company carries 3.4x raw coverage but only 1.8x probability-weighted coverage. That 1.6x gap is phantom pipeline, and it's the reason your forecast looks healthy on Monday and collapses by Friday. Fixing this gap is what separates a real deal-advancement system from a pipeline spreadsheet.
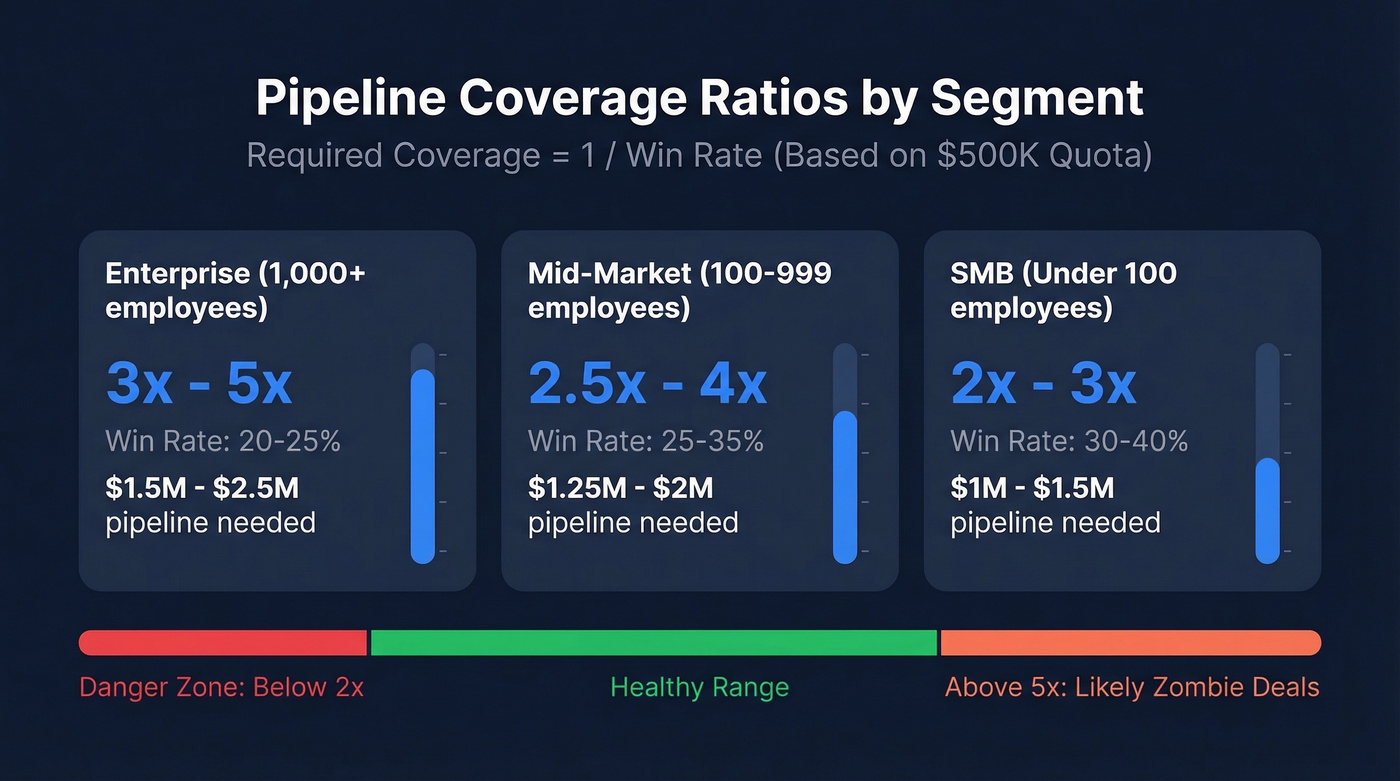
Coverage Ratios by Segment
The basic formula is simple: required coverage = 1 / win rate. Close 20% of deals? You need 5x coverage. Close 35%? Roughly 3x.
| Segment | Typical Win Rate | Required Coverage | Example ($500K Quota) |
|---|---|---|---|
| Enterprise (1,000+) | 20-25% | 3x-5x | $1.5M-$2.5M |
| Mid-Market (100-999) | 25-35% | 2.5x-4x | $1.25M-$2M |
| SMB (<100) | 30-40% | 2x-3x | $1M-$1.5M |
For an enterprise rep with a $500K quota and a 20% win rate, that's $2.5M in required pipeline - minimum. Below 2x coverage, you're in danger. Above 5x, you're hoarding zombie deals that inflate the number without improving outcomes. For a deeper breakdown, use this pipeline coverage guide.
Probability-Weighted Coverage
Raw coverage is the number everyone reports. Probability-weighted coverage is the number that actually predicts whether you'll hit plan.
Each stage carries a different probability of closing. Here are the benchmarks for B2B tech:
| Stage | Close Probability |
|---|---|
| Stage 1 (Initial Qualification) | 8% |
| Stage 2 (Discovery Complete) | 22% |
| Stage 3 (Proposal/Evaluation) | 45% |
| Stage 4 (Negotiation) | 72% |
| Stage 5 (Verbal/Commit) | 88% |
A $100K deal in Stage 1 is worth $8K in weighted pipeline. That same deal in Stage 4 is worth $72K. Most companies have 55-65% of their total pipeline dollars sitting in Stage 1, which is why raw coverage looks healthy while weighted coverage tells the truth.
The diagnostic profiles are clear. Companies that hit plan carry weighted coverage of 2.1x or higher, with 70%+ of weighted value from Stage 2 and beyond, and less than 25% of pipeline stuck in the same stage for more than 45 days. Companies that miss? Weighted coverage at or below 1.2x, 55%+ of weighted pipeline in Stage 1, and 35%+ of deals stuck for over 45 days.
If you're only tracking raw coverage, you're flying blind. Track pipeline health alongside coverage so you can spot stalls early.
How to Calculate Sales Velocity
Sales velocity tells you how much revenue your pipeline generates per day. Tools like Forecastio surface this metric, but the formula is straightforward:
Sales Velocity = (Opportunities x Avg Deal Size x Win Rate) / Sales Cycle Length
Run the numbers: 100 opportunities, a $10K average deal, a 20% win rate, and a 50-day sales cycle.
100 x $10,000 x 0.20 / 50 = $4,000/day
That's your baseline. Now diagnose what's dragging it down. Velocity drops when cycle length increases or win rate decreases - and both tend to happen simultaneously when deals stall. Forecastio's analysis (citing Harvard Business Review) puts 40-60% of deal losses in the "no decision" bucket. That's the silent killer of velocity: deals that never say no, they just stop moving.
Our take: If your average contract value sits below $15K, you don't need a sophisticated velocity model. You need faster disqualification and higher volume. Velocity math matters most when deals are large enough that losing one changes the quarter.
Segment your velocity calculation. Don't mix enterprise deals with SMB deals in the same formula - their cycle lengths and win rates are so different that a blended number tells you nothing useful. If you want benchmarks and levers, see sales velocity.
Stage Conversion Benchmarks
Knowing where pipeline breaks is just as important as knowing how much you have. Here are stage-by-stage conversion benchmarks from First Page Sage's benchmark report:
| Industry | Lead to MQL | MQL to SQL | SQL to Opp | SQL to Closed |
|---|---|---|---|---|
| B2B SaaS | 39% | 38% | 42% | 37% |
| Financial Services | 41% | 34% | 38% | 32% |
| Cybersecurity | 37% | 36% | 40% | 35% |
| Manufacturing | 40% | 32% | 36% | 30% |
The biggest bottleneck for most teams shows up in the middle of the funnel - especially MQL to SQL, where marketing-generated leads die because they weren't actually ready to talk to sales. (If you need examples and math, compare against these B2B sales funnel stages.)
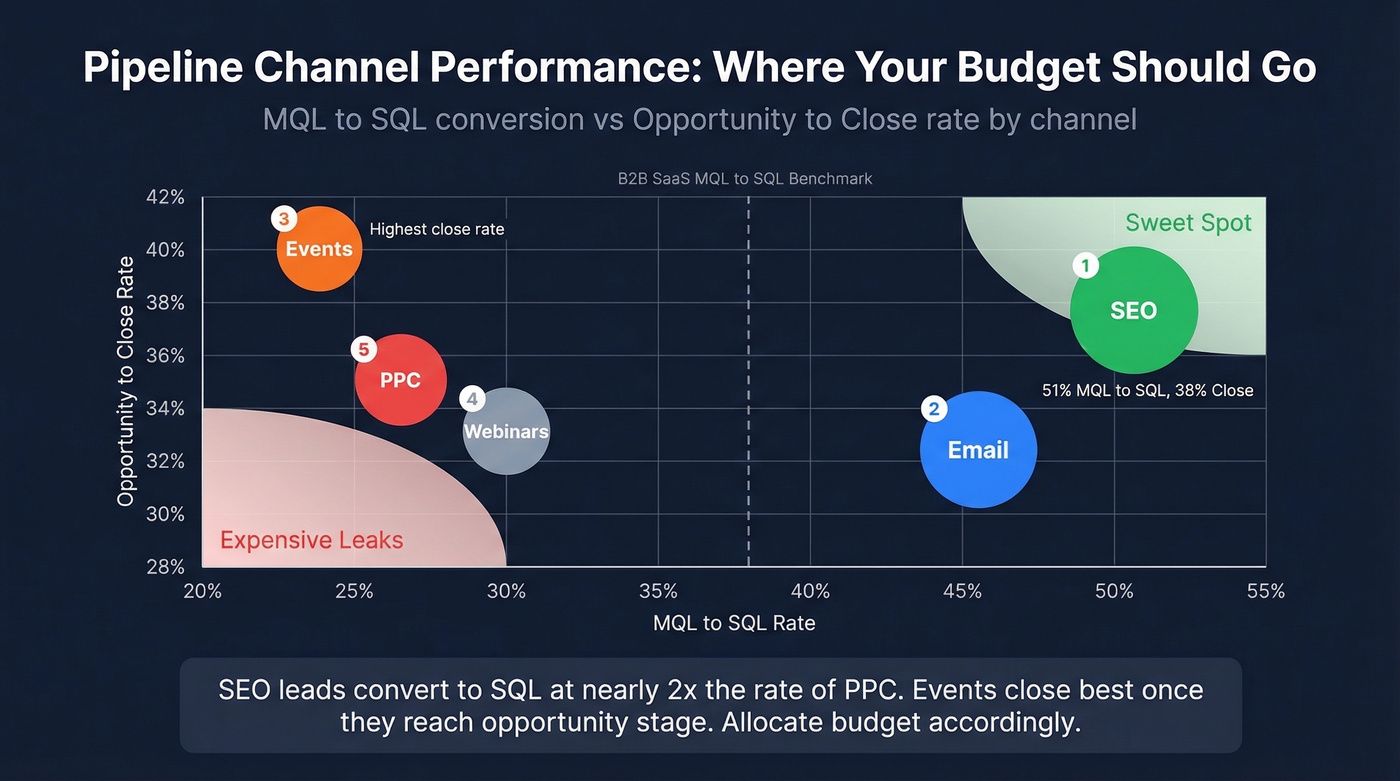
But the channel you use to generate those leads matters just as much as the volume:
| Channel | MQL to SQL | Opp to Close |
|---|---|---|
| SEO | 51% | 38% |
| 46% | 32% | |
| Events | 24% | 40% |
| Webinars | 30% | 33% |
| PPC | 26% | 35% |
SEO leads convert to SQL at nearly double the rate of PPC leads. Events have the highest close rate once a deal reaches opportunity stage. These aren't small differences - they should reshape how you allocate pipeline generation budget. If you're pouring money into PPC while ignoring SEO, you're buying expensive top-of-funnel that leaks before it ever reaches a rep.
That 1.6x phantom pipeline gap? It starts with bad contact data. If ~30% of your emails bounce, every coverage ratio, velocity calc, and weighted forecast you build is fiction. Prospeo delivers 98% email accuracy with a 7-day refresh cycle - so the pipeline you measure is the pipeline you actually have.
Stop forecasting on phantom pipeline. Start with data that connects.
Segmenting Your Approach
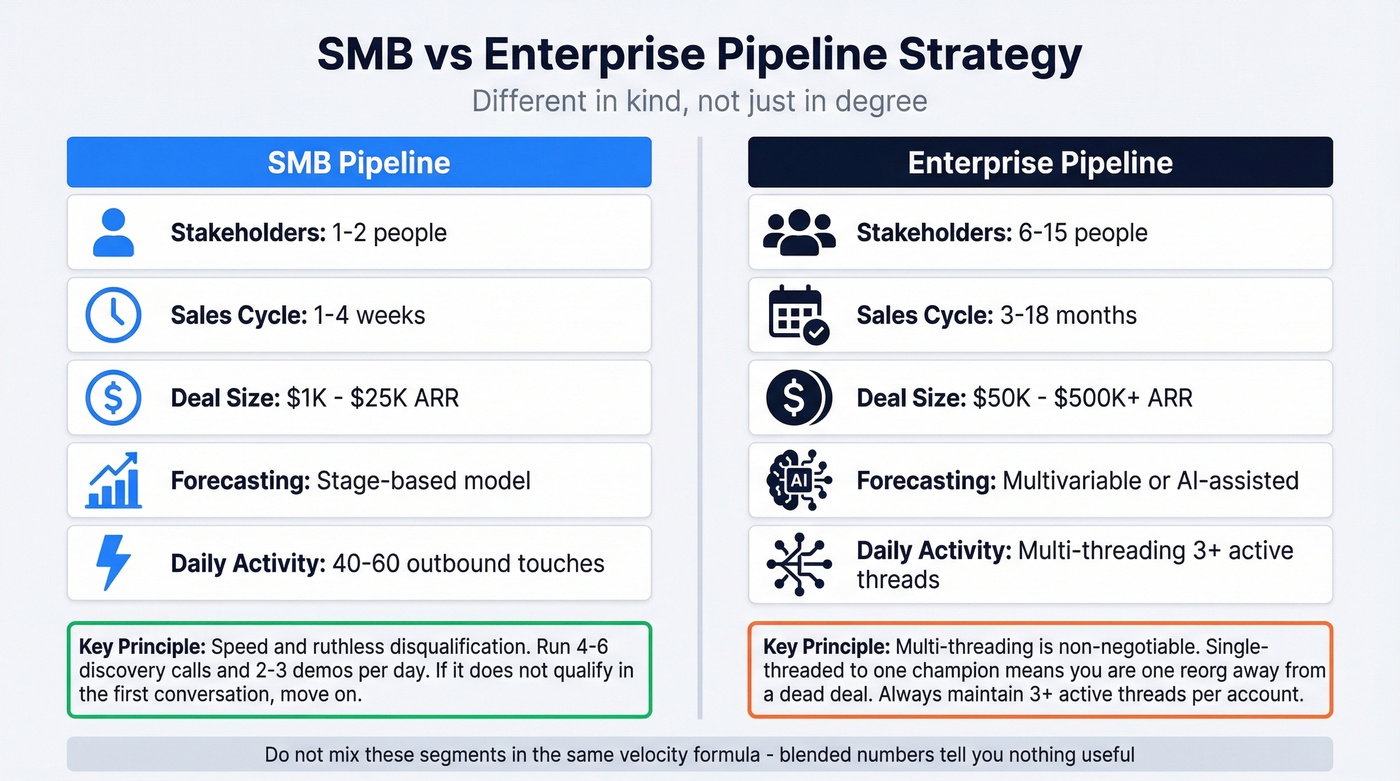
SMB and enterprise pipeline generation playbooks aren't different in degree - they're different in kind.
| Dimension | SMB | Enterprise |
|---|---|---|
| Stakeholders | 1-2 | 6-15 |
| Sales Cycle | 1-4 weeks | 3-18 months |
| Deal Size | $1K-$25K ARR | $50K-$500K+ ARR |
| Forecasting Model | Stage-based | Multivariable/AI |
| Daily Activity | 40-60 outbound touches | Multi-threading 3+ threads |
For SMB, speed and ruthless qualification are everything. A rep should run 4-6 discovery calls and 2-3 demos per day. If a deal doesn't qualify in the first conversation, move on.
Enterprise is the opposite game. Multi-threading is non-negotiable - if you're single-threaded to one champion, you're one reorg away from a dead deal. Always maintain 3+ active threads within an account. Forecasting needs to account for procurement cycles, multiple stakeholders, and deal nuance that a simple stage-based model can't capture. Tools like Clari and Gong help here, but the underlying discipline is the same: know who's involved, know what's blocking, and know the real timeline. If you need a stage map with exit criteria, use these SaaS sales pipeline stages.
Filling the Pipe with Signals
The Signal-Based Shift
Here's a pattern we keep seeing: MQLs are up 20-30%, but close rates are down 15% and enterprise sales cycles are 25% longer. More pipeline, less revenue. 79% of marketing leads never convert because they lack a "why now" trigger. SDRs waste 40-60% of their time filtering low-intent leads that were never going to buy.
Async video tools and AI agents have their place, but they're execution layers - they don't fix a pipeline built on bad data or wrong-segment coverage ratios. The real fix is shifting from volume-based to signal-based targeting. Instead of blasting every company that fits your ICP, focus on accounts showing intent density - a concentration of buying signals that indicate active evaluation. (If you’re rebuilding your targeting, start with an ABM list that won’t decay.)
Five Steps to a Generation Plan
- Align sales and marketing on pipeline definitions. If marketing counts an MQL differently than sales counts an SQL, your funnel metrics are meaningless. Use a B2B marketing and sales alignment checklist to lock definitions.
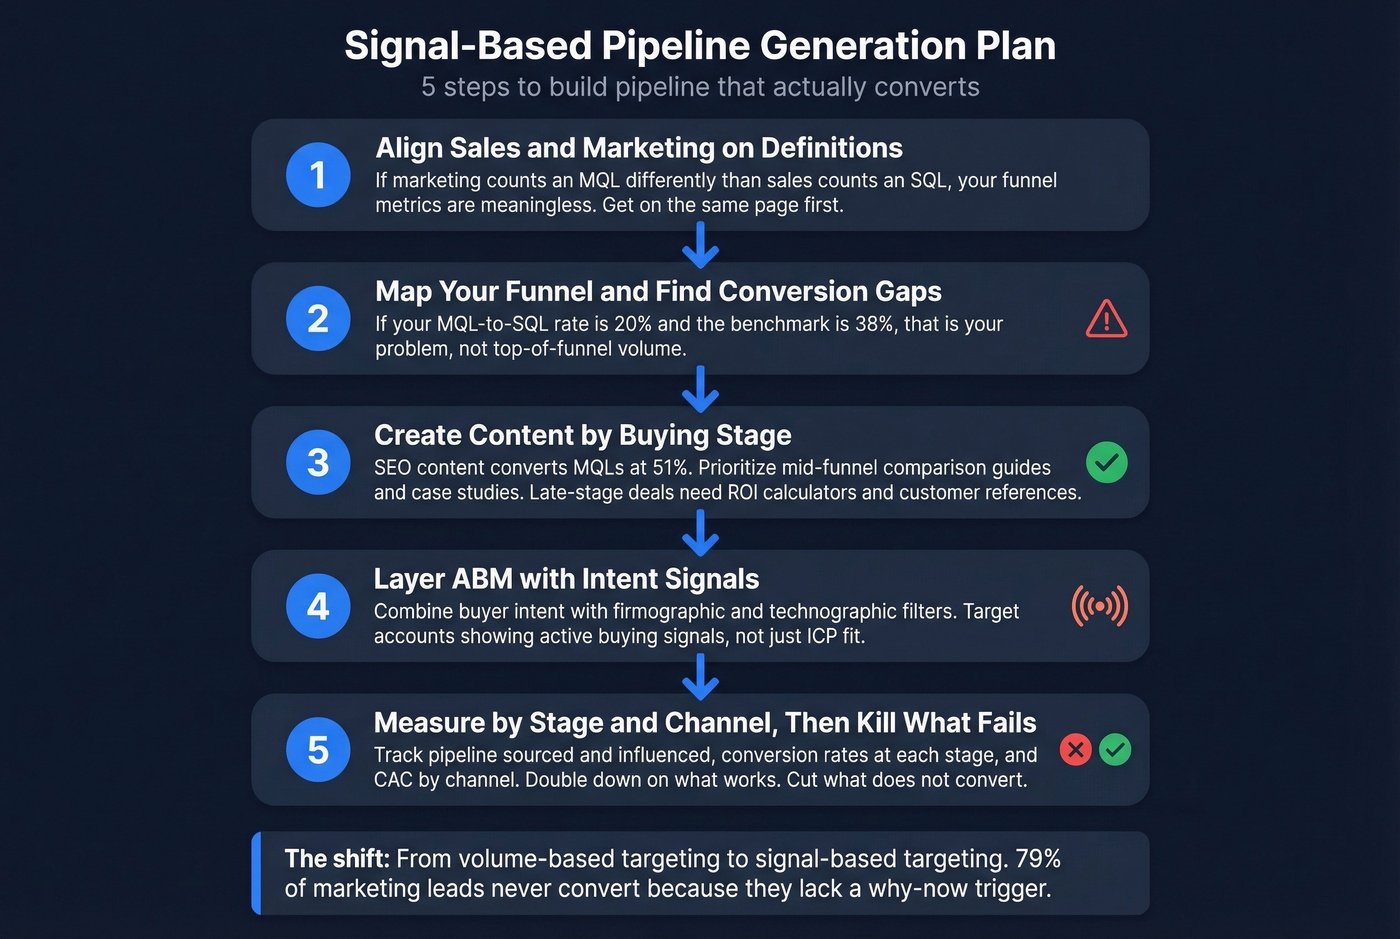
Map your funnel and find conversion gaps. Use the benchmarks above - if your MQL-to-SQL rate is 20% and the benchmark is 38%, that's your problem, not top-of-funnel volume. Track it with the right funnel metrics.
Create content by buying stage. SEO-driven content converts MQLs at 51%, so prioritize mid-funnel comparison guides and case studies for organic. Late-stage deals need ROI calculators and customer references.
Layer ABM with intent signals. Combine buyer intent with firmographic and technographic filters - Prospeo tracks 15,000 intent topics via Bombora, paired with 30+ search filters to surface accounts showing active buying signals.
Measure conversion by stage and channel, then kill what doesn't convert. Track pipeline sourced and influenced, conversion rates at each stage, and CAC by channel. Double down on what works. Skip channels that produce volume without pipeline. If you need a system for this, use B2B sales pipeline management rules and KPIs.
The Data Quality Problem Nobody Talks About
You build a list of 5,000 prospects. Your email tool says they're "verified." You load them into HubSpot or Outreach and launch your sequence. Two days later, 1,400 emails have bounced. That's a 28% bounce rate - enough to tank your sender reputation, get your domain flagged, and make every subsequent sequence less effective.
The damage goes deeper than deliverability, though. Those 1,400 bounced contacts were in your pipeline math. They inflated your coverage ratio. They made your velocity calculation look better than reality. Every metric downstream of bad data is a lie.
No generation playbook survives contact data that's 30% stale. If you want a cleanup checklist, start with pipeline hygiene.
When Snyk rolled out Prospeo's 300M+ professional profiles - 143M+ verified emails at 98% accuracy - to 50 AEs, bounce rates dropped from 35-40% to under 5% and AE-sourced pipeline jumped 180%. Meritt saw pipeline triple from $100K to $300K per week. The common thread isn't magic. It's that clean data on a 7-day refresh cycle makes every other part of your revenue engine actually work.

The industry average for data refresh is six weeks. In six weeks, people change jobs, companies get acquired, and email addresses go dead. A weekly refresh cycle isn't a nice-to-have - it's the difference between pipeline math that reflects reality and pipeline math that's fiction.
Building a Review Cadence That Works
Cancel your teamwide pipeline reviews. Salesforce's own recommendation is to keep reviews between rep and manager, not broadcast them to the whole team. The only exception is multi-rep deals that need cross-functional coordination.
The format that works is a 30-minute weekly 1:1 built around the Create-Advance-Close framework. For a template and agenda, use this pipeline reviews guide.
Create - What new pipeline did you generate this week? Are you prospecting consistently, or are you in feast-or-famine mode? This prevents the empty-pipe surprise that hits in week 8 of the quarter.
Advance - Which deals moved forward? Which ones didn't? For stalled deals, the questions are specific: Why this commit date? Who's involved on their side? What customer indicators exist that this is real?
Close - What's closing this week or next? What's the obstacle? What do you need from me to remove it?
The coaching principle is inputs over outcomes. Don't just ask "will you close this?" Ask about execution quality - the number of stakeholders engaged, the quality of the business case, whether the economic buyer has been involved. Practitioners on r/sales describe this as the difference between a "forecast check" and an actual coaching conversation. The forecast check is theater. The coaching conversation moves deals.
Teams that run this cadence weekly achieve 87% forecast accuracy across a dataset of 247 B2B organizations. Teams that review monthly or ad hoc? They're guessing.
Mistakes That Kill Your Quarter
1. Inconsistent prospecting. When reps get busy closing late-stage deals, top-of-funnel activity drops to zero. Then the quarter ends, the pipe is empty, and the cycle repeats. Practitioners on r/salestechniques consistently cite a daily 30-minute prospecting block as the single habit that prevents this feast-or-famine spiral. Protect it like a customer meeting - even when you're buried in deals.
2. Poor lead qualification. Without a framework like MEDDIC or BANT, reps fill the pipeline with deals that were never real. Qualification isn't about being picky - it's about being honest about which deals have a path to close. If you need a refresher, start with the BANT framework.
3. Letting leads go cold. Practitioner data consistently shows that deals often require a 5th or 6th touch before they convert. Most reps give up after two or three. Build follow-up sequences that keep warm leads engaged without being annoying.
4. Keeping zombie deals. That deal that's been in Stage 2 for 90 days? It's dead. Kill it. Zombie deals inflate your coverage ratio, distort your forecast, and give everyone false confidence. The faster you recognize a no-decision, the sooner you can replace it with something real. (More on diagnosing stalled deals.)
5. Sloppy CRM hygiene. This one's quieter but just as deadly. Teams that never define clear sales stages, skip CRM integrations with their outreach tools, or fail to track stage-change timestamps end up with pipeline data that's useless for forecasting. If your Pipedrive or HubSpot instance doesn't enforce required fields at each stage, your coverage ratios are built on incomplete data. Fix the system before you blame the reps.
Stage conversion benchmarks only matter when reps can actually reach the contacts in their pipeline. Prospeo gives you 300M+ verified profiles, 125M+ mobile numbers with a 30% pickup rate, and 30+ filters - including buyer intent and job change signals - so every deal in your CRM has a real person behind it.
Turn pipeline math into closed revenue at $0.01 per verified email.
FAQ
What's the difference between a sales pipeline and a sales funnel?
A pipeline is a deal-level view of active opportunities organized by stage, showing where each specific deal sits in your sales process. A funnel describes aggregate conversion rates across the entire buyer journey, from lead to close. You manage individual deals in your pipeline; you optimize conversion rates in your funnel.
What's a good pipeline coverage ratio?
SMB teams typically need 2-3x coverage, mid-market needs 2.5-4x, and enterprise needs 3-5x - calculated as 1 / win rate. Raw coverage is misleading, though. Use probability-weighted coverage: a 3.4x raw number often drops to 1.8x weighted, revealing a 1.6x phantom gap.
How often should you review your pipeline?
Weekly 30-minute 1:1s between rep and manager using the Create-Advance-Close framework. Teams that review weekly achieve 87% forecast accuracy across a dataset of 247 B2B organizations. Monthly reviews are too infrequent to catch stalled deals before they become misses.
How do you calculate sales velocity?
Opportunities x Average Deal Size x Win Rate / Sales Cycle Length. Example: 100 opportunities x $10K x 20% / 50 days = $4,000/day. Always segment by deal type - blending SMB and enterprise numbers produces a useless average that masks real problems.
What tools help build a reliable pipeline?
CRMs like Salesforce and HubSpot manage deal stages, while Clari and Gong add forecasting intelligence. For the data layer, Prospeo provides 300M+ profiles with 98% email accuracy on a 7-day refresh - critical because stale contact data silently inflates every coverage metric you track.