Sales Funnel: Definition, Stages, Metrics, and Benchmarks (2026)
Your "verified" contact list just bounced 23% on the first outbound sequence. Half your MQLs stalled somewhere between "interested" and "ghosted." If you've ever felt like leads get stuck, fall through cracks, or vanish, you're not alone - and most teams can't pinpoint where. The sales funnel isn't broken. It's leaking, and you're measuring the wrong things. Here's how to fix that with actual numbers, formulas, and a build-and-optimize playbook that works in 2026.
What You Need Fast
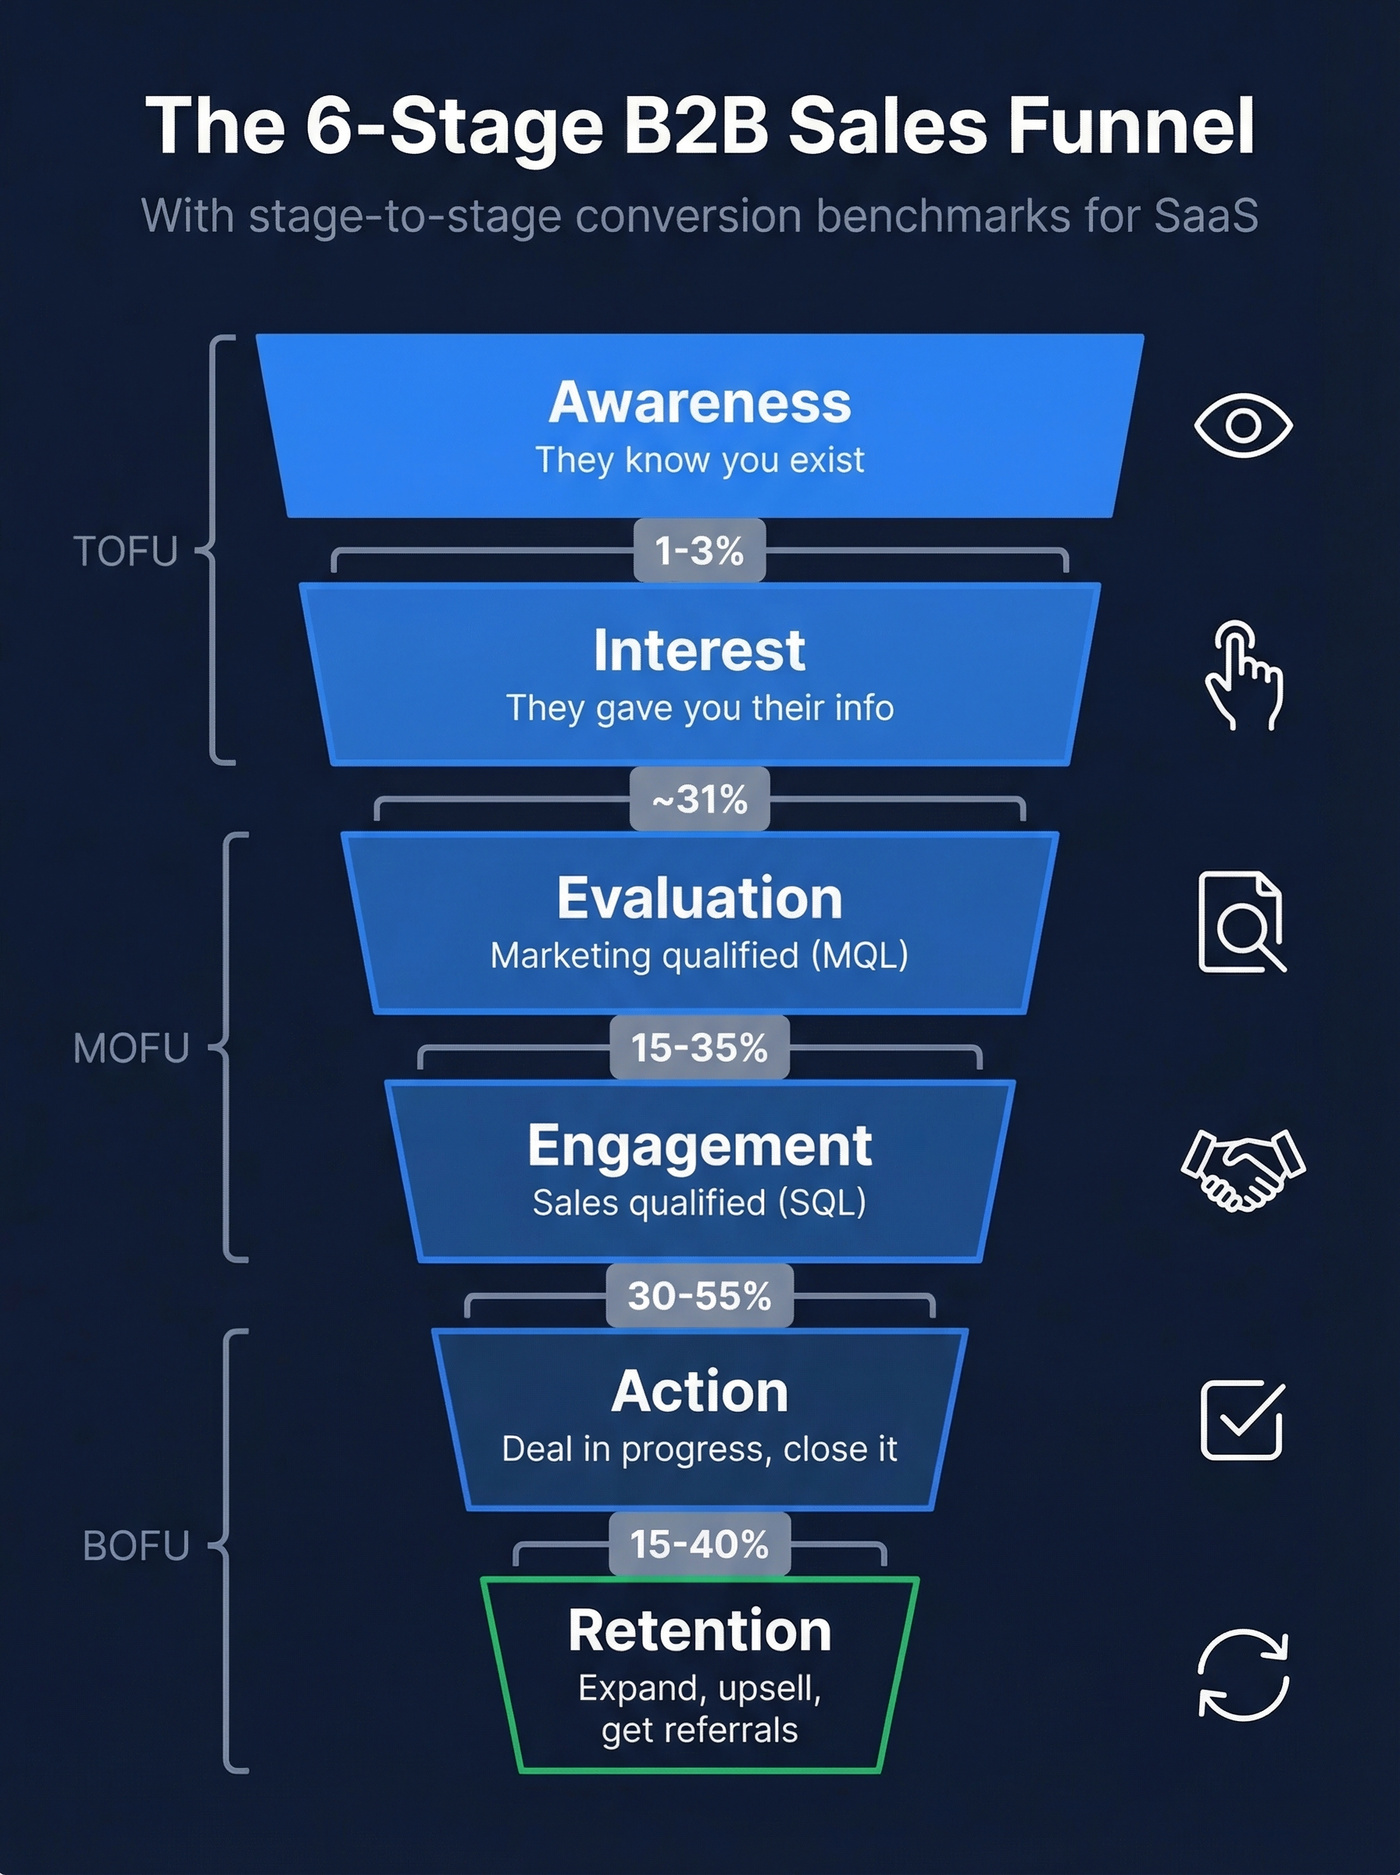
Funnel stages that matter: Awareness → Interest → Evaluation → Engagement → Action → Retention. Six stages. Don't overcomplicate it.
Benchmark ranges to memorize:
- Visitor → Lead: 1-3%
- Lead → MQL: ~31%
- MQL → SQL: 15-35%
- SQL → Opportunity: 30-55%
- Opportunity → Close (SaaS): 15-40%
- Qualified → Meeting: 62% median (78%+ for top 10%, 88% for the best)
The two fastest fixes:
- Speed-to-lead. Contact inbound leads within 5 minutes. Leads contacted that fast are 9x more likely to convert than those reached after 30 minutes.
- Data quality. If your email bounce rate is above 5%, you're leaking pipeline before any copy, offer, or cadence gets a chance to work. Fix data before messaging.
What to measure weekly: Stage conversion rates, drop-off rate by stage, sales velocity, and pipeline coverage (target 3-5x quota). For a deeper KPI list, track funnel metrics alongside pipeline health.

What Is a Sales Funnel?
A sales funnel is the journey a buyer takes from first hearing about you to signing a contract - visualized as a narrowing funnel because fewer people make it through each stage. Think of it like a filtration system: you pour a large volume of prospects in at the top, and a smaller number of qualified, ready-to-buy customers emerge at the bottom. That's the core definition.
The funnel matters because it gives you a shared language for diagnosing problems. "We're not generating enough pipeline" is vague. "Our MQL-to-SQL conversion is 12%, half the industry median" is actionable. Without stage definitions, you can't measure. Without measurement, you can't optimize.
Here's something that trips people up constantly: benchmark articles disagree with each other because they measure different stages. One source says "conversion rate is 2.9%," another says "62%." Both are correct - the first is measuring visitor-to-lead at the top of funnel, the second is measuring qualified-to-meeting at mid-funnel. The stage you're measuring changes the number dramatically, so keep that in mind every time you compare your metrics to an industry benchmark.
The funnel isn't a perfect model - buyers don't move linearly, especially in B2B where committees and internal champions complicate things. But it's the best diagnostic framework we have for identifying where deals stall and where money leaks.
Stages That Actually Work
There are dozens of funnel models floating around. We'll use a six-stage framework that balances simplicity with operational usefulness, then compare it to four alternatives so you can pick the one that fits your GTM motion. If you want a ready-to-use structure, start from a B2B sales funnel template and customize the entry/exit criteria.
Awareness (TOFU)
The prospect knows you exist. They've seen an ad, read a blog post, clicked a search result, or heard your name on a podcast. At this stage, you're not selling - you're earning attention. The entry criterion is any first-touch interaction. The exit criterion is an identifiable action: they visit a pricing page, download a resource, or submit a form.
In B2B, awareness is harder than it sounds. You're not selling sneakers to impulse buyers. B2B purchases typically involve 6-10 decision-makers, which means awareness needs to reach multiple people inside the same account - not just one champion.
Interest (Lead Capture)
The prospect has done something that signals intent beyond casual browsing. They've filled out a form, signed up for a webinar, or responded to an outbound email. They're now a lead in your system.
The key metric here is visitor-to-lead conversion, which runs 1-3% for most B2B companies and averages 1.5-2.5% specifically for SaaS. This is where data quality starts mattering. If the email they gave you bounces, or the email you found for them is invalid, the lead is dead on arrival. (If you’re diagnosing deliverability, start with email bounce rate benchmarks and causes.)
Evaluation (MQL Logic)
Marketing has scored or qualified this lead based on fit and engagement signals. They match your ICP, they've consumed multiple pieces of content, or they've hit a lead-scoring threshold. The conversion from Lead to MQL runs about 31% on average, though it varies wildly by industry - higher education hits 45%, while eCommerce sits at 23%. If you’re formalizing this, use a documented lead scoring model so sales and marketing aren’t guessing.
The trap here is setting MQL criteria too loosely. If marketing passes everything to sales, reps waste time on unqualified leads and trust erodes between teams.
Engagement (SQL + Meetings)
Sales has accepted the lead and confirmed buying intent through a conversation. This is the MQL-to-SQL handoff - one of the most friction-prone transitions in the entire funnel. Average MQL-to-SQL conversion runs 15-35%, and the gap between top performers and laggards is enormous.
Speed matters here more than anywhere else. The 5-minute rule isn't a suggestion - it's a multiplier.
Action (Opportunity + Close)
The prospect is in an active deal cycle. They've seen a demo, received a proposal, or entered negotiation. SQL-to-Opportunity conversion runs 30-55%, and Opportunity-to-Close for SaaS lands between 15-40% depending on deal size and sales cycle length.
Enterprise deals with 120-day cycles naturally close at lower rates than SMB deals that close in 30-45 days. Don't benchmark a $200K enterprise deal against a $5K self-serve conversion - they're different animals entirely. If you sell upmarket, align your expectations to enterprise B2B sales cycle realities.
Retention (Expansion/Referrals)
The deal is closed, but the funnel doesn't end. Retention, upsell, and referral are where compounding revenue lives. This stage is often ignored in funnel analysis because it sits in Customer Success territory, but the best revenue teams measure net revenue retention and expansion pipeline alongside new-business metrics. If you’re building the post-sale view, pair retention with renewal rate tracking.
Five Funnel Models Compared
| Model | Stages | Best For | Post-Sale? |
|---|---|---|---|
| AIDA | 4 (Attention, Interest, Desire, Action) | Simple B2C | No |
| 3-Stage | 3 (Awareness, Consideration, Decision) | Quick frameworks | No |
| 6-Stage | 6, Awareness through Retention | B2B SaaS ops | Yes |
| RingDNA 7-Stage | 7, adds Reevaluation + Repurchase | Lifecycle tracking | Yes |
| Inbound 4-Stage | 4, customer-centric | Inbound-heavy orgs | Yes |
The 6-stage model works for most B2B teams because it includes post-sale without overcomplicating the middle. If you're running a PLG motion, the Inbound 4-Stage model maps better to self-serve journeys. If you prefer the classic model, see the AIDA sales funnel breakdown.
Funnel vs Pipeline vs Marketing Funnel
These three terms get used interchangeably, and it causes real confusion in cross-functional meetings. They're related but distinct.
| Dimension | Sales Funnel | Sales Pipeline | Marketing Funnel |
|---|---|---|---|
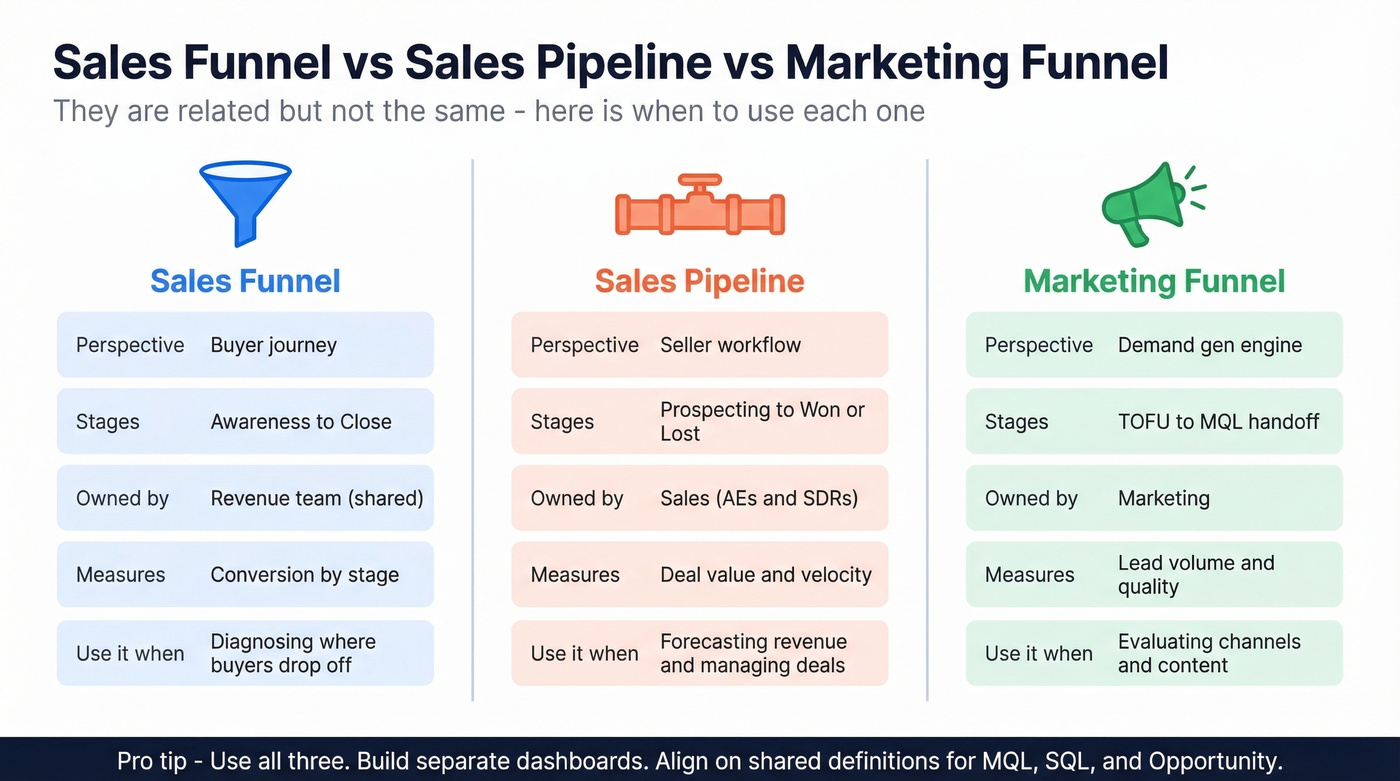
| Perspective | Buyer's journey | Seller's workflow | Demand gen engine |
| Stages | Awareness → Close | Prospecting → Won/Lost | TOFU → MQL handoff |
| Owned by | Revenue team (shared) | Sales (AEs/SDRs) | Marketing |
| Measures | Conversion by stage | Deal value + velocity | Lead volume + quality |
Use the funnel when you're diagnosing where buyers drop off and why conversion rates are low. It's a diagnostic tool.
Use the pipeline when you're forecasting revenue, managing deal flow, and holding reps accountable to specific opportunities. It's an operational tool (and it’s easier with clear sales pipeline benchmarks).
Use the marketing funnel when you're evaluating demand gen channels, content performance, and MQL volume. It's a channel-attribution tool.
The mistake most teams make is trying to use one model for all three purposes. Your CRO needs the funnel view. Your VP of Sales needs the pipeline view. Your CMO needs the marketing funnel view. Build dashboards for each, and align them on shared definitions for MQL, SQL, and Opportunity.
Skip the debate about which model is "right." Use all three, and make sure the handoff points between them are clearly defined with SLAs.
Sales Funnel Benchmarks
This is the section you'll bookmark. Most funnel guides stop at conversion rates. Below, we also cover cycle times, CAC by deal size, PLG benchmarks, and channel-level performance - the full picture you need for forecasting.
Benchmarks at a Glance
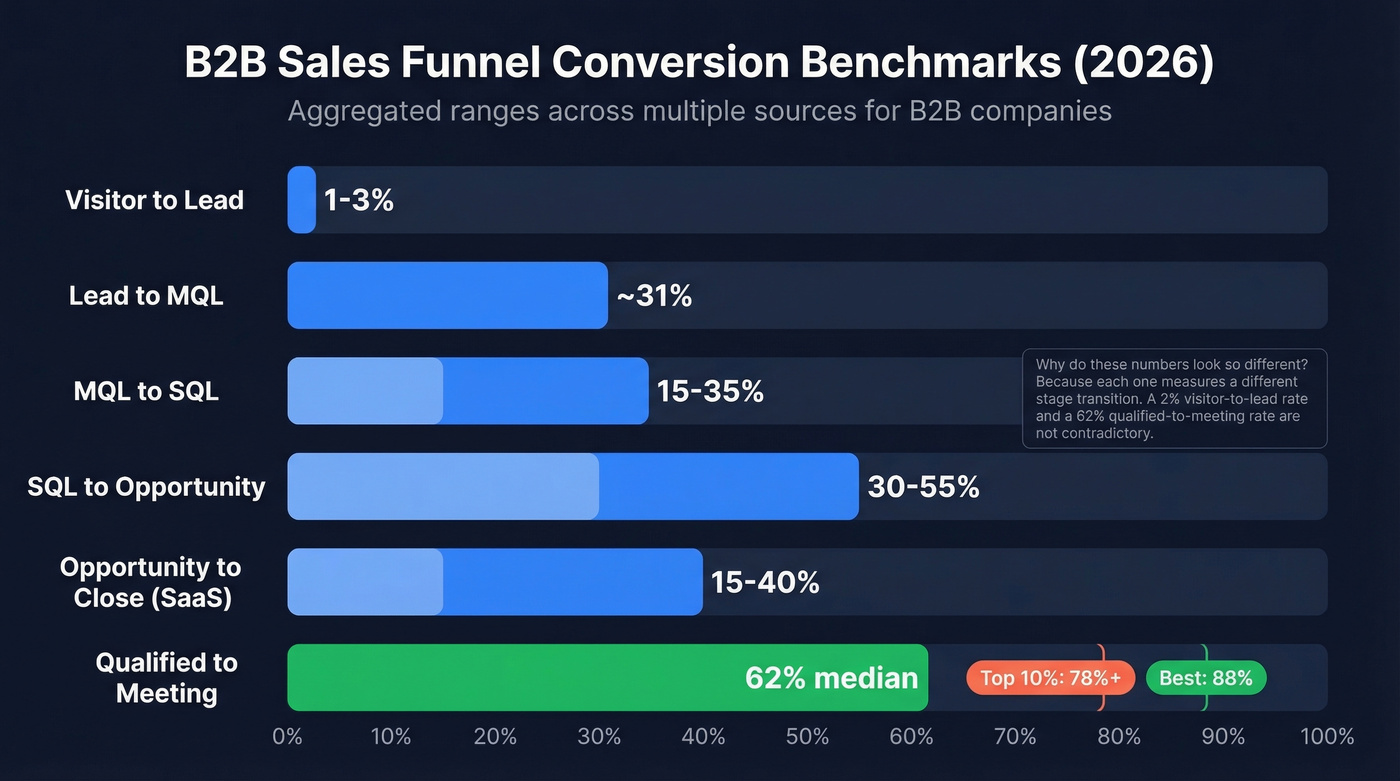
These are aggregated ranges across multiple sources, representing the middle of the distribution for B2B companies:
| Stage | Benchmark Range |
|---|---|
| Visitor → Lead | 1-3% |
| Lead → MQL | ~31% |
| MQL → SQL | 15-35% |
| SQL → Opportunity | 30-55% |
| Opp → Close (SaaS) | 15-40% |
| Qualified → Meeting | 62% median, 78%+ top 10%, 88% best |
These numbers look wildly different from each other because they measure different transitions. A 2% visitor-to-lead rate and a 62% qualified-to-meeting rate aren't contradictory - they're measuring different stages of the same journey.
Benchmarks by Industry
FirstPageSage's benchmark report breaks down stage-to-stage conversion by industry, collected across a mix of roughly 65% B2B, 20% B2C, and 15% hybrid companies:
| Industry | Lead → MQL | MQL → SQL | SQL → Opp | SQL → Close |
|---|---|---|---|---|
| B2B SaaS | 39% | 38% | 42% | 37% |
| Cybersecurity | 24% | 40% | 43% | 46% |
| eCommerce | 23% | 58% | 66% | 60% |
| Higher Education | 45% | 46% | 61% | 66% |
A few things jump out. Cybersecurity has the lowest Lead-to-MQL rate at 24% but the highest SQL-to-Close rate at 46%. That's a classic pattern for high-trust, high-stakes purchases - hard to qualify, but once qualified, deals close. eCommerce shows the opposite: easy to generate MQLs, but the close rate reflects shorter sales cycles and lower deal values.
Benchmarks by Company Maturity
Where you are in your growth trajectory changes the math dramatically. Early-stage companies running lean teams with unrefined ICPs see MQL-to-Close rates of just 1-2%. Enterprise organizations with mature sales processes, dedicated SDR teams, and established brand recognition push that to 4-7%.
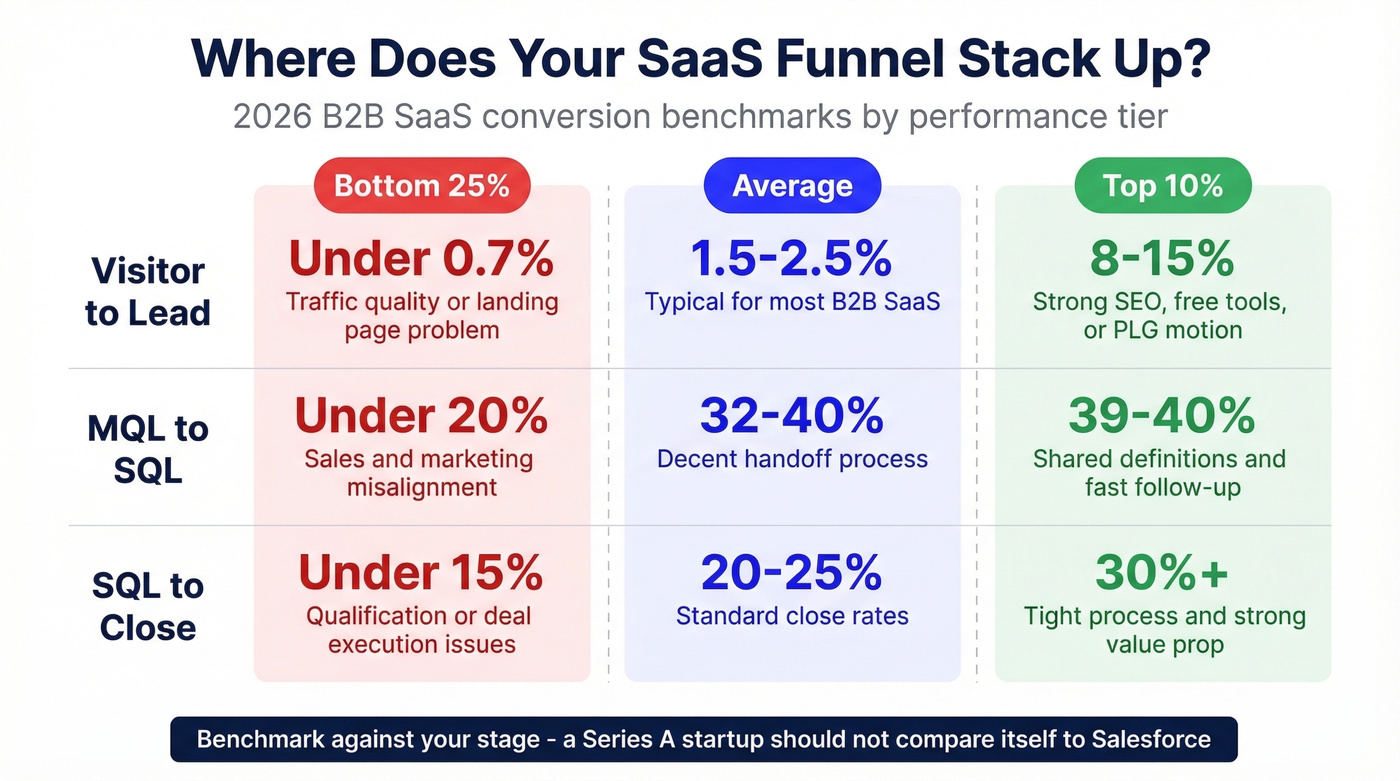
If you're a Series A startup comparing yourself to Salesforce's conversion rates, you'll feel terrible for no reason. Benchmark against your stage.
Are You Top 10%?
SaaS Hero's 2026 benchmarks break B2B SaaS into performance tiers, which is more useful than a single average:
| Stage | Bottom 25% | Average | Top 10% |
|---|---|---|---|
| Visitor → Lead | <0.7% | 1.5-2.5% | 8-15% |
| MQL → SQL | <20% | 32-40% | 39-40% |
| SQL → Close | <15% | 20-25% | 30%+ |
If your visitor-to-lead rate is under 0.7%, you've got a traffic quality or landing page problem. If it's above 8%, you're in elite territory - likely driven by strong SEO, a compelling free tool, or a PLG motion that captures intent naturally.
The MQL-to-SQL gap between bottom 25% (under 20%) and top 10% (39-40%) is where sales-marketing alignment shows up most clearly. Teams with shared definitions, fast handoffs, and clean data consistently outperform.
Which Channels Convert Best?
Not all top-of-funnel channels are created equal:
| Channel | Visitor → Lead | MQL → SQL | Opp → Close |
|---|---|---|---|
| SEO | 2.1% | 51% | 36% |
| PPC / Google Ads | 3-5% | 26% | 35% |
| 1.8-3.2% | - | - | |
| Webinar | 0.9% | - | 40% |
| Outbound* | - | - | - |
*Outbound is measured as initial-contact → meeting, typically 2-5%, not visitor-to-lead.
SEO drives the highest full-funnel performance with a 2.1% visitor-to-lead rate that maintains strong conversion through the middle. Google Ads beats SEO on initial capture at 3-5%, but the quality drops off - paid traffic is interruptive and often catches people earlier in their research cycle. Webinars have a low top-of-funnel rate at 0.9% but the highest close rate at 40%, because they attract people further along in their buying journey.
How Long Should Each Stage Take?
Conversion rates tell you how many people move forward. Cycle times tell you how fast. Both matter for forecasting.
- Visitor → Lead: 1-3 days for content-driven funnels
- MQL → SQL: 8-15 days
- Opportunity → Close: ~120 days for enterprise deals, ~30-45 days for SMB
If your enterprise deals are closing in 60 days, either you've found an incredible niche or your definition of "enterprise" is generous. If SMB deals are taking 90+ days, something is broken in your evaluation or proposal stage.
PLG Funnel Benchmarks
Product-led growth funnels have their own conversion math:
- Freemium → Paid: 3.4%
- Free Trial → Paid: 18-29% depending on category
- CRM Trial → Paid: 29%
The gap between freemium at 3.4% and free trial at 18-29% is massive. Freemium casts a wider net but converts a tiny fraction. Trials pre-qualify by requiring more commitment upfront. If you're running a PLG motion, know which model you're using and benchmark accordingly.
What It Costs to Fill the Funnel
Conversion rates mean nothing without cost context:
| ACV Band | Typical CAC |
|---|---|
| SMB ($5K-$25K) | $1K-$4K |
| Mid-Market ($25K-$100K) | $4K-$15K |
| Enterprise ($100K-$500K) | $15K-$50K |
| Enterprise+ ($500K+) | $50K-$150K |
A $3K CAC on a $10K ACV deal gives you a 3.3x LTV/CAC ratio if retention is decent - that's healthy. The same $3K CAC on a $5K ACV deal with 18-month average lifetime? That's underwater. Always pair conversion benchmarks with CAC and LTV to get the full picture (and if you need the math, see cost to acquire customer).
Here's the thing: if your average deal is under $15K, you probably don't need ZoomInfo-level data infrastructure. A verified contact database, a solid sequencer, and disciplined follow-up will outperform a $40K/year tech stack that your team uses at 30% capacity.
You just read that bounce rates above 5% kill your funnel before any cadence gets a chance. Prospeo's 5-step email verification delivers 98% accuracy - teams using it cut bounce rates from 35% to under 4% and tripled pipeline output.
Stop leaking pipeline at the top. Start with data that actually connects.
How to Measure Your Funnel
Benchmarks are useless if you can't measure your own funnel accurately. Here are the formulas that matter, a worked example, and the metrics to track weekly.
Stage Conversion Rate
The core formula, applied to any stage transition:
Conversion Rate = (Leads entering next stage / Leads at current stage) x 100
If you generated 200 MQLs last month and 60 became SQLs, your MQL-to-SQL rate is 30%.
Drop-Off Rate
The inverse of conversion - tells you where the funnel is leaking:
Drop-off Rate = (Leads leaving stage / Total leads at stage) x 100
If 200 leads entered your evaluation stage and 140 dropped off without becoming SQLs, your drop-off rate is 70%. That's where you focus optimization.
Sales Velocity
This is the single most important compound metric for revenue forecasting:
Sales Velocity = (Opportunities x Win Rate x Avg Deal Size) / Sales Cycle Length
Worked example: 50 opportunities x 25% win rate x $30K average deal / 90-day cycle = $4,167/day in pipeline velocity. If you need $1.5M this quarter, you need that velocity running at ~$16,667/day - which means you need either more opportunities, a higher win rate, larger deals, or a shorter cycle.
Pipeline Coverage
Pipeline Coverage = Pipeline $ / Quota
Target 3-5x in B2B. If your quarterly quota is $500K, you need $1.5M-$2.5M in pipeline to hit it reliably. Below 3x, you're relying on every deal to close. Above 5x, you likely have a qualification problem - too many low-quality opportunities inflating the number.
The Alignment Multiplier
Here's a stat worth internalizing: aligned sales and marketing teams experience 67% higher conversion rates and generate 208% more revenue from marketing efforts. Alignment isn't a soft skill - it's a measurable revenue lever. Shared stage definitions, agreed-upon SLAs for lead handoff timing, and a single source of truth for funnel data are the operational foundations.
Weekly Measurement Checklist
Track these every week in your funnel review:
- Stage-by-stage conversion rates - are any trending down?
- Drop-off rate by stage - where's the biggest leak?
- Average time in each stage - are deals stalling?
- Pipeline coverage ratio - do you have enough to hit quota?
- Sales velocity - is it trending up or down?
- Bounce rate on outbound - is data quality degrading?
Build Your Sales Funnel in 6 Steps
Theory is great. Let's build the thing.
Step 1: Pick ICP and Disqualify Hard
Your funnel is only as good as what you pour into it. Define your ideal customer profile with specificity: industry, company size, tech stack, buying triggers, and - critically - disqualification criteria. "Your prospecting list is your strategy," as Ryan Reisert puts it. Stick to it. If you need a starting point, use an ideal customer profile template.
The most common mistake we see is teams casting too wide a net because they're afraid of missing opportunities. The result is a bloated top of funnel that wastes SDR time and produces misleading conversion metrics. Better to start narrow and expand than to start broad and drown.
Step 2: Define Stages + Entry/Exit Criteria
Map your six stages and define exactly what moves a prospect from one to the next. Entry criteria answer "what qualifies someone to be here?" Exit criteria answer "what has to happen before they move forward?"
Example for MQL → SQL: Entry = lead score above 50 + matches ICP firmographics. Exit = SDR has confirmed budget, authority, need, and timeline via a live conversation. Without these definitions, your funnel metrics are meaningless because everyone's counting differently.
Step 3: Choose Your Tracking System
If you have a CRM, use it. Salesforce, HubSpot, or even a lightweight option like Close all let you define deal stages and track the fields that matter: deal stage, win probability, expected close date, deal size, assigned rep, and next steps. If you’re still evaluating options, start with a few examples of a CRM to match your funnel complexity.
For teams that want a spreadsheet-based approach before committing to a CRM, the Salesflare template is worth a look - it includes columns for all the fields above, and its Insights tab auto-updates with revenue forecasts and conversion rates as you fill in deal data. For early-stage teams, a Google Sheets version with the same columns works fine. The tool matters less than the discipline of updating it every day.
Step 4: Create Stage Assets
Each stage needs content that matches the buyer's mindset. Awareness needs educational content. Interest needs value demonstrations. Evaluation needs comparison guides and case studies. Engagement needs proposals and ROI calculators. Action needs contracts and implementation plans.
Map your existing content to stages and identify gaps. Most teams have too much awareness content and not enough evaluation-stage material - the stuff that actually helps a committee make a decision.
Step 5: Automate Handoffs + SLAs
The marketing-to-sales handoff is where most funnels break. Set explicit SLAs: marketing delivers X MQLs per month meeting defined criteria, and sales follows up within Y hours. If either side misses, there's a documented escalation path.
Automate what you can: lead routing, task creation on stage change, notification when a deal stalls past its expected timeline. Every manual step is a potential leak.
Step 6: Weekly Funnel Review Cadence
Block 30 minutes every Monday. Review the metrics from the checklist above. Identify the biggest leak. Assign one person to fix it that week. Repeat. The teams that review weekly outperform the teams that review monthly - not because they're smarter, but because they catch problems 4x faster.
Optimize for Highest ROI
You've built the funnel. Now let's make it convert better. These are prioritized by impact - do the first one before anything else.
Fix Data Quality First
If your email bounce rate is above 5%, nothing else you optimize matters. Not your subject lines, not your offer, not your cadence timing. Bad data means your emails don't reach inboxes, your domain reputation degrades, and every subsequent campaign performs worse. If you want the full remediation checklist, follow an email deliverability guide before you scale volume.
We've seen this pattern repeatedly. A team invests in better copy, better targeting, better sequences - and conversion barely moves. Then they fix their data, bounce rate drops, and pipeline jumps. Meritt went from a 35% bounce rate to under 4% after switching to verified email data. Their pipeline tripled from $100K to $300K per week. That's not a copywriting win - that's a data quality win.
Speed-to-Lead
Contact inbound leads within 5 minutes. Not 5 hours. Not "next business day." Five minutes. Leads contacted within that window are 9x more likely to convert than those reached after 30 minutes. This is the single highest-leverage operational change most teams can make, and it costs nothing except discipline and routing automation.
Tighten MQL Criteria
If your MQL-to-SQL rate is below 20%, your MQL definition is too loose. Raise the scoring threshold, add firmographic filters, or require a specific engagement action like attending a webinar or requesting a demo before passing to sales. A smaller number of higher-quality MQLs will produce more pipeline than a flood of unqualified names.
Reduce Stage Dwell Time
Look at your cycle-time benchmarks. If MQL-to-SQL is taking 25 days when the benchmark is 8-15, you've got a follow-up problem. If Opportunity-to-Close is running 180 days on deals that should close in 90, you've got a deal-management problem. Identify the slowest stage and work backward to find the bottleneck.
Align Sales and Marketing
Let's be honest - I've watched teams operate for months with marketing counting "MQLs" that sales doesn't consider qualified. Get in a room. Agree on definitions. Write them down. Review them quarterly. The 67% conversion lift from alignment isn't magic. It's the result of eliminating the waste that comes from misaligned handoffs.
Speed-to-lead and data quality are the two fastest funnel fixes - and both depend on having real contact data ready. Prospeo refreshes 300M+ profiles every 7 days, so your MQL-to-SQL handoff hits live inboxes and real direct dials, not dead ends.
Every funnel stage converts higher when the data underneath it is accurate.
Mistakes That Kill Conversion
These seven mistakes show up in funnels of every size. Most are obvious in hindsight and invisible in the moment.
1. Not defining your target audience. "Everyone who might buy" isn't a target. Without a tight ICP, your funnel fills with people who were never going to convert, and your metrics lie to you about what's working.
2. Creating content nobody asked for. Content that answers the buyer's actual questions at each stage converts. Content your marketing team thought was clever doesn't. If your awareness-stage blog posts get traffic but zero conversions, the content isn't aligned with buyer intent.
3. No incentive to move forward. Every stage transition needs a reason - a free trial, a benchmark report, a personalized demo, a limited-time offer. Without incentives, prospects stall because inertia is the default.
4. Making it hard to convert. Checkout friction, 15-field forms, "schedule a call to get pricing" when the buyer just wants a number. Every unnecessary step is a leak.
5. Not tracking results. If you can't tell me your MQL-to-SQL rate right now, you're flying blind. Measurement isn't optional - it's the entire point of having a funnel framework.
6. Not split testing. Your first version of anything - landing page, email sequence, demo script - is almost certainly not the best version. Test systematically. Change one variable at a time. Let statistical significance tell you what works.
7. Not following up with leads. The average B2B deal requires multiple touches. One email and done isn't a follow-up strategy - it's a hope strategy. Build sequences with 5-8 touches across multiple channels, and automate the cadence so reps don't have to remember. If you need copy you can deploy fast, use these sales follow up templates.
The common thread across all seven: they're process failures, not talent failures. A mediocre rep with a well-built funnel will outperform a great rep with a broken one.
Funnel vs Flywheel
The "is the funnel dead?" debate has been running for years. Short answer: no, but it's incomplete.
The funnel model is linear. Prospect enters at the top, moves through stages, exits as a customer. That's useful for measurement and diagnosis. But modern B2B buyers don't move linearly. Gartner's research shows buyers complete ~70% of their research before talking to sales. They loop back, consult peers, read reviews, attend webinars, and re-enter at different stages.
The flywheel fixes this by making the customer journey circular. The GTM flywheel framework defines six stages: Traffic → Capture → Nurture → Qualification → Conversion → Retention. The key difference is that retention feeds back into traffic through referrals, case studies, and word-of-mouth - happy customers generate new prospects, creating a compounding loop.
Where the funnel wins: Measurement. It's much easier to calculate stage-by-stage conversion rates, identify leaks, and forecast revenue with a linear model. RevOps teams need the funnel for operational reporting.
Where the flywheel wins: Strategy. It forces you to invest in post-sale experience, which drives expansion revenue and reduces CAC over time. It also better reflects how buyers actually behave - looping, not marching.
Use both. Run your funnel for measurement and forecasting. Run your flywheel for strategic planning and resource allocation. The funnel tells you where deals are today. The flywheel tells you where growth compounds tomorrow.
AI and the Sales Funnel in 2026
AI isn't replacing the funnel - it's compressing it. Every stage gets faster, more personalized, and more automated. Here's what's actually working, what it costs, and where the hype outpaces reality.
What AI Does at Each Stage
Awareness: Signal-based prospecting identifies accounts showing buying intent before they ever visit your site. Job changes, funding rounds, tech adoption, and content consumption patterns all feed AI models that surface prospects earlier.
Interest/Evaluation: Conversational AI and chatbots handle initial qualification in real time, reducing speed-to-lead from minutes to seconds. The average cold email reply rate is 3.43%, but personalized outreach powered by generative AI yields 142% higher reply rates - pushing that closer to 8% for well-targeted sequences.
Engagement: Predictive lead scoring replaces manual qualification. AI analyzes behavioral signals, firmographic fit, and engagement patterns to prioritize which leads sales should call first. The catch? Data readiness and signal accuracy increasingly determine whether AI prospecting succeeds or fails. Garbage in, garbage out applies doubly when algorithms are making the decisions.
Action: Conversation intelligence tools like Gong analyze sales calls to identify winning patterns, flag risk signals, and coach reps in near-real-time. Forecasting models reduce the 20-30% error rate that comes from gut-based spreadsheet forecasts.
Retention: AI-driven health scoring identifies at-risk accounts before they churn, enabling proactive outreach from customer success.
The impact is measurable: 83% of sales teams using AI saw revenue growth, compared to 66% without. McKinsey estimates GenAI's productivity potential across sales and marketing at $0.8T-$1.2T. On a team level, reps spend roughly 24 hours per week on admin work - for a 50-person sales team, that's approximately $3M in salary spent on non-revenue activities that AI can partially automate.
What It Costs
| Tool | Category | Pricing |
|---|---|---|
| ZoomInfo | Data + Intent | $14,995-$40K+/yr |
| 6sense | ABM + Intent | ~$55K/yr median |
| Salesforce Einstein | Lead Scoring | $50/user/mo |
| Salesforce Agentforce | AI Agents | $125/user/mo |
| Revenue Intelligence | Forecasting | $220/user/mo |
| Outreach | Sequencing | ~$100-150/user/mo |
| Gong | Conversation Intel | ~$100-150/user/mo |
| HubSpot | CRM + Marketing | $20-$150/user/mo |
| Intercom | AI Chat | $29/mo + $0.99/resolution |
The enterprise AI stack can easily run $100K+/year when you combine data, sequencing, conversation intelligence, and forecasting tools. For teams that can't justify that spend, the highest-ROI starting point is clean data plus a sequencing tool. Get the foundation right before layering on AI.
Most teams don't need 6sense and Gong and Revenue Intelligence on day one. Start with verified data and a solid CRM. Add AI tools as your funnel matures and you can actually measure their incremental impact. The consensus on r/sales tends to agree - the teams posting about their AI stack wins are usually the ones that already had clean data and a working process before they added the tools.
FAQ
What are the stages of a sales funnel?
The most practical B2B model uses six stages: Awareness, Interest, Evaluation, Engagement, Action, and Retention. Simpler models like AIDA use four. Pick the one that matches your sales motion - stage count matters less than having clear entry and exit criteria for each transition.
What's a good conversion rate in 2026?
Visitor-to-lead runs 1-3%, MQL-to-SQL runs 15-35%, and Opportunity-to-Close for SaaS runs 15-40%. Top 10% B2B SaaS companies hit 8-15% on visitor-to-lead. Always specify the stage when comparing - a single number without context is meaningless.
What's the difference between a sales funnel and a pipeline?
The funnel maps the buyer's journey and measures conversion between stages. The pipeline maps the seller's workflow and tracks deal value plus velocity. Use the funnel to diagnose where buyers drop off; use the pipeline to forecast revenue and manage deal flow.
How do I reduce email bounce rate in outbound?
Verify every email before sending - a bounce rate above 5% damages domain reputation and tanks deliverability for all future campaigns. Upload your list in bulk, remove invalid addresses, and re-verify before every major send. Tools like Prospeo run a 5-step verification process with 98% accuracy and a 7-day refresh cycle to prevent list decay.
How do you calculate sales funnel conversion rates?
Divide leads entering the next stage by total leads at the current stage, then multiply by 100. Example: MQL-to-SQL rate = (SQLs / MQLs) x 100. Track drop-off rate as the inverse. Measure both weekly to catch leaks before they compound.