Target Account List Calculator: The Open-Source Formula for ABM Teams
Someone on r/b2bmarketing asked for usable benchmarks - how many SQLs should you expect from an account list of size X? The thread didn't produce a clear answer. Demandbase and 6sense both offer interactive calculators, but the formulas sit behind gated widgets and "talk to sales" walls.
Here's the thing: the math isn't complicated. We've broken it down into an open formula with benchmark defaults, a worked example, and a tiering framework. No gate, no demo request.
How the Formula Works
Six inputs, one formula.
Step 1: compute the pipeline you need from your target account list (TAL).
Pipeline Needed from TAL = Quota per Rep × Number of Reps × % Quota from TAL × Pipeline Coverage Ratio
Step 2: convert required pipeline into required closed-won deals, then into accounts.
Deals Needed = Pipeline Needed from TAL ÷ Average Deal Size ÷ Pipeline Coverage Ratio
Target Accounts = Deals Needed ÷ Opp-to-Pipeline Conversion
Or, if you prefer a single-line version that avoids double-counting win rate:
Target Accounts = (Quota per Rep × Number of Reps × % Quota from TAL)
                  ÷ (Average Deal Size × Pipeline-to-Won Conversion × Opp-to-Pipeline Conversion)
Variable definitions:
- Annual quota per rep ($) - the revenue number each rep carries
- Average deal size ($) - your median closed-won ACV (see ACV vs TCV if you mix contract types)
- Number of reps (#) - headcount assigned to the TAL motion
- % quota from TAL - how much of quota you expect ABM to source rather than inbound or partners (tie this to your ABM goals)
- Opp-to-pipeline conversion (%) - share of target accounts that become real pipeline
- Pipeline-to-won conversion (%) - win rate from qualified pipeline to closed deal (sanity-check against sales win rate by industry)
- Pipeline coverage ratio (x) - pipeline value divided by target value
If you sell into multiple segments, run this separately for each and sum the results. A blended number across enterprise and SMB will mislead you every time.
Benchmark Defaults by Segment
Don't have clean CRM data for every variable? Start with pipeline coverage benchmarks by segment, then override with your actuals as soon as you can:
| Segment | Pipeline Coverage (typical) |
|---|---|
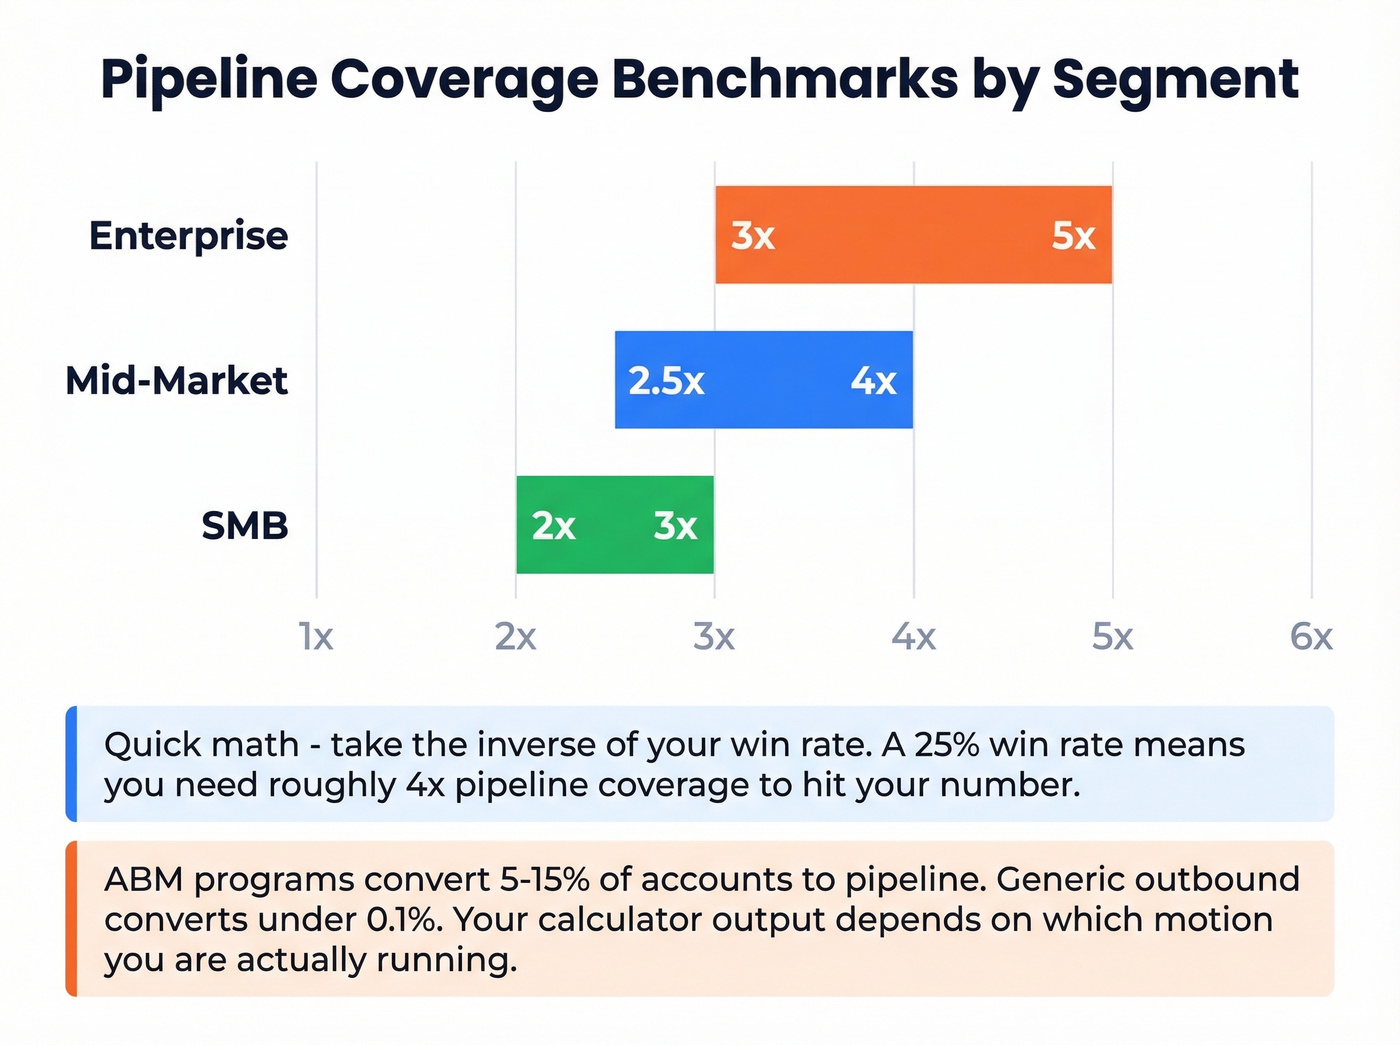
| Enterprise | 3-5x |
| Mid-Market | 2.5-4x |
| SMB | 2-3x |
These ranges align with Outreach's pipeline coverage benchmarks - and the math is straightforward. A 25% win rate implies roughly 4x coverage to hit target.
One more reality check: generic outbound converts accounts to pipeline at under 0.1%. Well-executed ABM programs hit 5-15%. Your calculator output should reflect which motion you're actually running, because the gap between those two numbers is enormous (and it’s why outbound ABM needs different assumptions than inbound-led motions).
Worked Example: Mid-Market Team
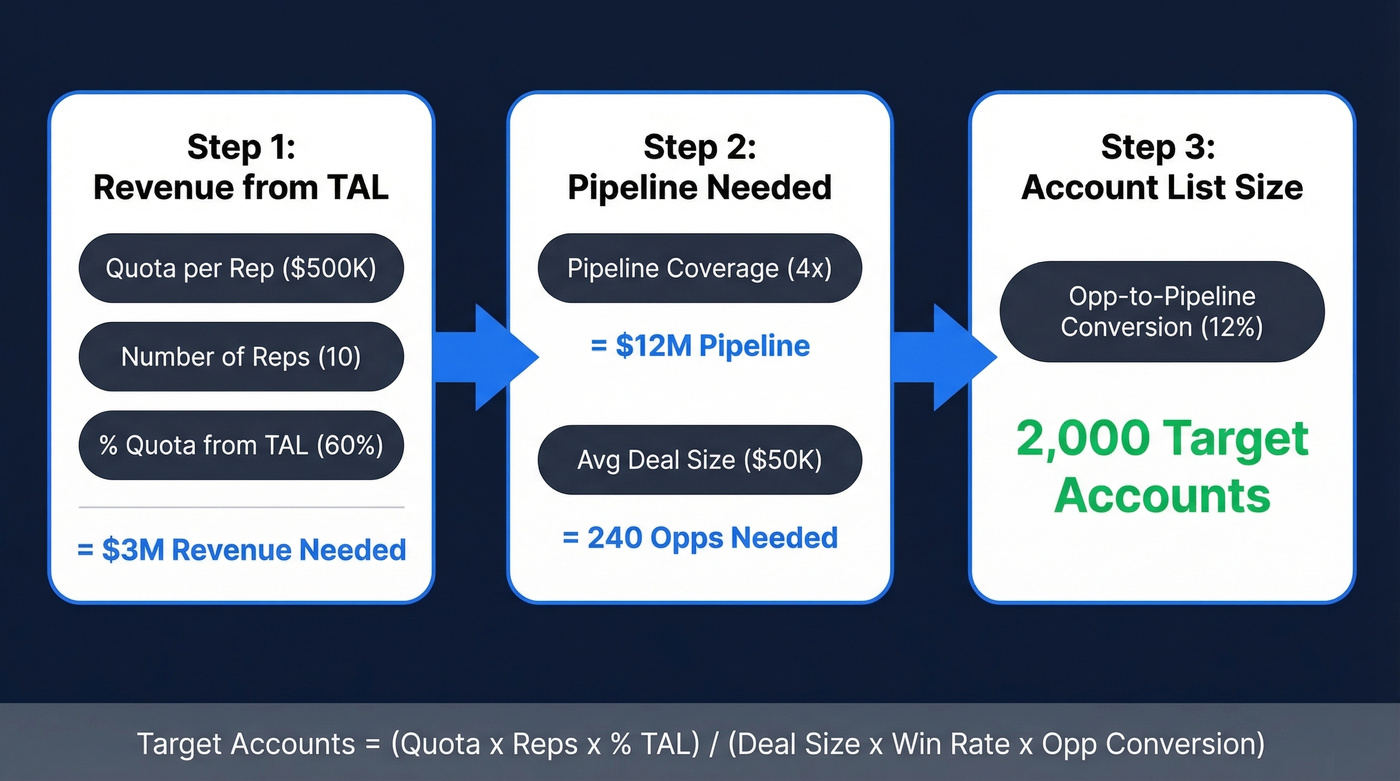
Let's walk through this with a real scenario. Ten-rep mid-market team, $500K quota each, $50K average deal size, 60% of quota sourced from the TAL motion.
Revenue needed from TAL: $500K x 10 x 60% = $3M
With a 25% win rate, you need roughly 4x pipeline coverage to land $3M: $3M x 4 = $12M pipeline
Treating pipeline as unweighted and assuming your average opportunity value is close to your average deal size: $12M / $50K = 240 opportunities
With a 12% opp-to-pipeline conversion: 240 / 0.12 = 2,000 accounts in your initial universe.
Now prune. Your Ideal Customer Profile filters might surface around 6,000 companies matching firmographics, but capacity analysis - rep bandwidth, content resources, ad budget - cuts that to roughly 1,500. That's your total addressable market for ABM. The gap between 2,000 and 1,500 tells you something important: either tighten your win rate assumptions, increase deal size, or change the motion entirely, because the current conversion math doesn't fit your resourcing reality (this is where a tighter ABM audience definition usually fixes the model).
Your calculator output is only as good as the contact data behind it. A 2,000-account TAL means 6,000+ contacts that need to be accurate on day one. Prospeo's 300M+ profiles refresh every 7 days with 98% email accuracy - so your ABM plays don't quietly fail on stale data.
Stop calculating pipeline you'll never reach because half your emails bounce.
Tier Your Accounts After Sizing
A raw number isn't a strategy. Once you've got your TAL size, tier it:
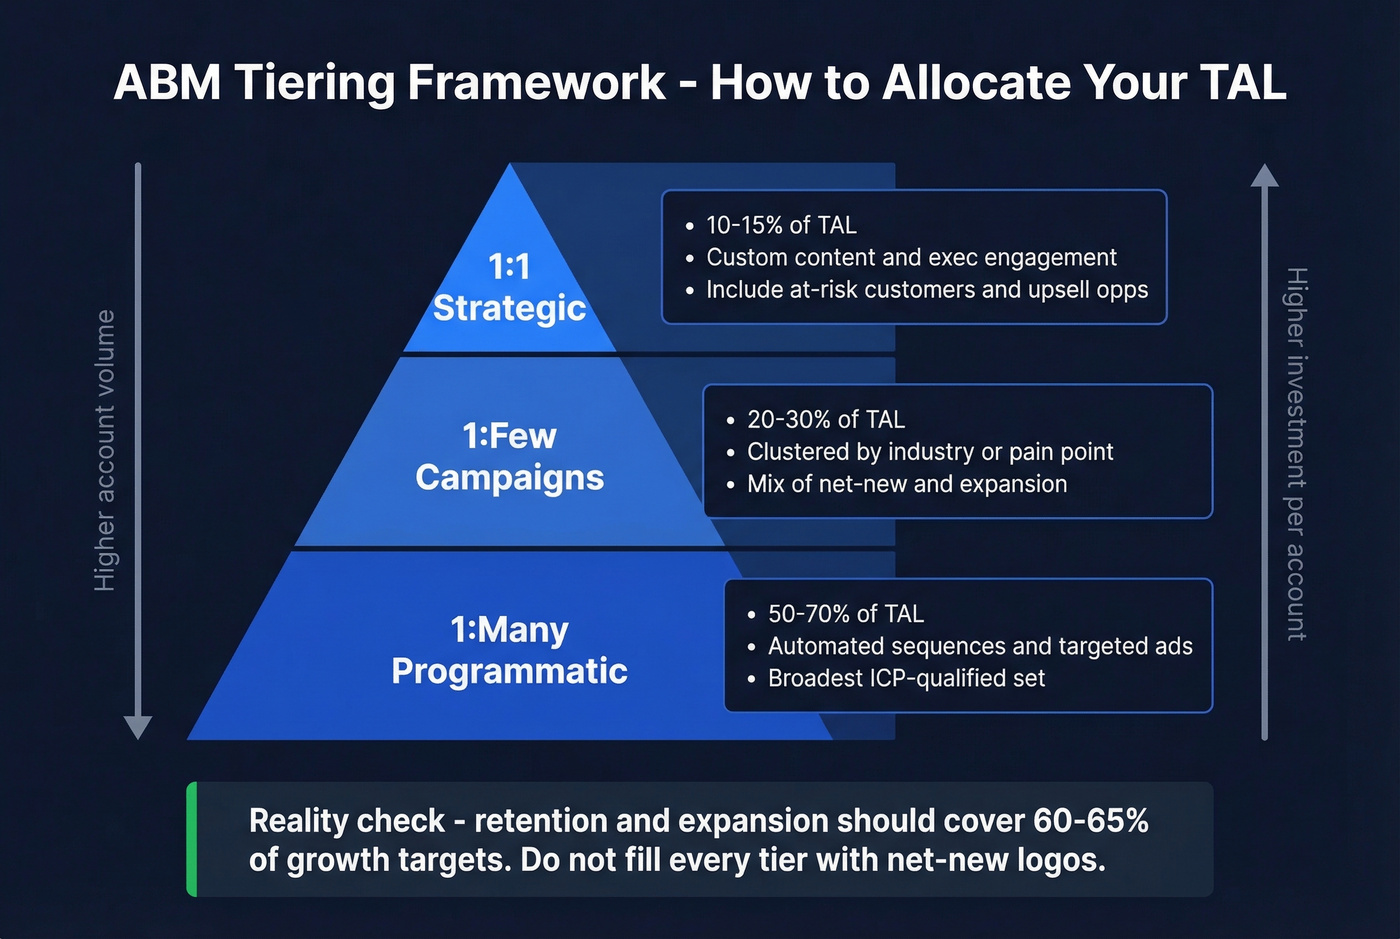
- Tier 1 (10-15% of TAL): Highest-value accounts getting 1:1 treatment - dedicated plays, custom content, executive engagement (often mapped to one-to-one ABM).
- Tier 2 (20-30%): Strong ICP fit, 1:few campaigns clustered by industry or pain point (see one-to-few ABM).
- Tier 3 (50-70%): Broader ICP-qualified set, 1:many programmatic ABM with automated sequences and targeted ads (benchmarks and ops in ABM one-to-many).
Don't fill every tier with net-new logos and ignore your existing book. Retention and expansion should cover roughly 60-65% of growth targets, which means your Tier 1 needs at-risk customers and upsell opportunities alongside conquest accounts. ABM isn't outbound - it's a resource allocation framework. We've seen teams blow their entire budget on net-new while ignoring a $2M expansion pipeline sitting right in their CRM. Revisit your TAL quarterly as win rates and pipeline velocity shift (and document the process in your ABM framework).
Three Mistakes That Break Your TAL Math
1. Using a generic 3x multiplier across all segments. Enterprise deals with 18-month cycles need 4-5x coverage. A blanket 3x will leave you short, and you won't realize it until Q3 when the pipeline gap is already baked in.
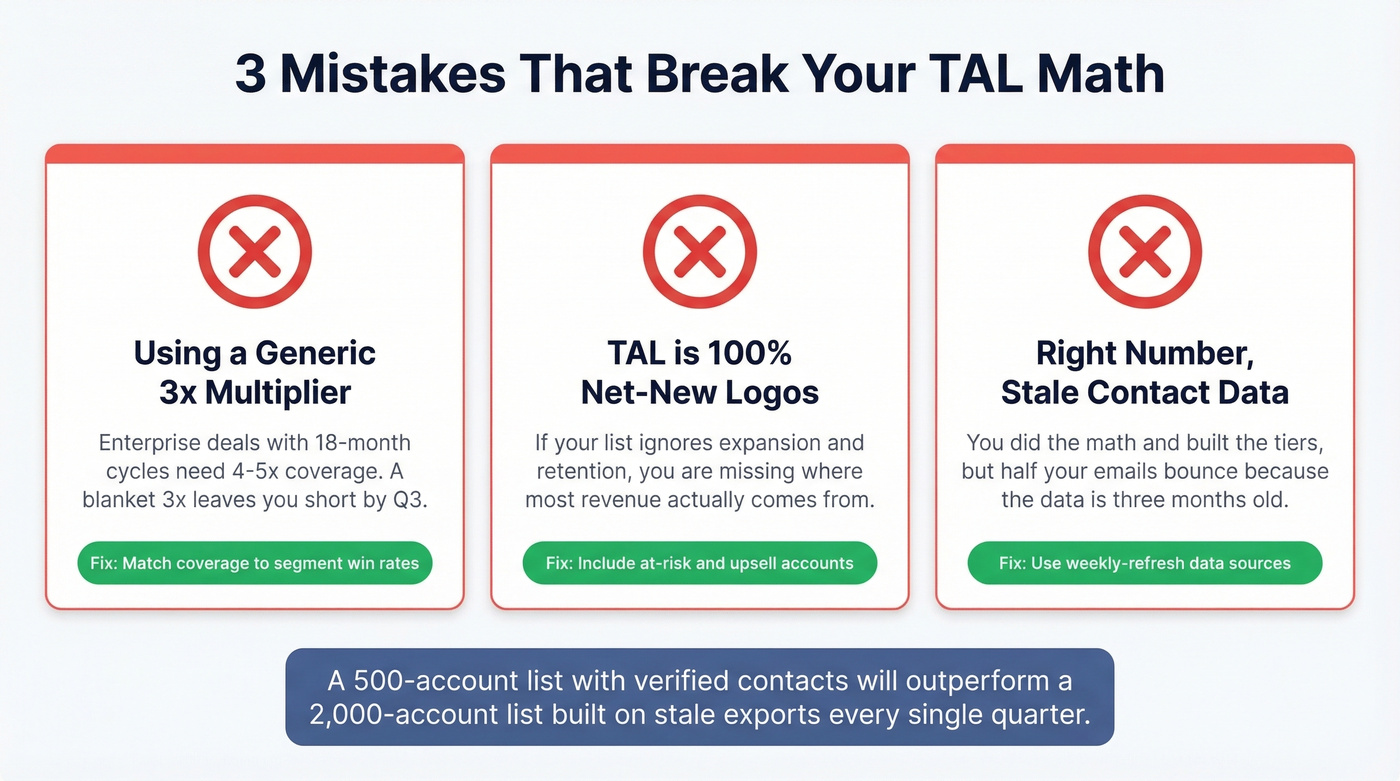
2. Treating the TAL as purely net-new. If your list doesn't include expansion and retention accounts, you're ignoring where most revenue actually comes from. This is the single most common mistake we see in ABM planning sessions.
3. Calculating the right number but sourcing stale contact data. You've done the math, built the tiers, and half your emails bounce because the data's three months old. This is where the formula meets reality - and where most programs quietly fail (a basic data enrichment process prevents this).
Look, most teams overthink the TAL number and underthink the data quality behind it. A 500-account list with verified, fresh contacts will outperform a 2,000-account list built on stale exports every single quarter.
After the Math: Source Verified Contacts
The calculator gives you a number. Now you need verified emails and direct dials for every account on that list. A 1,500-account TAL with 3-5 contacts per account means 5,000-7,500 individual contacts that need to be accurate on day one and stay accurate through your campaign.
Prospeo's database covers 300M+ professional profiles with 98% email accuracy and 125M+ verified mobile numbers. The 30+ search filters - including buyer intent across 15,000 topics, technographics, and headcount growth - match contacts to your ICP criteria directly. Data refreshes every 7 days versus the 6-week industry average, which matters when you're running multi-month ABM plays against a finite list (more on requirements in ABM data). On cost, platforms like Demandbase and 6sense typically run $30-100K+/year. Prospeo starts free and scales at roughly $0.01 per email with no annual contracts.
You've done the math - now tier and target with precision. Prospeo's 30+ filters including buyer intent across 15,000 topics, technographics, and headcount growth let you slot accounts into Tier 1, 2, and 3 with real signal, not guesswork. At $0.01 per email, it costs less than a single Demandbase widget.
Turn your TAL spreadsheet into verified contacts in minutes, not weeks.
FAQ
How many accounts should an ABM program target?
Most programs target 150-500 accounts total, while high-maturity organizations narrow to 5-25 per rep for strategic 1:1 plays. Use the formula above rather than picking a round number - your segment mix and rep capacity determine the answer, not an industry average. Skip the "best practice" listicles that tell you to start with 50 accounts; that advice ignores your quota math entirely.
What's a good pipeline coverage ratio?
Enterprise needs 3-5x, mid-market 2.5-4x, high-velocity SMB 2-3x. Take the inverse of your win rate: 25% win rate = 4x coverage. Add a 1.2x slippage buffer if your CRM shows consistent deal push - and if you're honest with yourself, it probably does.
How do I keep my target account list fresh?
Contact data decays fast. Job changes and restructuring erode list quality within weeks, not months. Use a data source with weekly refresh cycles rather than quarterly re-pulls, and audit your TAL against CRM bounce rates every sprint. In our experience, teams that check bounce rates monthly catch decay before it tanks a campaign; teams that wait for quarterly reviews don't.