How to Calculate Intent Data ROI (And Why Most Teams Can't)
You're spending $60,000 a year on an intent data platform. The dashboard shows thousands of "surging" accounts. And yet, when the CFO asks what it's actually generating, nobody in the room can answer with a number.
That's not a data problem - it's an activation and measurement problem. Proving intent data ROI requires both a clear formula and an operational framework most teams skip entirely. 84% of marketers are increasing their intent data budgets, but only 24% report exceptional ROI. The other 76% aren't seeing great returns. Let's fix both sides of that equation.
The Quick Version
The formula: Intent ROI (%) = (Revenue attributable to intent - total intent investment) / total intent investment x 100. "Total investment" means the platform fee plus ad spend, team capacity, and tooling - not just the license.
Three metrics that matter: Intent Activation Rate tracks what percentage of signals you actually act on. MQL-to-SQL lift shows whether intent-flagged accounts convert faster. Sales cycle acceleration measures whether deals close sooner (see sales cycle acceleration for a deeper breakdown).
The honest truth: 76% of teams aren't getting exceptional returns. The fix isn't buying more data. It's activation speed and data quality - getting verified contact info for the right person within 48 hours of a surge signal.
What Intent Data ROI Actually Means
Most teams measure intent data the way they measure lead gen: count the MQLs, call it a day. That misses the point.
Buyers are 60-70% through their journey before they ever talk to a vendor. Intent data's value is intercepting that journey earlier - but the signal usually arrives at the account level, not the contact level. You know Acme Corp is researching your category. You don't know who at Acme Corp is doing the research. B2B buying committees run 6-10 people deep, so measuring ROI on a per-lead basis breaks down when the signal is anonymous and the decision is collective.
The measurement shift that separates teams getting 650% returns from teams getting nothing: stop asking "how many leads did intent generate?" and start asking "how did intent-flagged accounts perform compared to accounts we pursued without intent signals?" (If you want the full measurement playbook, see how to measure intent data.)
The ROI Formula (With Worked Examples)
The Formula
Clean enough to put in a board deck:
Intent ROI (%) = (Revenue attributable to intent - intent investment) / intent investment x 100
Simple in theory. The hard part is defining "revenue attributable to intent" and "intent investment" honestly.
Two Worked Examples
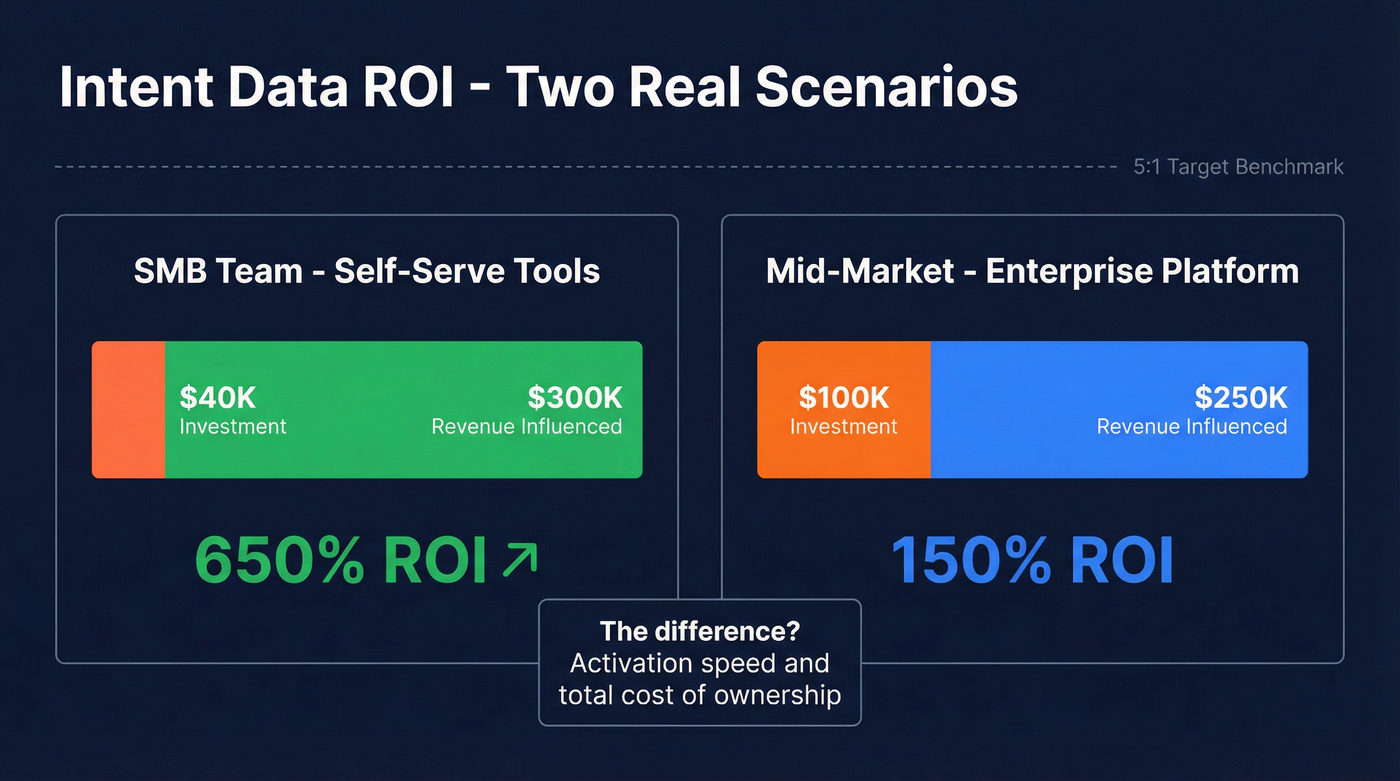
| Scenario | Intent Investment | Revenue Influenced | ROI |
|---|---|---|---|
| SMB team, self-serve tools | $40,000 | $300,000 | 650% |
| Mid-market, enterprise platform | $100,000 | $250,000 | 150% |
The SMB team spent $40k across a mid-tier intent tool, ad spend on intent-flagged accounts, and SDR hours. They influenced $300k in closed-won revenue from accounts that showed intent signals before entering the pipeline. That's 650% - outstanding by any standard.
The mid-market team spent $100k on an enterprise intent platform plus implementation costs, influencing $250k in closed-won revenue. That's 150% - positive, but below the 5:1 revenue-to-spend benchmark many B2B teams target. The difference came down to activation speed and total cost of ownership.
What Counts as "Investment"
Don't just count the platform fee. Your real intent investment includes the annual platform contract, incremental ad spend on intent-flagged accounts, SDR/BDR hours spent working intent lists, enrichment or verification tooling layered on top, and implementation and onboarding time - especially for enterprise platforms that take 3-6 months to deploy.
We've seen teams undercount investment by 30-40%, which inflates their returns on paper and creates a nasty surprise at renewal. (This is also why cost of sales tech stack audits often uncover hidden intent costs.)
What Intent Data Actually Costs
Let's be direct about pricing, because most vendors won't be.
| Provider/Category | Typical Annual Cost | Signal Type |
|---|---|---|
| Bombora | $25k-$75k | Cooperative (5,000+ sites, 12,000+ topics) |
| 6sense | $35k-$150k | AI-aggregated + predictive |
| Demandbase | $100k+ | AI-aggregated + ABM |
| Visitor ID tools | ~$1,200/yr | First-party web traffic |
| Prospeo | Free tier available | 15,000 intent topics + verified contacts |
The gap between a $99/month visitor ID tool and a $150k enterprise platform is enormous - and the ROI difference isn't always proportional. Teams using a ~$1,200/year visitor identification tool can outperform teams spending $25k-$75k/year on third-party intent, simply because the cheaper team acts on every signal within 24 hours. (If you're evaluating visitor ID vendors, compare options in Lead Forensics alternatives.)
Here's the thing about 6sense implementations: they typically take 3-6 months before you're getting clean, actionable signals. That's 3-6 months of paying before you can even start measuring returns. If you're weighing stacks, see 6sense vs ZoomInfo and 6sense vs Clay.
The article just showed you: the gap between 650% ROI and wasted spend is activation speed. Prospeo combines Bombora intent data across 15,000 topics with 143M+ verified emails - so you go from surge signal to verified contact in seconds, not weeks. At $0.01 per email, your total intent investment stays low and your returns stay real.
Stop paying for intent signals you can't act on.
Three Attribution Models That Work
Single-touch attribution is useless for intent data. An account might show intent signals weeks before an SDR books a meeting, which happens weeks before an AE closes the deal. Giving all the credit to the last touch - or the first - misses the point entirely. (If you're building dashboards, ABM reporting is a good companion.)
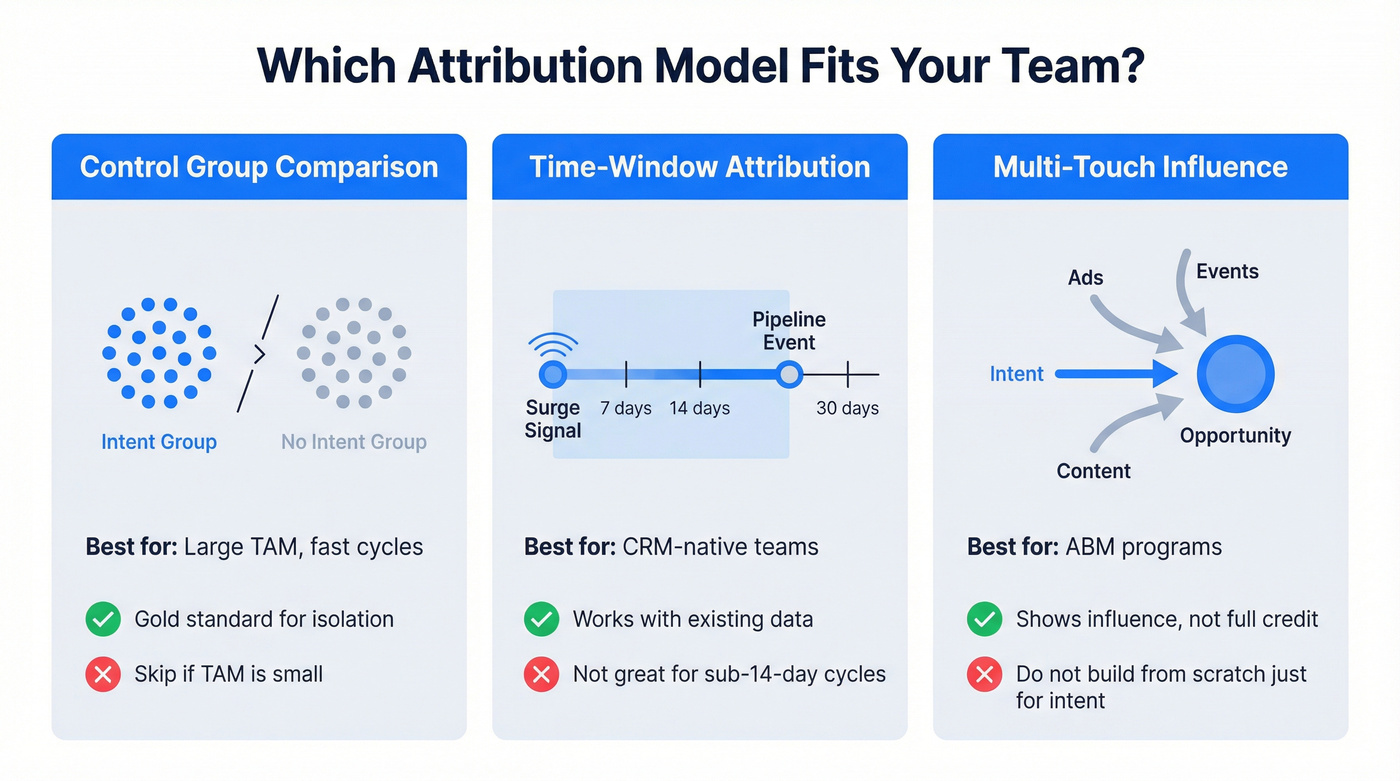
Control Group Comparison
This is the gold standard. Split accounts into two groups - one that receives intent-driven outreach, one that doesn't - and compare meeting rates, opportunity creation, velocity, and win rates between them. It isolates intent's impact cleanly.
Skip this if your total addressable market is small or your sales cycle is so long that you can't get statistical significance within a quarter.
Time-Window Attribution
Pick a window - 7, 14, or 30 days - and attribute pipeline credit to intent whenever a surge signal appeared within that window before a pipeline event. The Only-B2B framework recommends testing multiple windows to find your sweet spot. This works well with existing CRM data and doesn't require a separate analytics platform.
For teams with sales cycles under 14 days, the windows won't capture enough signal-to-action correlation. You'll want a different approach.
Multi-Touch Influence
Best for ABM programs where intent is one of several signals alongside ads, content engagement, and events. Multi-touch influence reporting asks: "Was intent present before opportunity creation or during stage progression?" It doesn't claim full credit - it shows influence.
Don't build a multi-touch attribution system from scratch just for intent. It's not worth the engineering time unless you already have one in place.
KPIs That Prove Intent Data ROI
| KPI | Typical Lift (Intent vs. Non-Intent) | Notes |
|---|---|---|
| MQL-to-SQL conversion | 2-3x | Strongest signal of data quality |
| Sales cycle length | 25-40% shorter | Driven by earlier engagement |
| Average deal size | 10-20% larger | Better targeting = better fit |
| Account engagement | 20-50% higher | Across ads, email, and web |
| Sales pipeline efficiency | Up to 2.9x | When intent is paired with activation |
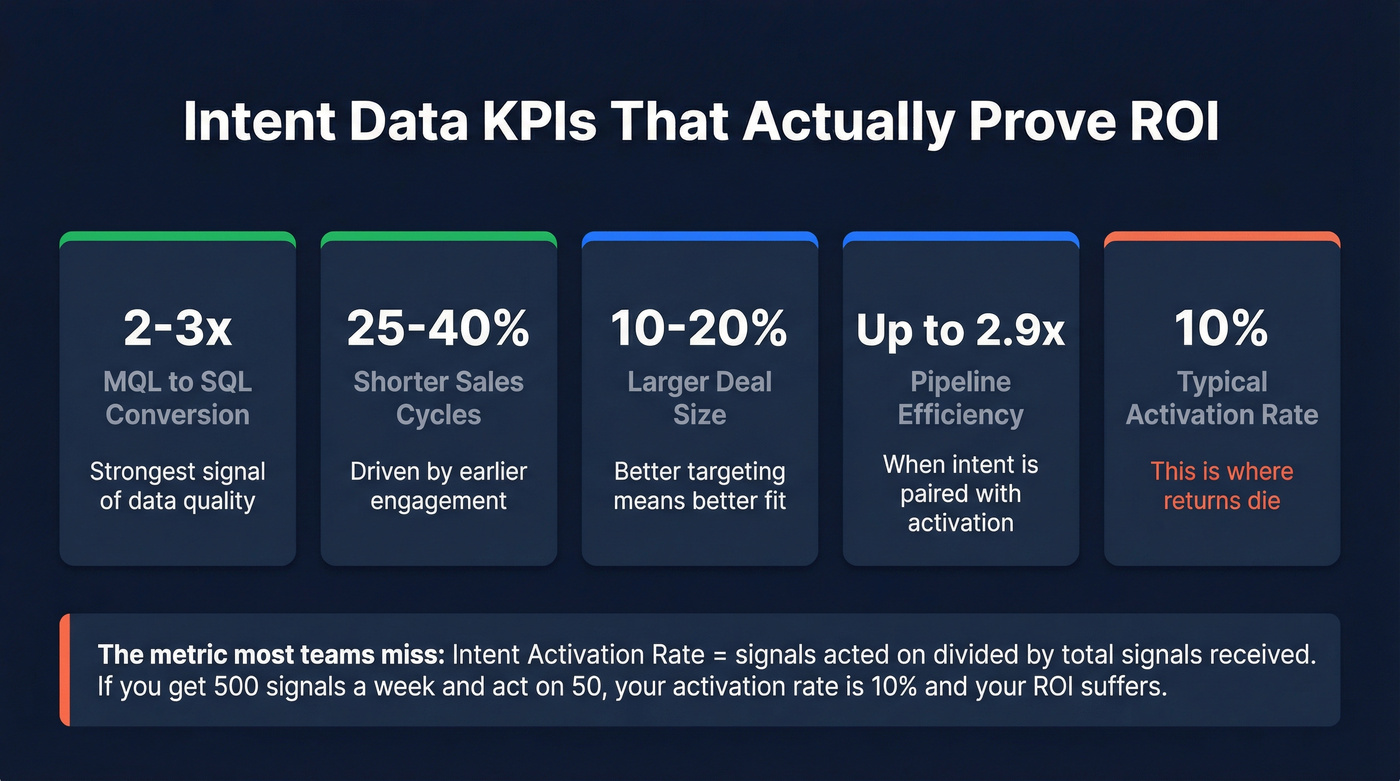
The metric most teams miss is Intent Activation Rate: acted-on signals divided by total signals received. If your team receives 500 intent signals per week and acts on 50, your activation rate is 10%. That's where returns die - not in the data, but in the gap between signal and action.
Separate your KPIs into leading indicators (activation rate, engagement lift, meeting rate) and lagging indicators (pipeline created, revenue influenced, win rate). Leading indicators tell you if the program is working now. Lagging indicators confirm it 3-6 months later. If you only track lagging indicators, you'll kill a working program before it proves itself.
Why Most Teams Get Negative Returns
Intent data isn't broken. Intent operations are broken. In our experience, you'll see two camps in most orgs: teams that swear by it and teams that call it expensive noise. The difference almost always comes down to three failure modes.
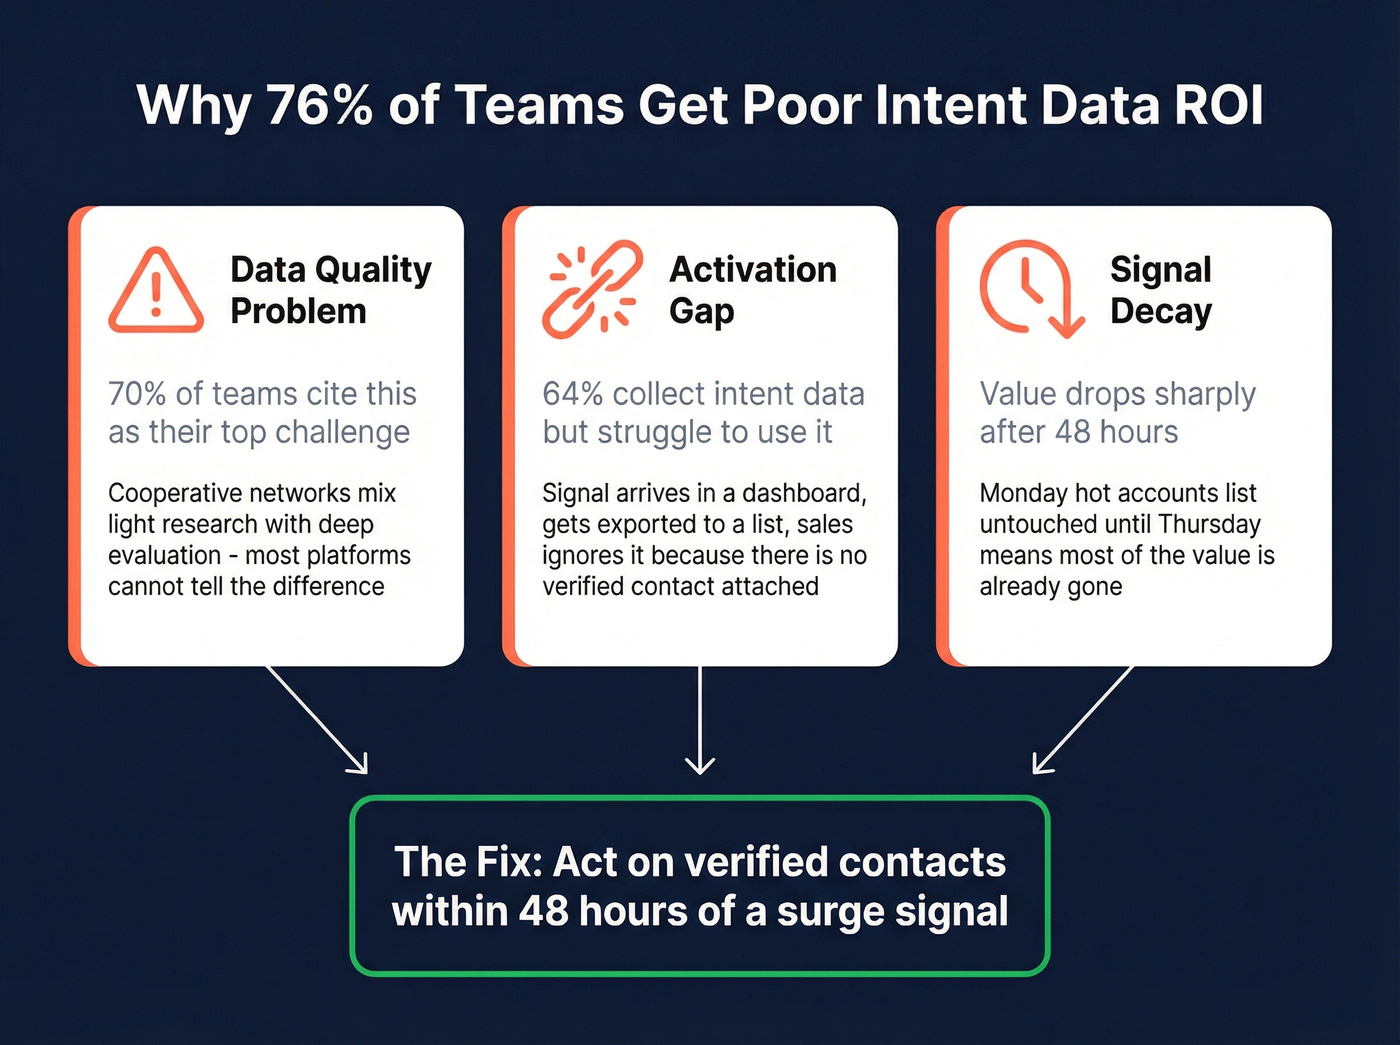
The Data Quality Problem
70% of teams cite data quality as their top challenge with intent. Cooperative data networks aggregate signals from thousands of B2B websites, which means broad coverage but significant noise. An account "surging" on a topic might reflect light research - or deep multi-person evaluation. Most platforms don't distinguish between the two. (To operationalize this, build a simple data quality scorecard.)
The Activation Gap
64% of teams collect intent data but struggle to use it effectively. The signal arrives in a dashboard. Nobody checks the dashboard. Or someone checks it, exports a list, sends it to sales, and sales ignores it because there's no verified contact attached - just a company name.
An intent signal without a verified email or direct dial for the right person is just trivia. "Acme Corp is surging on cloud security" is useless if your SDR can't reach the VP of Infrastructure within 48 hours. (If you're fixing contactability, start with email verification for outreach and direct dial.)
Signal Decay Kills Value
Intent signals decay fast. Here's the hierarchy we use internally:
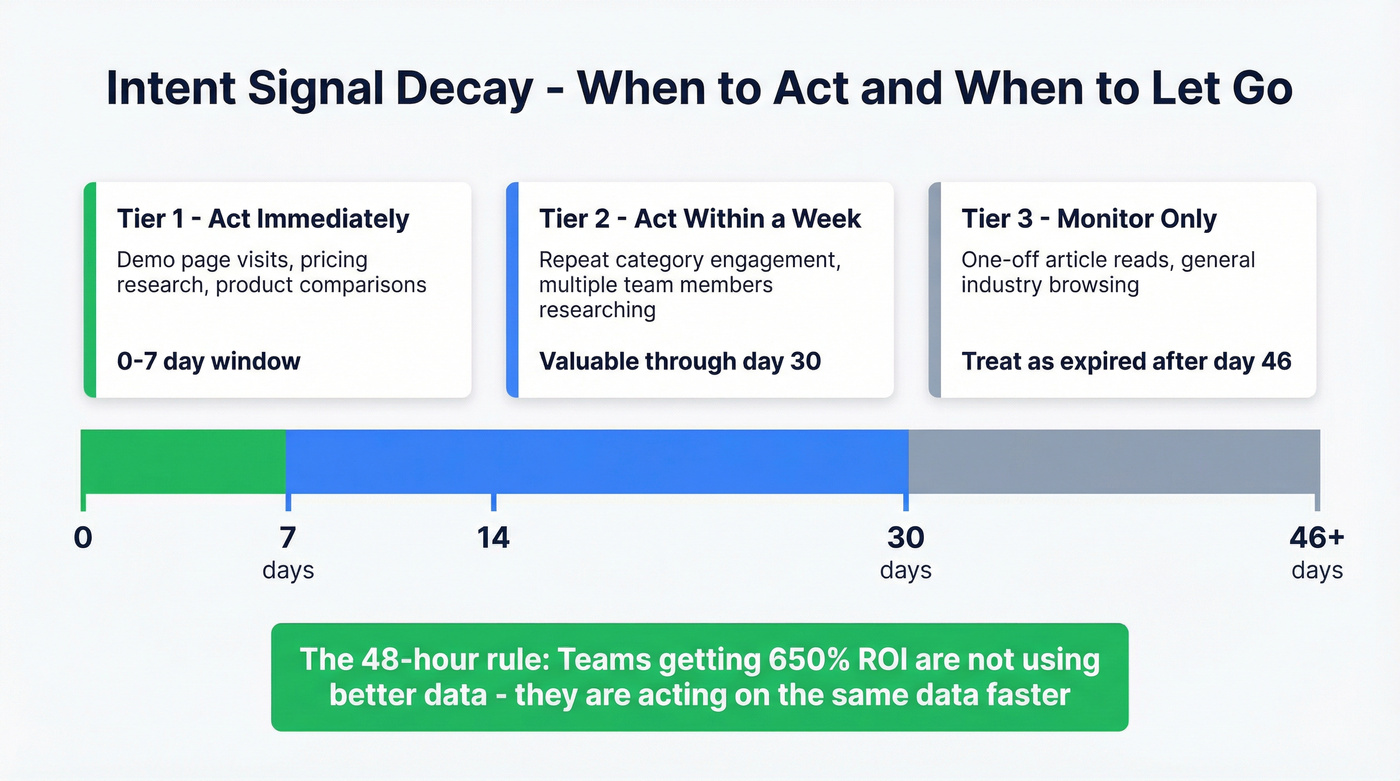
Tier 1 - act immediately: Demo page visits, pricing research, product comparison searches. These have a 0-7 day window before value drops sharply.
Tier 2 - act within a week: Repeat engagement on category topics, multiple team members researching. Still valuable through day 30, but urgency drops after the first week.
Tier 3 - monitor only: One-off article reads, general industry browsing. By day 46+, treat any signal as expired unless it resurfaces.
The 48-hour rule matters more than any other operational change. If your SDRs get a "hot accounts" list on Monday morning and don't touch it until Thursday, they've already lost a big chunk of the value. The teams getting 650% returns aren't using better data - they're acting on the same data faster.
When Intent Data Won't Deliver
Look - most companies with average deals under $10k don't need intent data at all. The math doesn't work. If your average deal is $5,000 and your intent platform costs $50k/year, you need to attribute 10 net-new deals just to break even - and that's before counting activation costs. Save the budget for outbound tooling and spend it on volume.
Beyond deal size, skip intent data if your buyers don't leave trackable signals (senior executives in regulated industries often don't browse B2B content sites), your sales cycle is under two weeks (signals arrive after the decision is already made), your team can't act on signals within 48 hours (a 3-person sales team already at capacity won't benefit from 500 new "surging" accounts per week), or your ICP is too narrow (selling to 200 total accounts globally means the volume of intent signals won't justify the platform cost).
These are common failure conditions that vendors won't mention during the sales process.
How to Maximize Returns
The teams reporting 150-650% returns share three habits - and a telling stat backs this up: 57% of respondents reporting exceptional ROI use campaign execution providers, not just data platforms. Activation beats accumulation every time.
They combine intent with fit data. Firmographics, technographics, and verified contact information. An intent signal tells you when to reach out. Fit data tells you whether to reach out. Verified contacts tell you who to reach out to. You need all three. (If you need a framework, use firmographic and technographic data.)
They activate at the contact level, not the account level. A dashboard showing 200 surging accounts is a starting point. A list of 200 verified emails for the right decision-makers at those accounts is a workable pipeline. 69% of teams use intent for account prioritization, but only 48% use it to improve outreach efficiency - that gap is where returns leak. (This is also the core of signal-based outbound.)
They care about data freshness. Monthly batch refreshes mean you're working with signals that are already decaying by the time they hit your CRM. Weekly refresh cycles compress the gap between signal and action. Teams that also track return on ad spend for intent-driven campaigns - comparing cost-per-opportunity for intent-targeted ads versus untargeted ones - consistently find that intent-flagged audiences convert at 2-3x the rate, making every ad dollar work harder.
This is where Prospeo closes the loop. It layers 15,000 Bombora intent topics directly on top of 300M+ professional profiles with 98% email accuracy and 125M+ verified mobile numbers. Instead of getting an account-level signal and spending 30 minutes hunting for the right contact, you filter by intent topic, job title, and company size - and export verified emails and direct dials in the same workflow. The 7-day data refresh cycle means you're not reaching out to people who changed jobs six weeks ago. (If you're battling decay, see B2B contact data decay.)
You read it above: teams undercount intent investment by 30-40% when they forget enrichment costs. Prospeo eliminates the extra tooling layer. 15,000 intent topics, 98% email accuracy, 125M+ verified mobiles, and 30+ filters - one platform, one cost. No 3-6 month implementation. Self-serve, live today.
Cut your intent stack cost and double your activation rate.
FAQ
What's a good intent data ROI?
The standard B2B marketing benchmark is a 5:1 revenue-to-spend ratio. Teams with strong activation workflows report 150-650% returns depending on deal size and total spend. Below 5:1 after 12 months, diagnose your activation rate first - the problem is almost always speed-to-action, not the data itself.
How long until intent data shows positive returns?
Expect 3-6 months for enterprise platforms due to implementation timelines. Self-serve tools with built-in intent capabilities can activate in days, compressing time-to-value significantly. The variable isn't the tool - it's how fast your team acts on signals.
Can small teams get ROI from intent data?
Only if you've got outbound infrastructure to act on signals within 48 hours. A 5-person team with a $99/month visitor ID tool they use daily will outperform a team paying $75k/year for a platform nobody checks. Start small, prove the workflow, then scale spend.
How do I measure return on ad spend for intent-driven campaigns?
Track cost-per-opportunity and cost-per-closed-deal separately for intent-flagged audiences versus your standard targeting. Most teams find 2-3x higher ROAS because you're serving ads to accounts already in-market, which lifts click-through and conversion rates simultaneously.