Pipeline Growth: The Complete 2026 Playbook (Benchmarks, Formulas, and Tactics)
It's Q3 planning. Your CRO just asked why pipeline is flat despite hiring two more SDRs last quarter. You've got more reps, more tools, and somehow less pipeline per dollar than a year ago. You're not alone - a Blue Ridge Partners survey of 76 SaaS commercial leaders found only 14% rate their pipeline-building as "highly effective." Another 17% called it "not very effective." The rest landed in the mushy middle of "somewhat effective," which is corporate speak for "we're not sure it's working."
The problem isn't effort. It's that most teams treat pipeline growth as an activity metric - more calls, more emails, more MQLs - instead of what it actually is: a system with measurable inputs, conversion physics, and compounding failure points. The teams that build real, durable gains treat it as an engineering problem, not a hustle problem.
What You Need (Quick Version)
Sustainable pipeline expansion comes down to three things:
- Math. Know your coverage ratio, velocity, and stage conversion rates. If you can't calculate how many MQLs you need per month to hit your number, everything else is guesswork.
- Data quality. Bad contact data silently kills conversion. If 35% of your emails bounce, your 3x pipeline coverage is actually 2x. You're forecasting on fiction.
- Discipline. Multi-touch sequences beat sporadic outreach every time. Block time daily. Book the follow-up before the call ends. Review pipeline weekly, not quarterly.
The minimum viable stack: a CRM like HubSpot or Salesforce, a verified data source such as Prospeo for emails and mobile numbers that actually connect, and a sequencing tool like Instantly or Apollo to run multi-channel cadences.
What's Driving Pipeline in 2026
Insight Partners published their ABC GO framework based on portfolio-wide survey data, and it maps where pipeline is actually coming from right now. The five levers: AI, Brand, Channel, GEO (generative engine optimization), and Outbound.
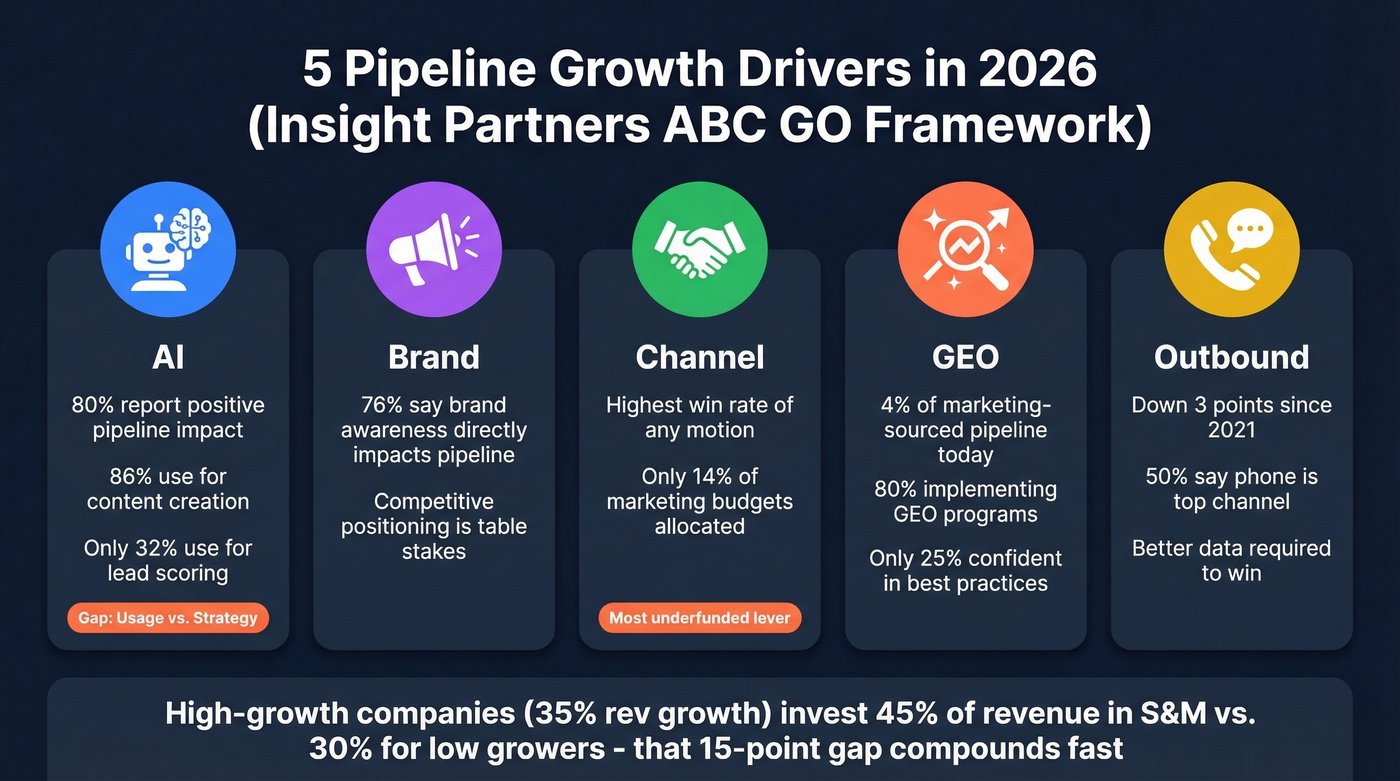
Here's what the numbers say. Almost 80% of respondents reported AI having a positive impact on pipeline generation, but the usage is lopsided - 86% use AI for content creation while only 32% use AI for predictive analytics and lead scoring. Even more telling: nearly twice as many companies said they'll reduce headcount rather than increase it as AI takes over repetitive pipeline tasks. Brand matters more than most demand gen teams admit - 76% say strong competitive brand awareness directly impacts pipeline. Channel partnerships carry the highest win rate of any motion, yet only 14% of marketing budgets go there. GEO already accounts for 4% of marketing-sourced pipeline across the Insight portfolio, with 80% of companies implementing programs to appear in generative search results. But only 1 in 4 leaders say they're confident in GEO best practices - the gap between adoption and competence is the real story.
Outbound isn't dead, but it's harder. Outbound-sourced pipeline is down 3 percentage points since 2021. Yet calls remain the most impactful outreach method - 50% of leaders cite phone as their top-performing channel. The takeaway: outbound still works, but only with better data, tighter targeting, and multi-touch execution (especially with outbound getting noisier every quarter).
The investment gap between winners and losers is stark. High-growth SaaS companies at 35% revenue growth invest roughly 45% of revenue in sales and marketing. Low growers at 8% growth invest 30%. That 15-point gap compounds fast.
Pipeline Math - The Formulas You Need
Pipeline Velocity
Pipeline velocity tells you how much revenue your pipeline generates per day. It's the single best leading indicator for whether you'll hit quota.
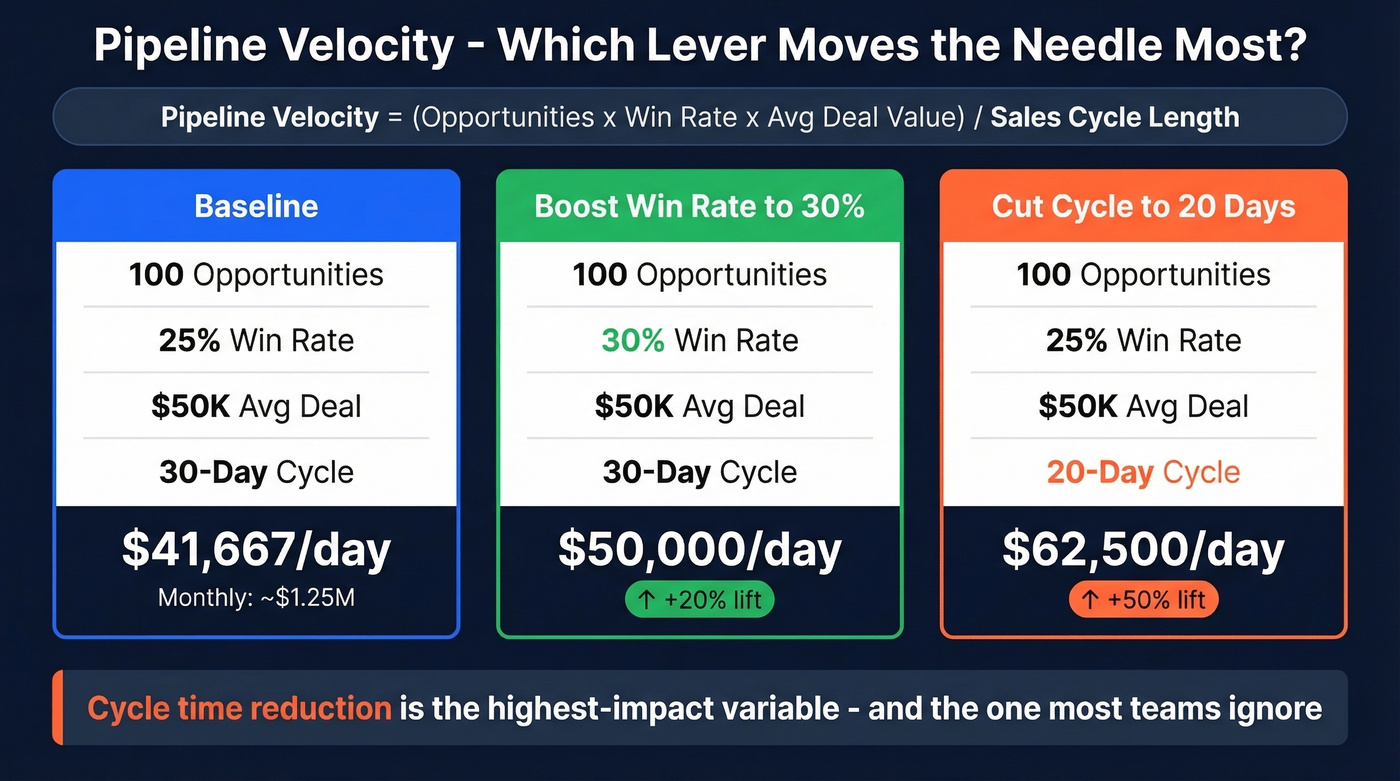
Pipeline Velocity = (Number of Opportunities x Win Rate x Average Deal Value) / Sales Cycle Length
Say you've got 100 opportunities per month, a 25% win rate, $50K average deal value, and a 30-day sales cycle. That's (100 x 0.25 x $50,000) / 30 = $41,667 per day, or roughly $1.25M per month.
Now watch what happens when you pull different levers. Increase win rate from 25% to 30% and daily velocity jumps to $50,000 - a 20% lift. But reduce cycle time from 30 to 20 days and velocity hits $62,500 - a 50% lift. Cycle time reduction is the highest-impact variable in this formula, and it's the one most teams ignore because it requires operational discipline rather than just more pipeline (see SaaS sales cycle benchmarks and stage timing).
Coverage Ratio
Pipeline coverage ratio = total pipeline value / sales target. If you've got $4M in pipeline against a $1M target, that's 4x coverage. Simple enough.
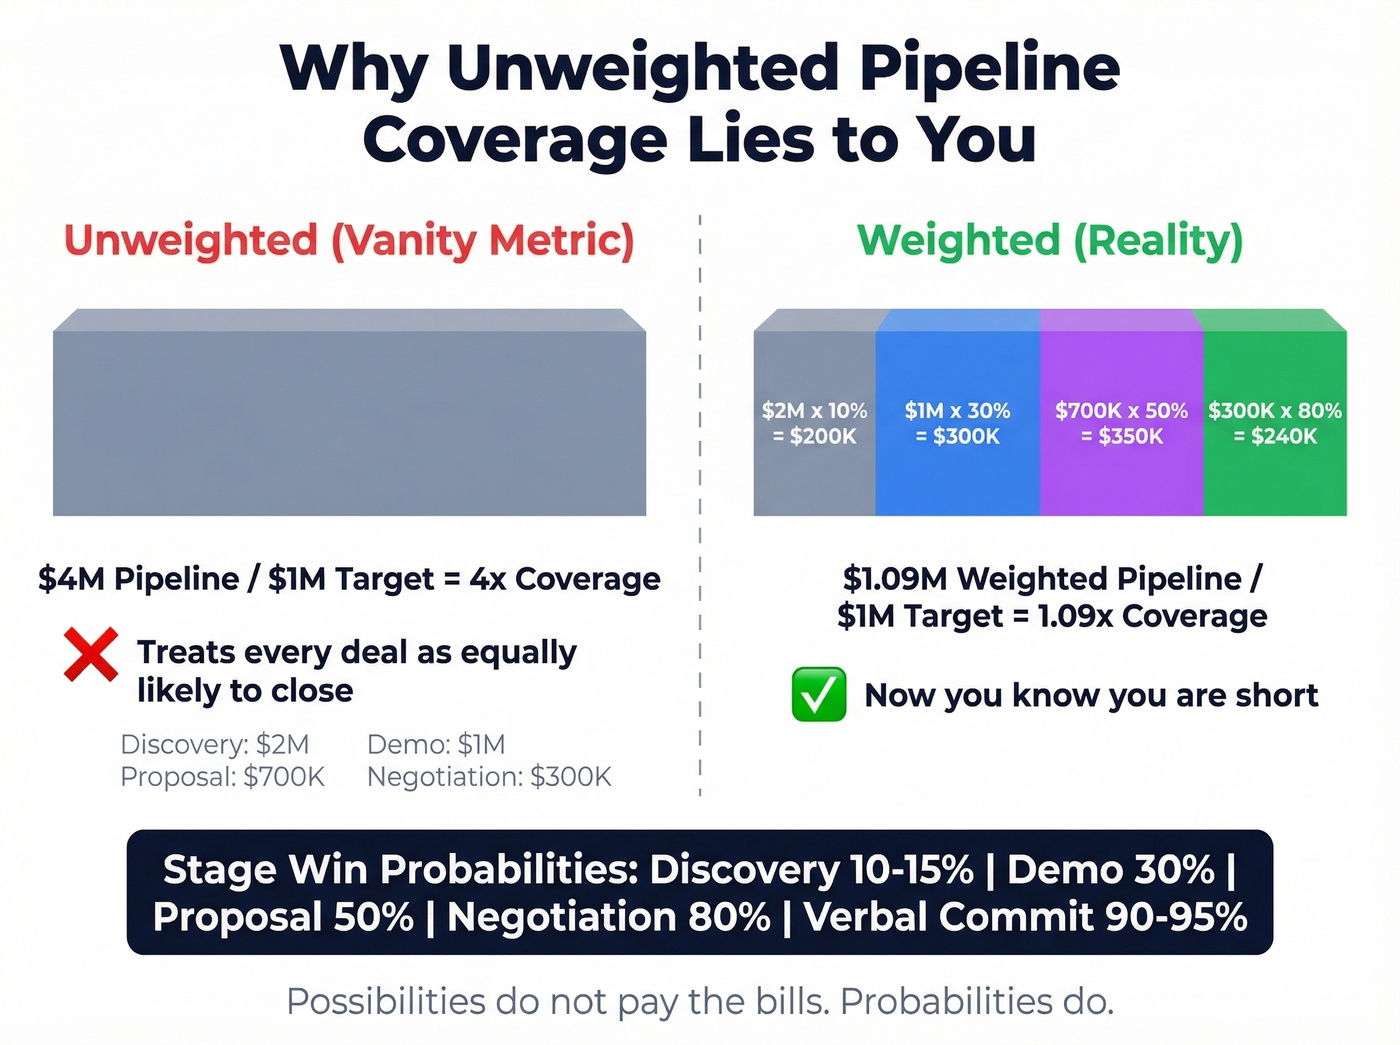
The problem is that most teams calculate this with unweighted pipeline, which treats every opportunity as equally likely to close. That's fantasy. Segment benchmarks for unweighted coverage: enterprise teams need 3-5x, mid-market 2.5-4x, and SMB 2-3x.
Here's the contrarian take - unweighted ratios are misleading. A pipeline full of early-stage discovery calls isn't the same as a pipeline full of proposals pending signature. Weighted pipeline multiplies each opportunity's value by its stage probability. Use these as starting defaults:
| Stage | Win Probability |
|---|---|
| Discovery | 10-15% |
| Demo/Presentation | 30% |
| Proposal/Quote | 50% |
| Negotiation | 80% |
| Verbal Commit | 90-95% |
"Total pipeline is a vanity metric. Possibilities don't pay the bills. Probabilities do." - Software Equity Group
An SMB team with a 45-day cycle and 40% win rate can operate comfortably at 1.5-2x weighted coverage. An enterprise team with a 12-month cycle and 15% win rate needs 4-5x. One more stat that should bother you: 61% of B2B marketers send all leads directly to sales, but only 21% are actually qualified (a classic lead handoff failure).
Working Backward from Revenue
Say your target is $5M in new ARR this year, your average deal is $50K, and your MQL-to-close rate runs about 3%, which is typical for growth-stage SaaS. You need 100 closed deals. At 3% conversion, that's roughly 3,300 MQLs for the year - about 275 per month.
That number should drive every budget conversation, headcount decision, and channel investment you make. It should also scare you a little, because buyers conduct 70% of their research independently before engaging sales, and the average B2B buying committee includes 7-9 decision-makers. You're not just generating leads - you're trying to reach the right person in a group of nine, most of whom have already formed opinions before your SDR picks up the phone (which is why business buying behavior matters more than your activity dashboard).
Pipeline Benchmarks for 2026
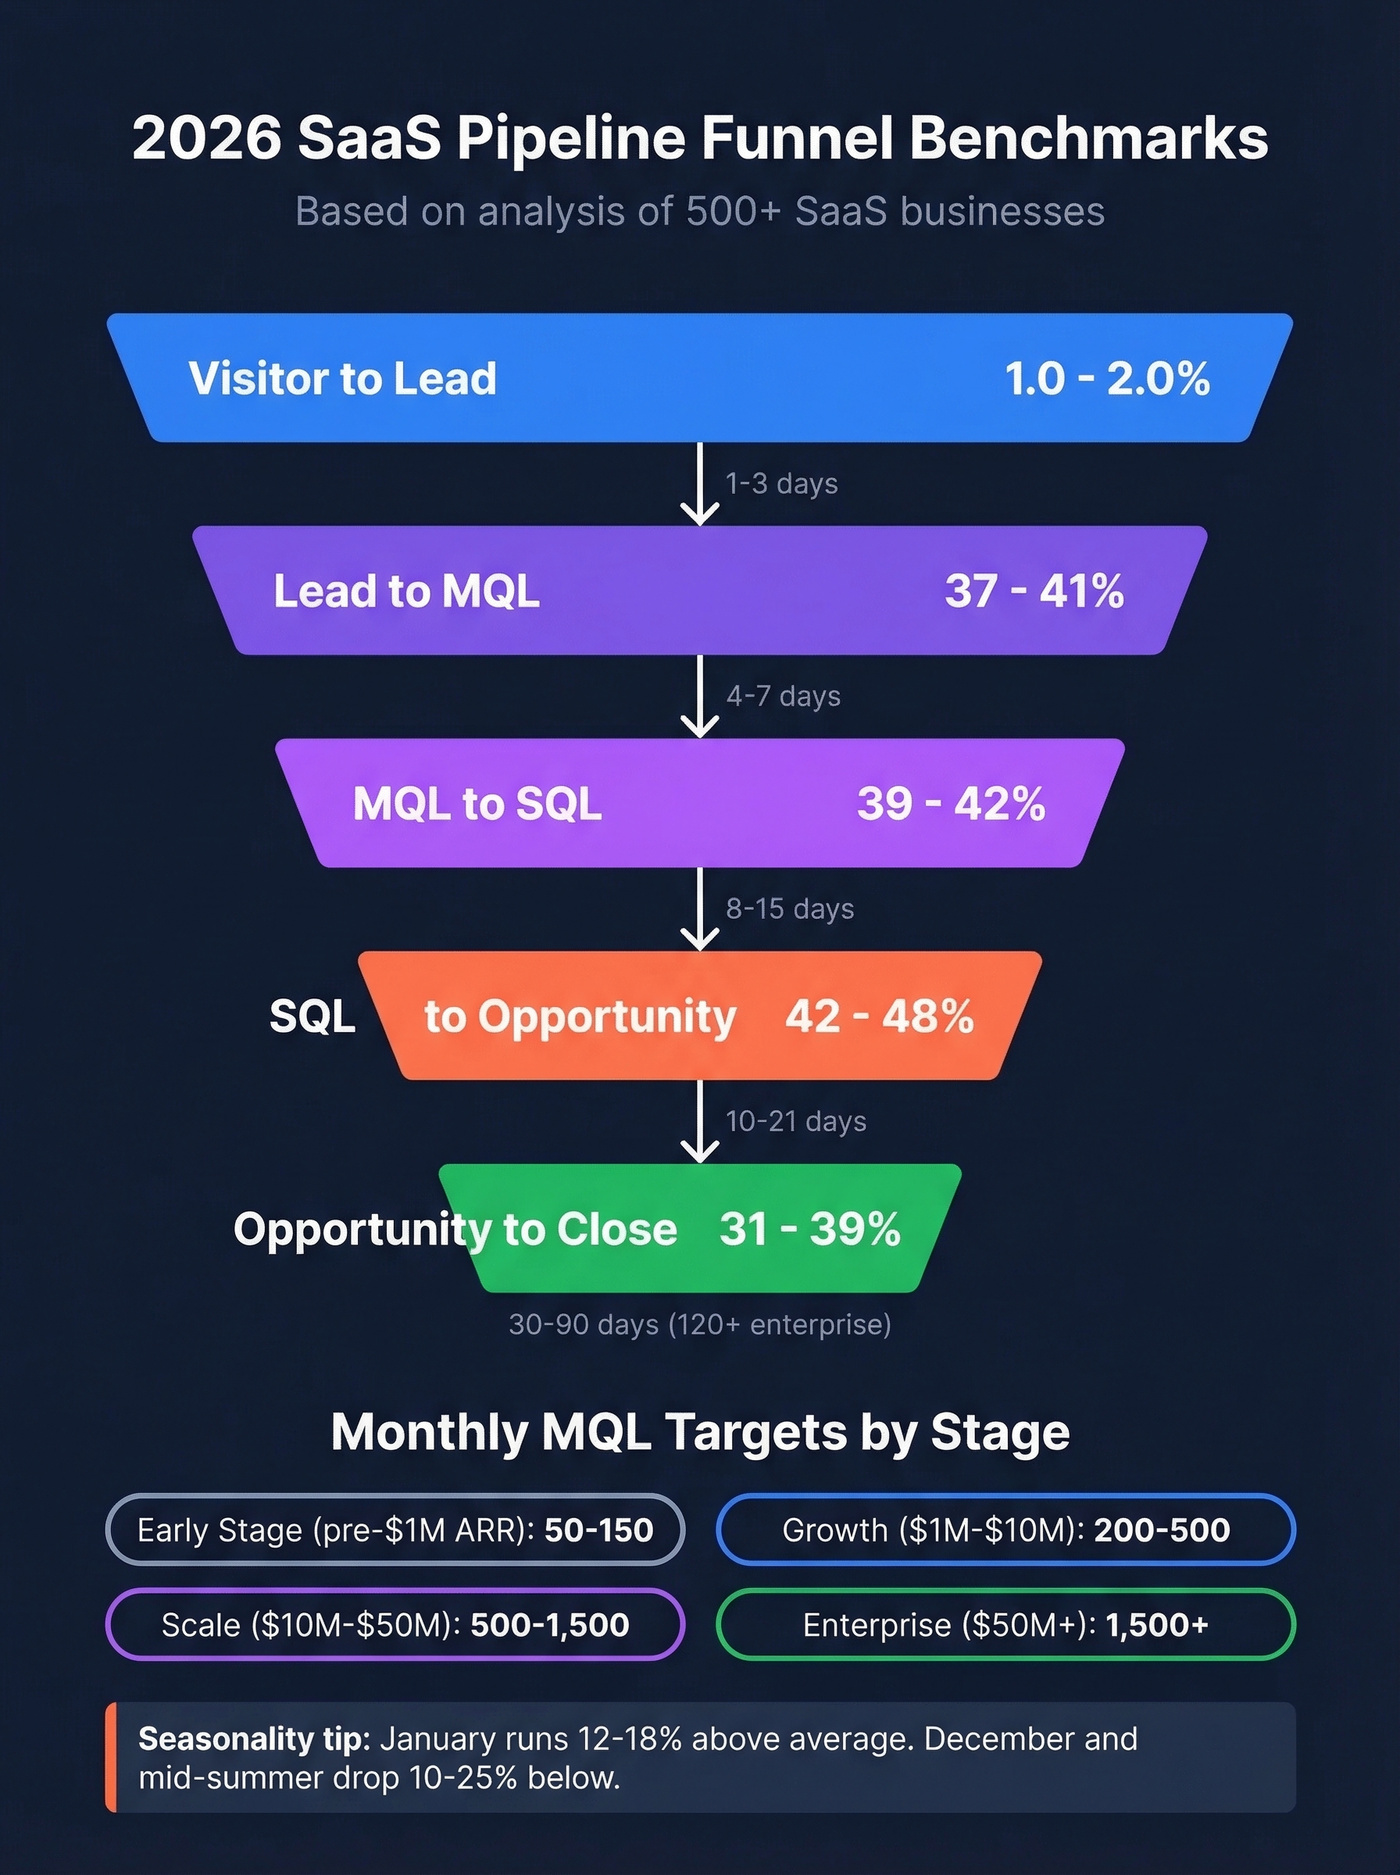
These ranges come from analysis across 500+ SaaS businesses and represent directional benchmarks, not gospel. Your numbers will vary by segment, ACV, and sales motion.
| Funnel Stage | Conversion Range |
|---|---|
| Visitor to Lead | 1.0-2.0% |
| Lead to MQL | 37-41% |
| MQL to SQL | 39-42% |
| SQL to Opportunity | 42-48% |
| Opportunity to Close | 31-39% |
| Stage Transition | Median Time to Convert |
|---|---|
| Visitor to Lead | 1-3 days |
| Lead to MQL | 4-7 days |
| MQL to SQL | 8-15 days |
| SQL to Opportunity | 10-21 days |
| Opportunity to Close | 30-90 days (120+ enterprise) |
Monthly MQL volume targets by company stage:
- Early-stage (pre-$1M ARR): 50-150 MQLs
- Growth ($1M-$10M ARR): 200-500 MQLs
- Scale ($10M-$50M ARR): 500-1,500 MQLs
- Enterprise ($50M+ ARR): 1,500+ MQLs
CAC benchmarks vary sharply by segment. SMB customer acquisition typically runs $1K-$4K per customer, while mid-market climbs to $4K-$15K. If your CAC is above those ranges, a slow or leaky pipeline is almost always the culprit (use a clean CAC SaaS model to sanity-check inputs).
Seasonality note: January typically runs 12-18% above average conversion rates. September and October also trend 8-10% above average - a window worth planning around. December and mid-summer drop 10-25% below. If your Q4 pipeline looks thin, it's timing as much as strategy.
You just saw the math: cutting bounce rates from 35% to under 4% can turn 2x effective coverage into real 3-4x coverage overnight. Prospeo's 98% email accuracy and 7-day data refresh cycle mean your pipeline formulas reflect reality, not fiction. Meritt tripled their pipeline from $100K to $300K/week after making the switch.
Stop forecasting on bounced emails. Build pipeline on verified data.
Metrics That Separate Winners
David Sacks laid out a clean framework that holds up well in practice. It breaks into three buckets.
Generation metrics - are you creating enough pipeline? Opportunities created is the leading indicator. If opps are growing but reps can't keep up, you need more capacity. If they're flat while rep count grows, you've got a demand gen problem, not a capacity problem. Track pipeline value created (total ARR of new opportunities entering the funnel) and win rate, which should hover around 20% though this varies by segment and how you define "opportunity" (align this with marketing sourced pipeline so teams aren’t arguing over definitions).
Conversion metrics - how efficiently does pipeline move? Sales cycle length directly impacts CAC and capacity planning. Cohorted win rates, where you track win/loss/open by the month each opportunity was created, reveal "danger months" where deals stall. Stage conversion rate and average time per stage pinpoint exactly where your funnel leaks (a practical way to operationalize pipeline bottlenecks).
Active pipeline metrics - your forecast foundation. Open pipeline by close date only works if close dates are realistic (they usually aren't). Weighted pipeline multiplies ARR by stage probability, but garbage probabilities produce garbage forecasts. Calibrate your stage weights quarterly against actual outcomes (this is the core of pipeline predictability).
Tracking these consistently is what separates teams that achieve predictable revenue from those that lurch between feast and famine quarters.
Highest-Impact Strategies
Multi-Touch Outbound Sequences
A bootstrapped SaaS founder posted on r/startups about growing pipeline 8x in two weeks on a $100-200/month budget. The playbook: 9-15 touchpoints per prospect across email, social, and phone. Three emails in one chain, then three in another chain with a different angle. Social engagement between - profile views, post comments, direct messages - including video messages that pulled roughly 3x the response rate of text. The final step: a call that's "hardly cold at this point."
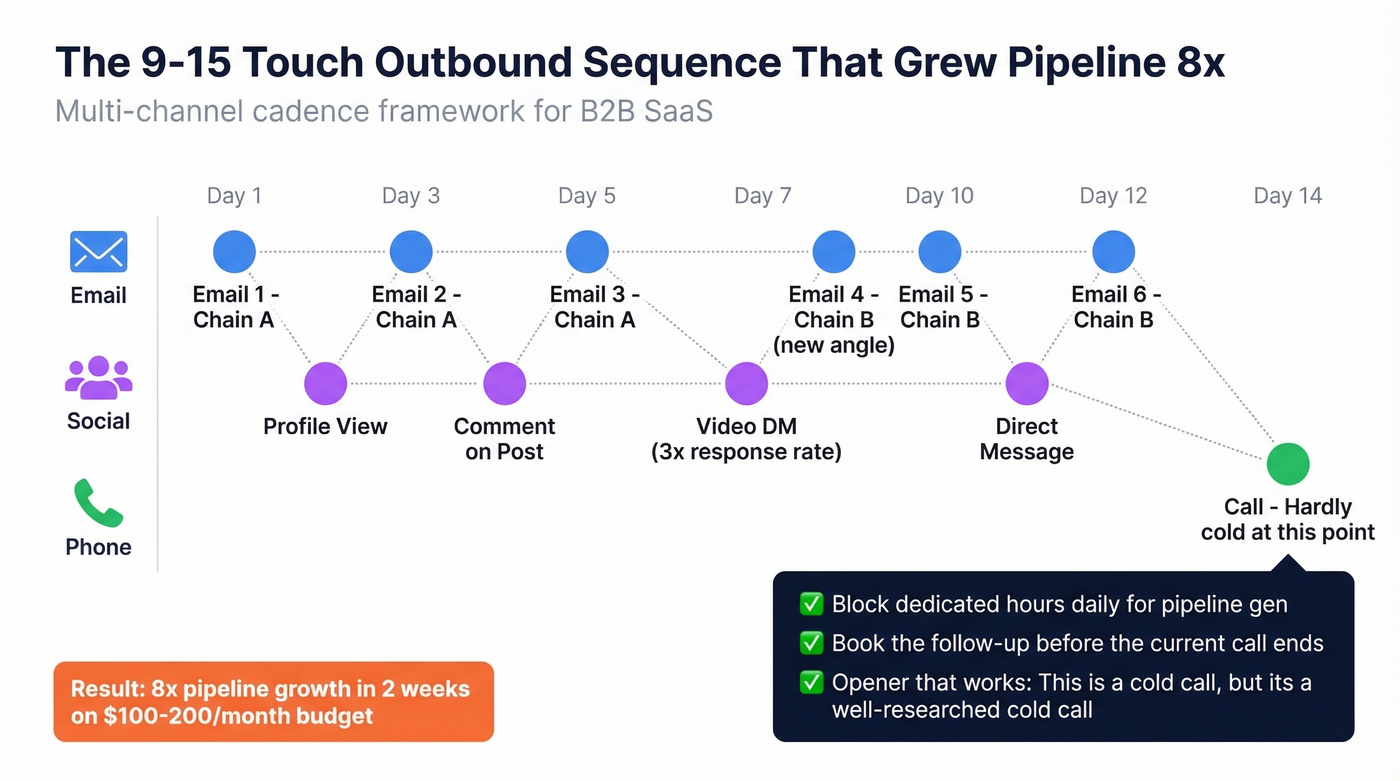
The call opener that tripled their meeting conversion rate: "This is a cold call, but it's a well-researched cold call..." Simple, disarming, honest. They blocked dedicated hours daily for pipeline gen and enforced one rule religiously: book the follow-up meeting before the current call ends (pair this with proven cold calling methods so reps don’t freestyle).
None of this works if your contact data is wrong. Prospeo's Chrome extension pulls verified emails and mobile numbers from any professional profile or company website in one click, so you're not burning sequence steps on bounced addresses or disconnected numbers.
Skip this if your ICP has fewer than 500 total accounts. At that scale, manual research and warm introductions will outperform sequences.
Data Quality as a Growth Lever
We've seen teams with 35-40% email bounce rates wonder why their pipeline coverage ratio doesn't translate to revenue. The math is brutal: if a third of your contacts bounce, your "3x coverage" is functionally 2x. You're forecasting on phantom pipeline.
Two proof points. Meritt was running $100K/week in pipeline with a 35% bounce rate. After fixing their data quality, pipeline tripled to $300K/week and bounce rates dropped below 4%. Snyk had 50 AEs prospecting 4-6 hours per week with bounce rates of 35-40%. After cleaning up their data source, bounce rates fell under 5%, AE-sourced pipeline jumped 180%, and the team generated 200+ new opportunities per month.
These aren't marginal improvements. They're structural changes to the business that accelerate results in ways no amount of extra headcount can match. The difference between 35% bounce and 4% bounce isn't just deliverability - it's domain reputation, sender score, and whether your emails land in inboxes or spam folders for the next six months (if you need the mechanics, start with email deliverability changes and what they mean operationally).

Skip this if your current bounce rate is already under 5% and your domain reputation is clean. Focus your energy on conversion instead.
Channel and Partner Investment
Only 14% of marketing budget goes to channel and partner motions despite channel carrying the highest win rate of any pipeline source. Look at the economics: SEO delivers 702% ROI, referral programs cost roughly $150 per customer, and outbound runs $1,980 per customer. If your budget allocation puts 60% into paid acquisition and 14% into channel, the math is broken.
We've watched teams double channel investment and see disproportionate returns because partner-sourced deals come with built-in trust and shorter cycles. The best channel programs aren't "partnerships" in the press-release sense - they're co-selling motions where your partner's AE introduces you into an active deal (build it like a real co-selling motion, not a logo swap). For teams looking to scale without proportionally increasing spend, channel is the most efficient lever available.
Skip this if you don't have at least one person who can own partner relationships full-time. Half-hearted channel programs produce zero pipeline and burn goodwill with partners.
AI for Pipeline Generation
The adoption gap is the opportunity. 86% of teams use AI for content production, but only 32% use it for predictive lead scoring and pipeline analytics. Nearly twice as many companies plan to reduce headcount rather than increase it as AI absorbs repetitive tasks - which means the teams that close this gap will run leaner and faster.
Here's the thing: most "AI for pipeline" implementations today are glorified email rewriters. The actual edge comes from using AI to prioritize accounts based on intent signals, predict which deals will stall before they do, and flag pipeline at risk of slipping. That's where the structural advantage lives (this is where B2B predictive analytics becomes a revenue lever, not a dashboard).
Skip this if you have fewer than 500 opportunities per quarter. At low volume, human judgment outperforms any model you can train.
Expansion Pipeline
This is the most overlooked lever in SaaS. Median net revenue retention runs 106%, and expansion ARR accounts for 40% of total new ARR. For companies above $50M ARR, expansion exceeds 50% of new bookings. If you're not treating your install base as a pipeline source, you're leaving the easiest revenue on the table (the operating model is basically land and expand).
Hot take: If your ACV is under $25K and your NRR is below 100%, you don't have a pipeline problem - you have a product-market fit problem. No amount of top-of-funnel activity will fix a leaky bucket. Fix retention first, then pour.
Skip this if you're pre-product-market fit or have fewer than 50 customers. Your install base isn't big enough to be a meaningful source yet.
Pipeline Hygiene and Stage Discipline
Pipeline that can't close this quarter isn't pipeline - it's a wish list. The weighted coverage framework only works if you're ruthless about realistic close dates and regular pipeline reviews. We've run bake-offs where the team with less total pipeline but better stage discipline consistently outforecast the team with 5x coverage and sloppy data. Review weekly. Purge stale deals monthly.
Skip this if - actually, don't skip this. Every team needs pipeline hygiene. If you think you don't, your forecast is lying to you.
Phone is the #1 outreach channel for pipeline generation, but only if someone picks up. Prospeo's 125M+ verified mobile numbers deliver a 30% pickup rate - nearly 3x the industry average. When your velocity formula depends on conversations, not voicemails, every direct dial matters.
Connect with decision-makers at 3x the rate, starting at $0.01 per lead.
How to Diagnose a Stalled Pipeline
If your pipeline is stalled, trace the symptom to the root cause.
Top-heavy pipeline (lots of early-stage opportunities, few closing). This is a qualification problem or conversion bottleneck. Tighten MQL criteria. Improve discovery calls. Stop sending unqualified leads to sales - remember, only 21% of leads passed to sales are actually qualified.
Bottom-heavy pipeline (few new opportunities entering). This is a demand gen problem. Increase outbound volume, invest in channel partnerships, or revisit your ICP targeting. More reps won't help if there aren't enough opportunities to work (start with a tighter Ideal Customer Profile (ICP) before you add volume).
Slow pipeline (deals stuck in mid-stages). This is a velocity problem. Reduce cycle time by multi-threading into buying committees, improving data quality so reps reach the right people faster, and eliminating unnecessary stages. The median CAC efficiency benchmark sits at $2.00 per $1.00 of new ARR - if yours is worse, slow pipeline is likely the culprit.
Pipeline growing but revenue flat. Data quality or stage inflation problem. Audit bounce rates, verify contact data, and recalibrate stage probabilities against actual close rates from the last two quarters.
Building a Strategy That Compounds
The tactics above work in isolation, but the real gains come when you layer them into a coherent system that compounds quarter over quarter. Here's the sequencing we've seen work:
- Fix data quality first. Nothing else scales if a third of your outreach bounces. Get bounce rates under 5% before investing in volume.
- Nail your pipeline math. Calculate your backward-from-revenue MQL targets, set weighted coverage benchmarks by segment, and track velocity weekly.
- Layer in multi-touch outbound. Once data is clean and math is clear, sequences become a predictable engine rather than a spray-and-pray exercise (use a consistent outreach sequences standard so reps don’t invent their own rules).
- Invest in channel and expansion. These are the compounding levers - partner-sourced and expansion deals get easier over time as relationships deepen and your install base grows.
- Add AI where it creates real advantage. Use it to prioritize, predict, and flag - not just to write emails faster.
Let's be honest: most teams try to do all five at once and end up doing none of them well. Pick the first one that's broken, fix it, then move down the list. Teams that follow this sequence build pipeline growth that doesn't collapse when a single channel underperforms or a key rep leaves.
Pipeline Growth FAQ
What's a good pipeline coverage ratio?
Enterprise teams should target 3-5x unweighted coverage, mid-market 2.5-4x, and SMB 2-3x - but only weighted pipeline matters for forecasting. Weight each opportunity by stage probability and filter by what can actually close this quarter. Unweighted ratios inflate confidence by treating discovery calls the same as deals in negotiation.
How do you calculate pipeline velocity?
Pipeline Velocity = (Opportunities x Win Rate x Average Deal Value) / Sales Cycle Length. The result is revenue generated per day - the single best predictor of whether you'll hit quota. Track it monthly and watch for trend changes before they hit your forecast.
Why is my pipeline growing but revenue isn't?
Usually a data quality or qualification problem. If 35-40% of contact data bounces, your pipeline is inflated with phantom opportunities that'll never close. Audit bounce rates first, then tighten MQL criteria so only genuinely qualified leads enter the funnel.
How many MQLs do I need per month?
Early-stage companies need 50-150 MQLs/month, growth-stage 200-500, and scale-stage 500-1,500. Work backward from your annual revenue target using your actual MQL-to-close rate. If you don't know that conversion number, finding it is job one before any pipeline investment.
What's the single biggest lever for pipeline growth?
Reducing sales cycle length. The velocity formula shows that cutting cycle time from 30 to 20 days lifts daily revenue throughput by 50% - more impact than improving win rate or adding opportunities. Multi-thread into buying committees and use verified direct dials to reach decision-makers faster.