How to Build a Sales Process Flowchart Your Team Will Actually Follow
Every sales team has a process. Most just haven't written it down - and the ones that have usually built a sales process flowchart nobody references after week two. 55% of lost revenue ties back to lacking a defined sales process, and 84% of reps missed quota last year. Those numbers aren't a coincidence. Companies with a documented process are 33% more likely to see higher revenue growth, and when every rep defines "qualified" differently, your pipeline becomes fiction.
Here's the thing: the flowchart itself isn't the hard part. The decision criteria at each stage are. You could sketch this on a napkin and outperform most teams running a 40-slide Miro board with no exit criteria. Stop obsessing over the diagram and start obsessing over what moves a deal forward.
What You Need (Quick Version)
If you're short on time, here's the framework. Each point links to a deeper section below.
- Define 5-7 stages with entry and exit criteria. Not just stage names - what specific action advances a deal? (Stage breakdown)
- Add timeboxes. A deal sitting in "Proposal Sent" for 60 days isn't a deal. (How to build)
- Branch for inbound vs. outbound. They enter your funnel differently and need different early-stage logic. ([Inbound vs. outbound](#inbound-vs-outbound - two-entry-points))
- Pilot on 3-5 deals before rolling out. Don't launch to 50 reps on day one. (Rolling out)
- Start with verified contact data feeding the top of your funnel. If emails bounce, nothing downstream matters. (Lead generation stage)
Sales Flowchart Symbols Cheat Sheet
Diamonds are where the real work happens. Every diamond forces your team to answer a binary question before advancing - and that's what turns a vague process into a repeatable one. Before you open any diagramming tool, know the six symbols you'll actually use.
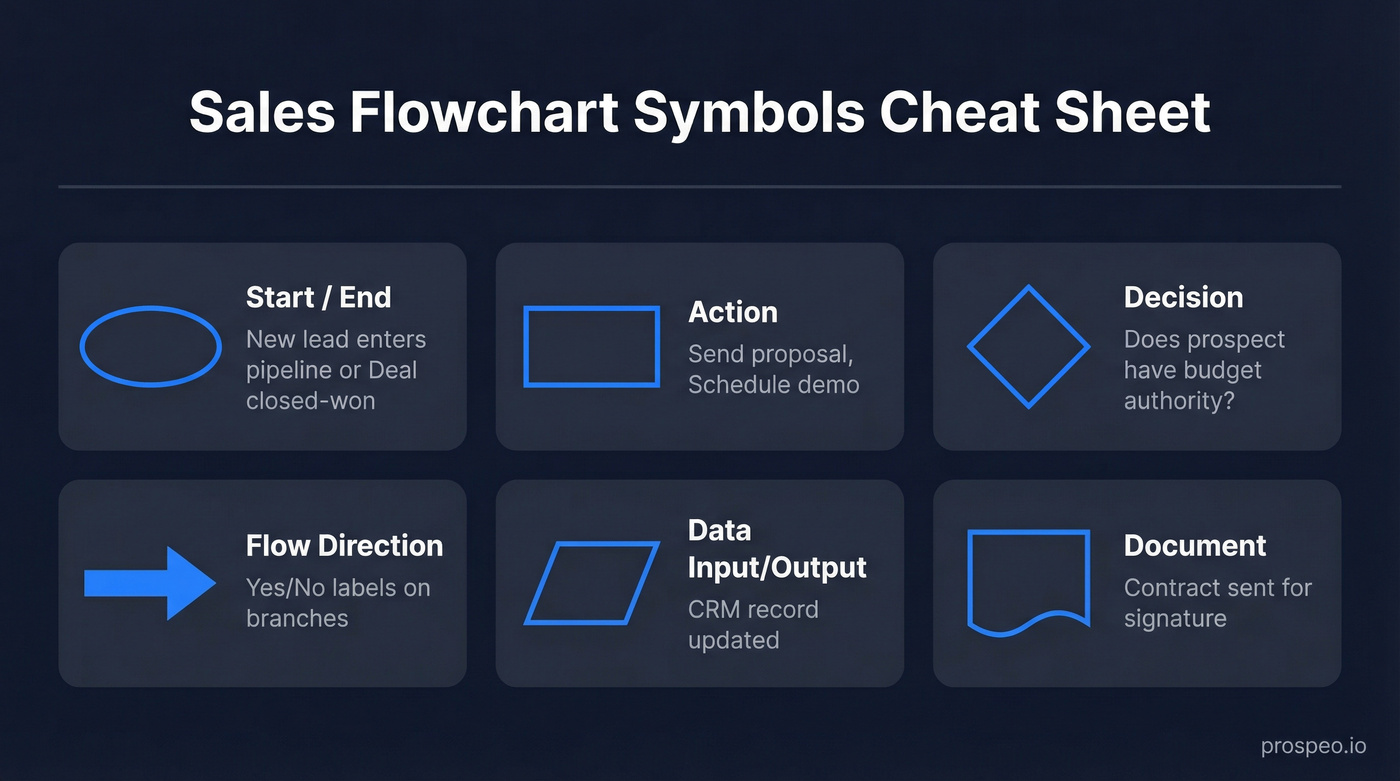
| Symbol | Name | Sales Example |
|---|---|---|
| Oval | Start / End | "New lead enters pipeline" / "Deal closed-won" |
| Rectangle | Action | "Send proposal" |
| Diamond | Decision | "Does prospect have budget authority?" |
| Arrow | Flow direction | Yes/No labels on branches |
| Parallelogram | Data input/output | "CRM record updated" |
| Document | Document | "Contract sent for signature" |
The 7 Stages of a B2B Sales Flowchart
Every guide tells you to "define your stages" but never tells you what conversion rate to expect at each one. That's a recipe without temperatures. Here are seven stages with the decision points, benchmarks, and criteria that actually make a sales process flow useful. The overall B2B close rate averages around 29% with cycles running 1-3 months, so your stage-by-stage numbers should ladder up to something in that range.
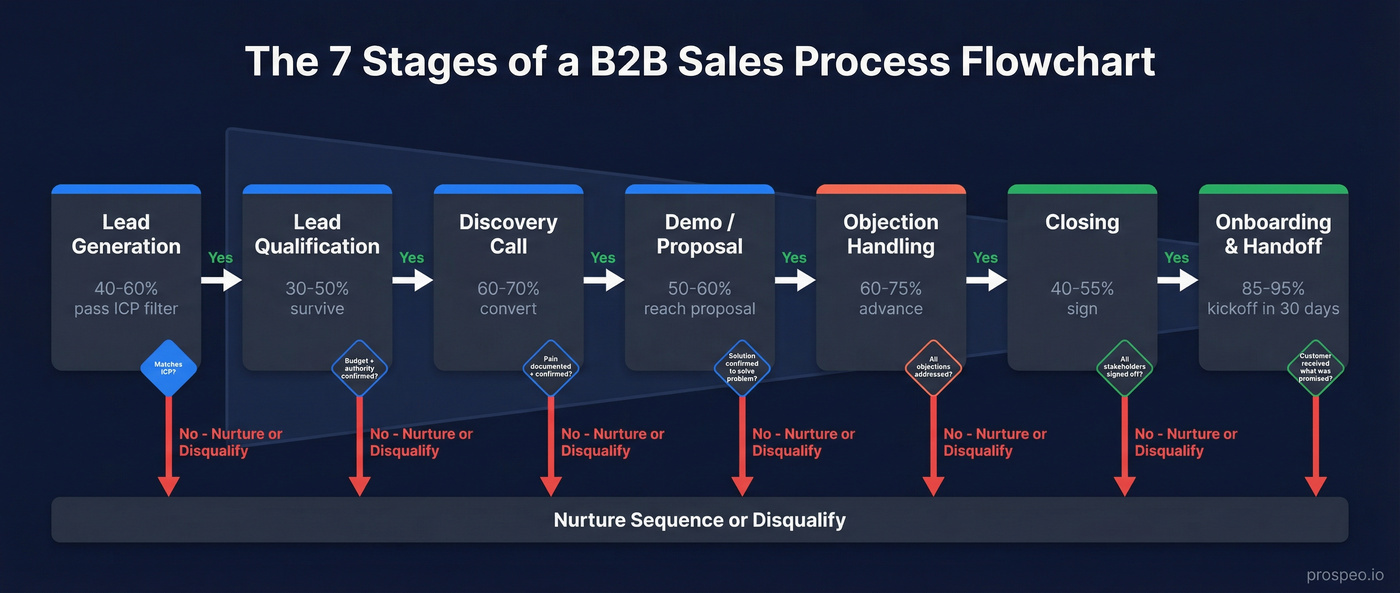
Lead Generation
The quality of your contact data determines whether the rest of the flowchart works. Before your first decision diamond fires, you need accurate emails and phone numbers - otherwise reps burn through stages only to discover contacts bounce. We've seen teams lose entire weeks chasing dead-end data, and it's one of the most frustrating problems in outbound sales because it's entirely preventable.
Prospeo covers 300M+ professional profiles with 98% email accuracy and data refreshed every 7 days, so the leads entering your "Start" oval are real people at real companies. If you're pressure-testing your top-of-funnel inputs, start with data quality and B2B contact data decay.
Benchmark: Expect 40-60% of raw leads to survive initial ICP filtering and enter your pipeline as workable contacts.
The decision point at this stage is simple: does this lead match your ICP criteria - industry, company size, role?
Lead Qualification
This is profit protection. Use BANT for SMB deals, MEDDICC for enterprise, or CHAMP (Challenges, Authority, Money, Prioritization) if you lead with the prospect's challenge. The framework matters less than consistency - pick one and enforce it. If you want a tighter system than “gut feel,” build a simple lead scoring system and align it to your lead qualification framework.
| Criteria | What It Means |
|---|---|
| Entry | Lead matches ICP |
| Exit | Budget, authority, need, and timeline confirmed |
| Timebox | Decision within ~15 days |
| Benchmark | 30-50% of leads survive this stage |
The decision diamond here: does the prospect have budget authority and a confirmed need? If not, route to nurture. Don't let unqualified deals clog your pipeline.
Discovery Call
Discovery isn't a demo. It's where reps map the prospect's pain, stakeholder structure, and decision process. The exit criteria should be a documented pain statement the prospect has confirmed - not just a vague positive impression. For a stronger question set and structure, use these discovery call tips.
Benchmark: 60-70% of qualified leads should convert to a scheduled discovery call. If you're below 50%, your qualification criteria are too loose or your outreach messaging is off.
Pro tip: Record discovery calls (with permission) and review them in coaching sessions. The gap between what reps think they learned and what the prospect actually said is usually enormous.
Can you articulate the prospect's problem better than they can? That's the test for advancing past this stage.
Product Demo / Proposal
Tailor the demo to the pain uncovered in discovery. Generic feature tours kill deals. The proposal/POC phase should complete within ~45 days - if it drags beyond that, escalate to decide whether to proceed or cut losses. Expect 50-60% of discovery-stage deals to reach a formal proposal. If you need a tighter post-demo motion, use a post-demo checklist.
Has the prospect confirmed the solution addresses their stated problem? If they're nodding politely but haven't said "yes, this solves X," you don't have confirmation. You have politeness.
Objection Handling
Price, integration concerns, and doubts about effectiveness are the big three. Arm reps with case studies and ROI calculators, not improvisation. Branch your flowchart here for common objection paths - discount requests, technical review loops, and multi-stakeholder sign-off. This is often the stage where reps freelance the most, so your branching logic needs to be airtight. If you want a clean taxonomy to build branches faster, start with types of objections.
Benchmark: 60-75% of deals that reach objection handling should advance to closing. If you're losing more than 40% here, your demo stage isn't building enough conviction.
Has every stated objection been addressed with evidence? If yes, advance. If the prospect raises new objections after you've addressed the originals, that's actually a buying signal - they're still engaged.
Closing
Define ownership and timing explicitly. An SLA like "legal review within 48 hours of final redlines" turns a vague stage into an accountable one. Map branches for discount requests, senior management escalation, and flexible vs. non-negotiable terms. Expect 40-55% of deals in closing to result in a signed contract.
The final decision point: have all stakeholders signed off and contract terms been agreed? If legal is the bottleneck, your flowchart should include an escalation path with a named owner - not just "waiting on legal."
Onboarding & Handoff
The flowchart doesn't end at "Closed-Won." A clean handoff to customer success - with documented expectations, timeline, and success metrics - protects the revenue you just won. Build in a delivery check: did the customer actually get what was promised?
Benchmark: 85-95% of closed deals should reach a successful kickoff within the first 30 days. If your kickoff rate is below 80%, the gap between what sales promised and what CS delivers is too wide.
Inbound vs. Outbound - Two Entry Points
A single linear flowchart is a lie. Inbound and outbound leads enter your funnel with fundamentally different intent levels, and pretending they follow the same path is how deals fall through cracks.
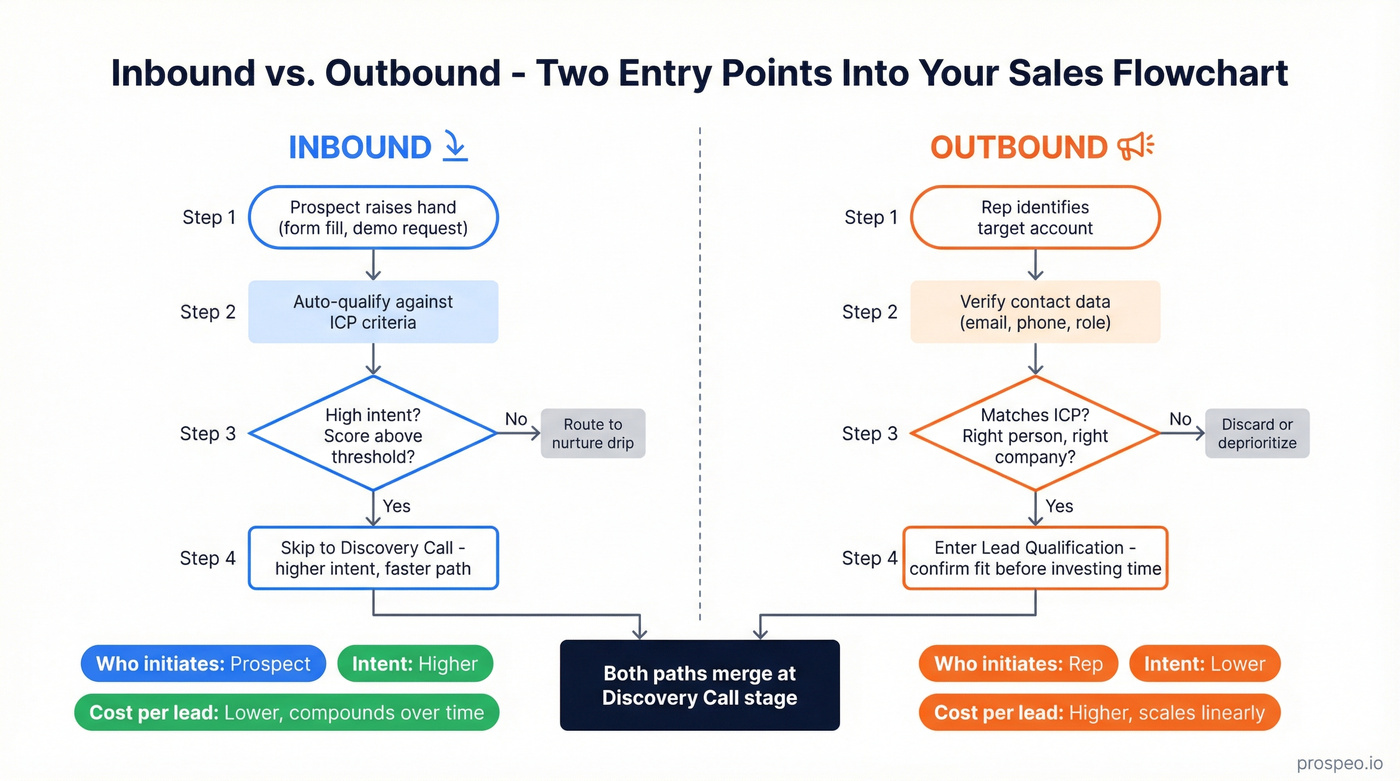
| Dimension | Inbound | Outbound |
|---|---|---|
| Who initiates | Prospect | Rep |
| Intent level | Higher | Lower |
| Cost per lead | Lower (compounds) | Higher (scales linearly) |
| Speed / control | Less control, slower | More control, faster |
| Scalability | Content compounds | Volume + process discipline |
Gartner projected that 80% of B2B interactions would occur in digital channels by 2025 - and that shift has only accelerated into 2026. Your inbound motion is generating more top-of-funnel volume than it did two years ago. But inbound leads arrive on their timeline, not yours. Outbound gives you pipeline velocity and targeting precision at the cost of higher per-lead spend and rejection rates. If you’re still treating them as one motion, map the differences explicitly in your inbound vs outbound sales playbook.
Your process flow needs two "Start" ovals. Inbound enters at a higher-intent qualification stage - they've already raised their hand. Outbound enters at lead generation with different early-stage decision logic focused on confirming fit before investing rep time.
If your average deal size is under $15k, you probably don't need a complex outbound motion at all. Focus your flowchart on inbound conversion and use outbound only for strategic accounts worth the rep time.
Your flowchart's first stage is lead generation - and bad data kills every stage after it. Prospeo delivers 300M+ profiles with 98% email accuracy, refreshed every 7 days, so the leads entering your pipeline are real buyers at real companies.
Fix the top of your funnel and every stage downstream converts higher.
How to Build Your Flowchart Step by Step
- Audit 10-15 won deals. Reverse-engineer your actual process from deals that closed. Don't design the process you wish you had - document the one that's already working. Interview reps about what actually happened, not what the CRM says.
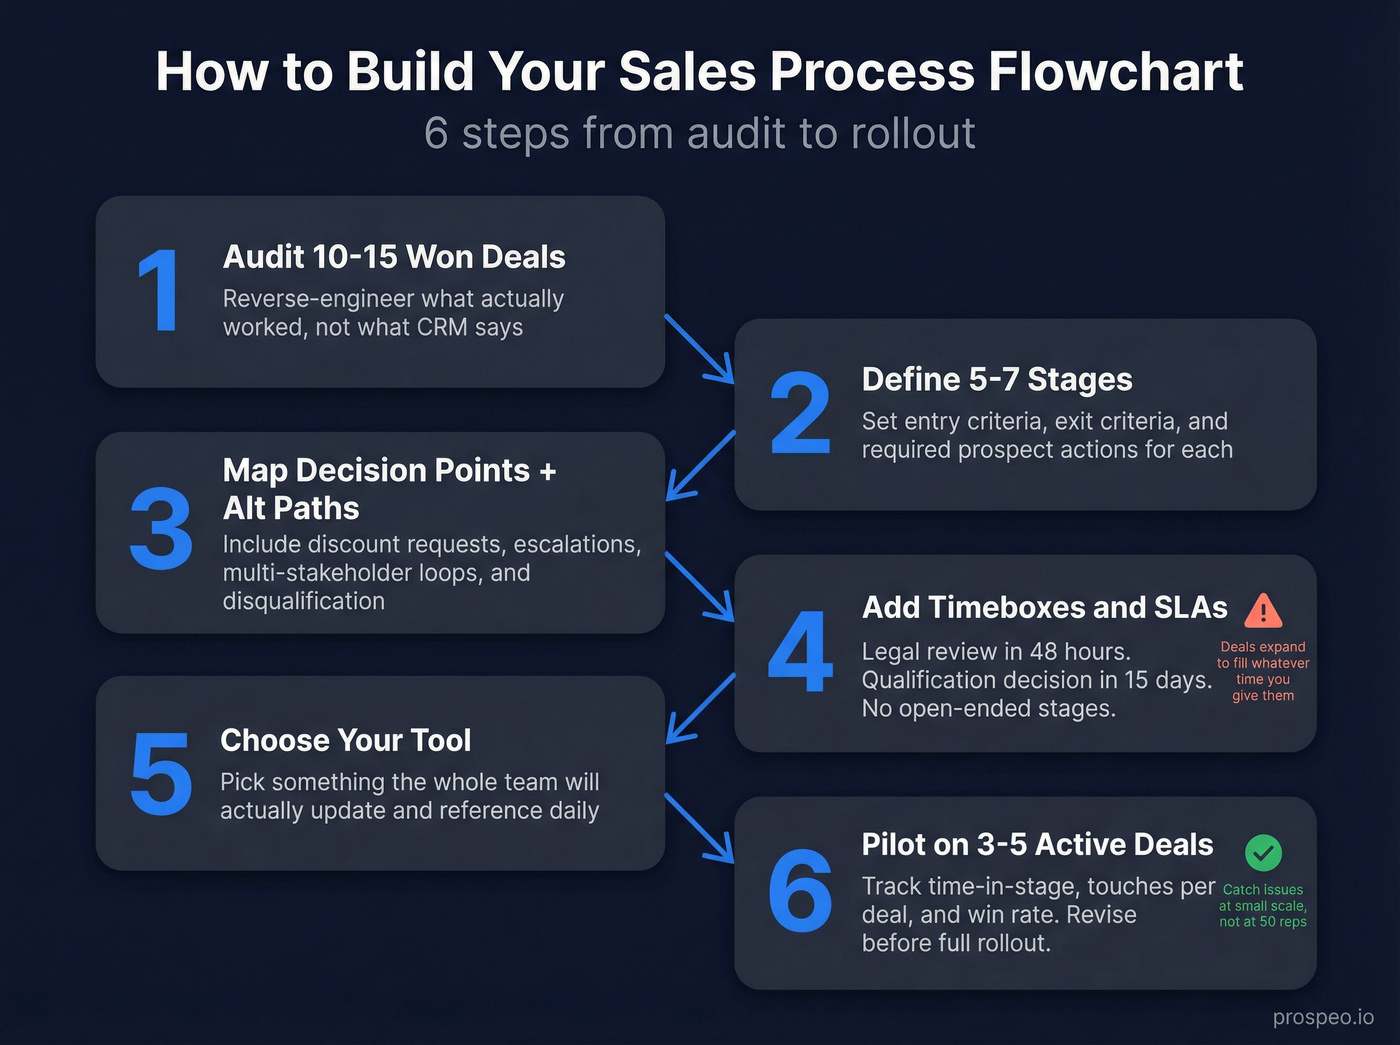
Define 5-7 stages with entry and exit criteria. Each stage needs a clear trigger to enter, a set of activities, and a concrete prospect action required to advance. "Interested" isn't an exit criterion. "Confirmed budget range and decision timeline in writing" is. If you want examples you can copy, pull from these B2B sales process examples.
Map decision points and alternative paths. Every diamond represents a branching moment. Include paths for discount requests, senior management escalation, multi-stakeholder loops, and dead-end disqualification. The alternative paths are where most flowcharts fail - they only map the happy path.
Add timeboxes and SLAs. "Legal review within 48 hours of final redlines." "Qualification decision within 15 days." Without time constraints, deals expand to fill whatever space you give them.
Choose your tool. Pick something your team will actually update. A beautiful Visio diagram that lives on one person's desktop is worse than a shared Google Drawing everyone can edit.
Pilot on 3-5 active deals. Track time-in-stage, touches per deal, and win rate changes during the pilot. Identify where reps get confused, where decision points are missing, and where they take shortcuts. The pilot phase catches the issues you'd otherwise discover at scale - revise before rolling out to the full team.
Best Diagramming Tools
The tool matters less than the process inside it. That said, here's what's worth your time in 2026.
| Tool | Best For | Key Feature | Pricing |
|---|---|---|---|
| Miro | Collaborative teams | Infinite canvas, facilitation features, Miro AI | Free tier; ~$8-20/user/mo paid |
| Lucidchart | Template-heavy builds | 700+ templates, BPMN 2.0, Visio import/export | Free tier; ~$8-20/user/mo paid |
| SmartDraw | Quick auto-formatted charts | Auto-formatting engine | ~$10-20/user/mo |
| Visio | Microsoft-heavy orgs | Live data linking, Microsoft 365 integration | ~$5-15/user/mo |
| Google Drawings | Zero-budget teams | Free with Workspace | Free |
| Whimsical | Clean, minimal diagrams | Simple UI, fast | Free tier; ~$10-20/user/mo |
Miro is the default for teams that want to workshop the flowchart collaboratively - the infinite canvas and facilitation features (timers, voting, private mode) make it ideal for building the chart as a team exercise rather than a top-down decree. Lucidchart wins if you want structured templates and Visio import/export. SmartDraw auto-formats everything, which saves time but limits customization. For tool selection, prioritize easy sharing, fast updates, CRM integrations, and version control. If you need a quick reference for standard notation, see Sales Flowchart Symbols.
Skip Visio unless your org already lives in Microsoft 365. The live data linking to Excel or SQL is genuinely useful for dynamic dashboards, but if you're not already in that ecosystem, the learning curve isn't worth it.
5 Mistakes That Kill Your Flowchart
1. Leaving steps open to interpretation. "Qualify the lead" means something different to every rep. Define concrete prospect actions required to advance - "prospect confirms budget range and decision timeline in writing" leaves no room for creative interpretation.
2. Treating it as "one and done." A flowchart built in January and never revisited is a museum piece. Review metrics monthly. Revise the structure quarterly. Your market, product, and team change - your process should too.
3. No coaching program. Look, the diagram isn't the process. Coaching is how you manage the process. Without regular deal reviews tied to the flowchart's decision points, reps default to whatever worked at their last company. The consensus on r/sales is pretty clear on this: most process rollouts fail not because the chart was bad, but because nobody coached to it. The chart was built by someone who never carried a quota, and reps ignore it. If you need a system to operationalize this, start with sales coaching best practices.
4. Overcomplicating it. We've seen teams build 47-step flowcharts with 12 decision points. One team reduced that to 12 key decision points and their average sales cycle dropped by 40%. Complexity isn't rigor - it's friction. If you need a sample diagram to calibrate the right level of detail, start with the seven-stage framework above and strip out anything your reps can't act on.
5. Ignoring data quality at the top of the funnel. The biggest flowchart mistake nobody talks about: if 35% of your emails bounce, your lead generation stage is broken before it starts. Snyk cut bounce rates from 35-40% to under 5% after switching to Prospeo, which meant every downstream stage in their flowchart ran on real contacts instead of dead ends. If bounce rates are a recurring issue, fix the root cause with an email checker tool workflow.
Rolling Out to Your Team
You built a beautiful 30-step Miro flowchart. Two weeks later, reps are skipping stages and logging deals wherever feels right. Sound familiar?
Adoption is the hardest part. Start with a pilot - 3-5 active deals, tracked closely. Measure time-in-stage, touches per deal, approval response times, win rate changes, and deal velocity. Hold a debrief after the pilot and revise before going wide. Let's be honest: test with your least tech-savvy team member. If they can't update the chart, nobody will.
Once you roll out, commit to monthly metric reviews and quarterly structural reviews. Look for patterns: if deals consistently stall at the same decision point for three months, that's a signal to redesign that stage, not just coach harder. Build feedback loops - reps on the front line spot broken branches faster than any dashboard.
A well-built sales process flowchart isn't a one-time artifact. It's a living system that evolves with your team, your market, and your data. Get the decision criteria right, keep the stages tight, and feed it with verified contacts - the revenue follows.
A sales process flowchart with tight qualification criteria still fails when reps can't reach prospects. Prospeo gives your team verified emails at $0.01 each and 125M+ direct dials - so every diamond in your flowchart fires on real conversations, not bounced emails.
Stop losing deals before your first decision diamond even triggers.
FAQ
What is a sales process flowchart?
It's a visual diagram mapping every stage a deal moves through - from first contact to closed-won - using standard symbols like rectangles for actions, diamonds for decisions, and arrows for flow direction. It turns an informal "how we sell" into a documented, repeatable system with clear criteria for advancing or disqualifying deals at each stage.
How is a sales process different from a sales methodology?
A process is the sequence of stages a deal moves through - your flowchart. A methodology is the approach reps use within those stages: BANT, MEDDICC, SPIN, Challenger. You need both. The process defines where a deal is; the methodology defines how reps operate at each stage.
How many stages should a sales flowchart have?
Five to seven is the sweet spot for most B2B teams. Fewer than five and you lose diagnostic visibility into where deals stall. More than seven and reps start skipping stages or logging deals inconsistently. Start with seven, then simplify after your first pilot.
How often should I update my flowchart?
Review metrics monthly - time-in-stage, conversion rates, deal velocity. Revise the structure quarterly or whenever deals stall at the same decision point for three months straight. A static flowchart is a a dead flowchart.
What's the best way to ensure data quality at the top of the funnel?
Use a verified data provider before leads enter your pipeline. A 7-day refresh cycle (compared to the 6-week industry average) means your contact records stay current and reps aren't wasting time on outdated information. Teams that fix data quality at the top consistently see improvements cascade through every downstream stage.