Sales Prospecting Metrics: The 2026 Benchmarks Your Dashboard Is Missing
Your team logged 4,000 activities last week. Pipeline didn't move. The VP wants to know why reps are "busy but not productive," and your dashboard - packed with dials, emails sent, and open rates - doesn't have an answer.
A rep who converts 30% of conversations into meetings is worth three reps converting at 12%, no matter how many calls they make. Picture two SDRs sitting side by side: one hammers out 80 calls and books 3 meetings; the other makes 30 calls and books the same 3. Your activity dashboard says the first rep is outperforming. Your pipeline says otherwise. Activity without effectiveness context is a vanity metric, and most prospecting dashboards are built on exactly that.
The sales prospecting metrics that actually matter tell a different story.
The Five That Matter Most
If you only track five prospecting metrics, make it these:
- Connect rate: 8-12% is healthy. Below 5% means your data is broken, not your reps.
- Meeting show rate: Target ~80%. If 20-30% of booked meetings no-show, your "meetings booked" number is lying to you.
- Meeting-to-opportunity ratio: ~50% is the benchmark. Worse than 1:5 means qualification is too loose.
- Bounce rate: Keep it under 2%. Anything higher and you're burning domain reputation with every send.
Here's the thing most teams get wrong: they track too many metrics and ignore the one category that sits upstream of everything else - data quality.
The Only Framework You Need
Prospecting metrics aren't a flat list. They're a causal chain, and diagnosing problems means understanding which link is broken.
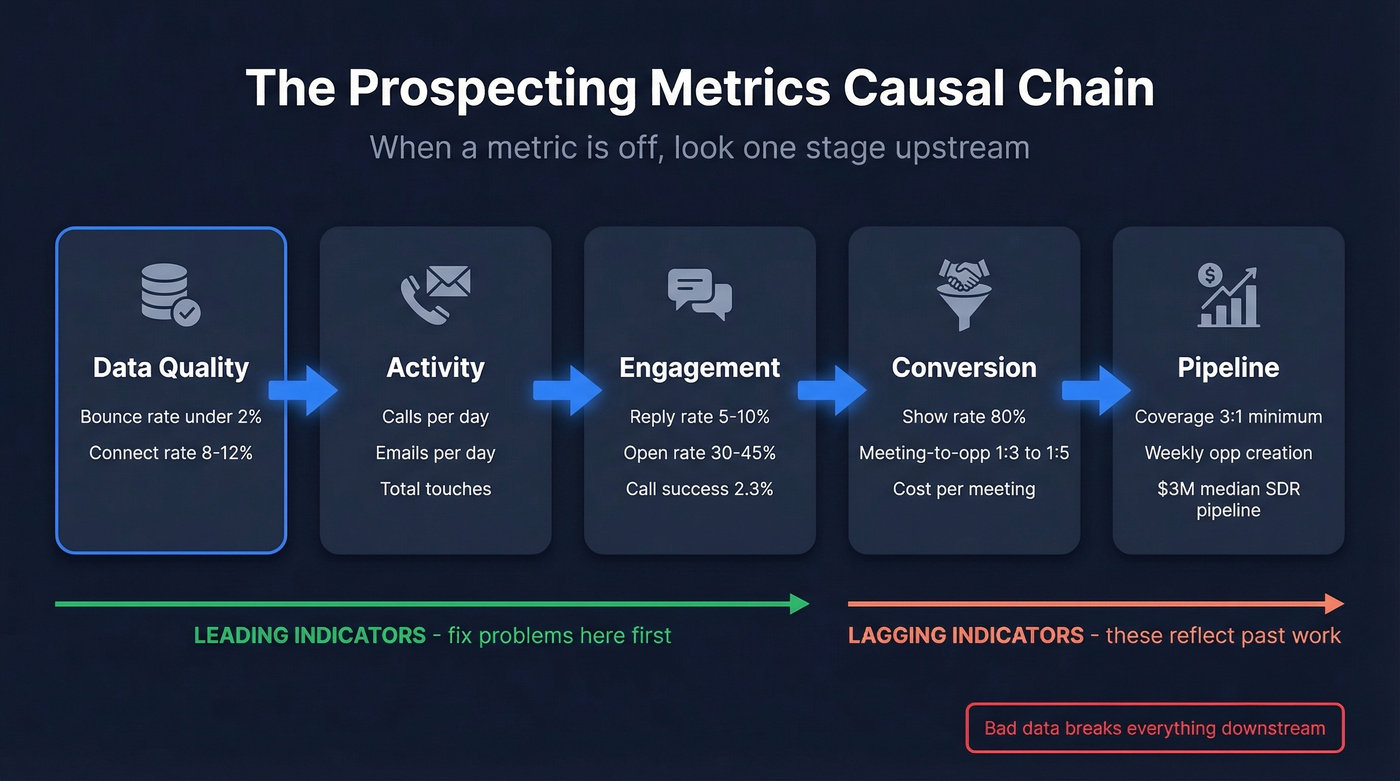
Think of it as five stages, each feeding the next: Data Quality -> Activity -> Engagement -> Conversion -> Pipeline. Bad data produces wasted activity. Wasted activity produces low engagement. Low engagement means fewer conversions. Fewer conversions starve your pipeline.
The critical distinction is leading versus lagging. Pipeline coverage is lagging - it reflects work already done weeks ago. Weekly opportunity creation is the real leading indicator, because it predicts pipeline 4-8 weeks out. If you're only reviewing pipeline at month-end, you're driving by looking in the rearview mirror.
Every section below maps to one of these five stages. When a metric is off, the framework tells you where to look first: the problem is almost always one stage upstream.
Data Quality Metrics
Everyone ignores this category, and it determines whether everything downstream works.
Bounce rate should stay under 2%. Above that threshold, you're risking domain blacklisting with every campaign. About 17% of cold emails are blocked or land in spam as it is - a high bounce rate makes that worse. If your bounce rate is above 5%, stop sending and fix your list before you do permanent damage to your sender reputation. (If you need a deeper breakdown, see bounce rate benchmarks and fixes.)
Bounce rate = (bounced emails / total emails sent) x 100
Connect rate is the canary in the coal mine. A healthy range is 8-12%. Below 5% isn't a coaching problem - it's a data problem. Your reps are dialing disconnected numbers and emailing addresses that don't exist.
Connect rate = (live conversations / total dial attempts) x 100
A thread on r/SalesOperations captured the question a lot of teams are asking: if you're running a ~6% connect rate, is 15-20% even realistic anymore? The answer depends entirely on data freshness. Meritt was running a 35% bounce rate and connect rates in the single digits. After switching to verified data with a 7-day refresh cycle, bounce dropped under 4% and connect rate tripled to 20-25%. Pipeline went from $100K to $300K per week.
Prospeo delivers 98% email accuracy through a 5-step verification process, and every record refreshes every 7 days - versus a 6-week industry average. If your connect rate is below 5%, swap in verified contacts and your bounce rate drops before you change a single script or sequence. For more options, compare data enrichment services and sales prospecting databases.
Activity Metrics That Actually Tell You Something
Activity metrics get a bad reputation because managers misuse them. Requiring 50 calls and 50 emails per day sounds disciplined, but it creates a culture of logged activity with little effectiveness. We've tested this across dozens of teams - the rep with fewer but better conversations wins every time.
| Metric | Top Quartile | Median | Bottom Quartile |
|---|---|---|---|
| Calls/day | 70-80 | 50-60 | 30-40 |
| Emails/day | 45-55 | 30-40 | 15-25 |
| Social touches/day | 25-35 | 15-20 | 5-10 |
| Total activities/day | 140-170 | 95-120 | 50-75 |
Cadence benchmarks have shifted too. Reps now average 21 attempts per contact across a 53-day cadence - up from 17 in prior benchmarks. Teams are also reaching out to ~9 contacts per account, up from 6.4. The market is noisier, which means each touch needs to be sharper. (If you want more ideas beyond volume, use these sales prospecting techniques.)
If your team is in the bottom quartile on activity AND bottom quartile on conversion, you've got two problems. Fix data quality first. It's faster. You can also standardize what counts as real work with sales activities examples.
Your dashboard says bounce rate is the problem. Prospeo fixes it at the source. 98% email accuracy, 5-step verification, and a 7-day refresh cycle mean every metric downstream - connect rate, reply rate, show rate - improves before you touch a single sequence.
Meritt tripled pipeline to $300K/week after switching. Your move.
Engagement Benchmarks by Channel
This is where benchmarks get channel-specific.
Cold Email
The average cold email reply rate is 5.8% across 16.5M emails - down from 6.8% in 2023. The bar keeps rising. Here's how to tier your performance against 10,000+ B2B campaigns:
| Metric | Minimum | Good | Exceptional |
|---|---|---|---|
| Open rate | 30% | 35-45% | 45%+ |
| Response rate | 5% | 8-10% | 10%+ |
| Meeting booked rate | 2% | 3-4% | 5%+ |
| Opportunity rate | 0.5% | 1-2% | 2%+ |
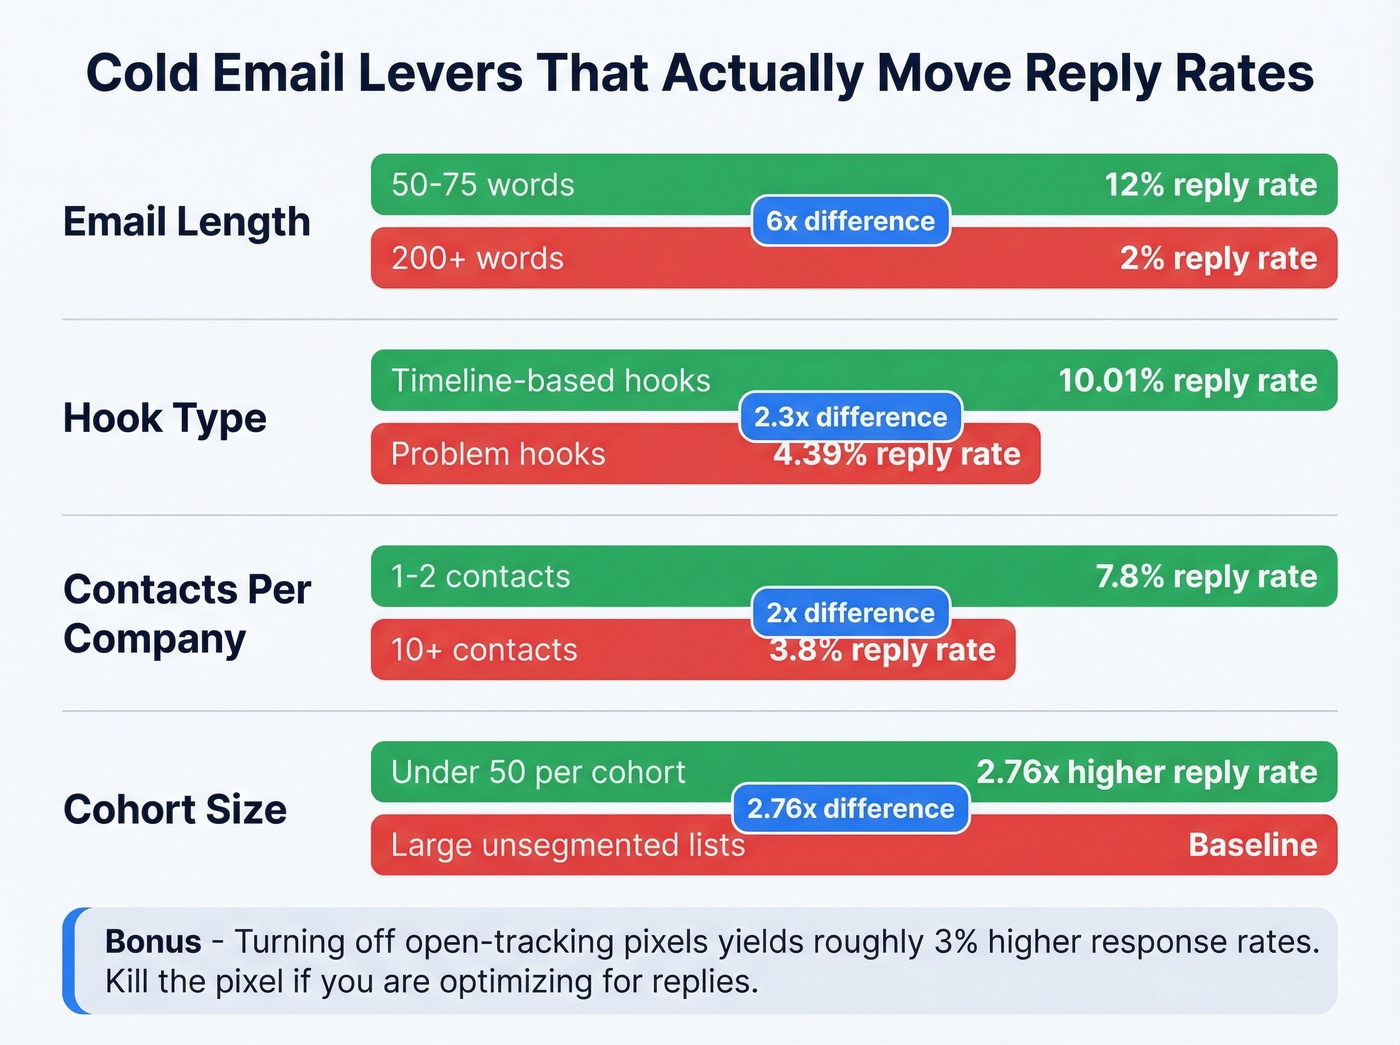
Several levers move the needle fast. Email length is the biggest: 50-75 words pulls a 12% response rate, while 200+ words drops to 2%. Hook type matters enormously - timeline-based hooks hit 10.01% reply rates versus 4.39% for problem hooks. That's a 2.3x gap from a single copywriting decision.
Sequence structure matters more than most teams realize. One-email sequences actually pull an 8.4% reply rate - higher than multi-step sequences - because they force you to make every word count. And here's a counterintuitive one: contacting just 1-2 people per company yields a 7.8% reply rate versus 3.8% when you contact 10+ people at the same org. Buyers talk to each other. When three people in the same department get your cold email, you look desperate, not strategic. Keep your contact lists segmented into cohorts of 50 or fewer - that alone increases reply rates by 2.76x. If you want a tighter structure, build a B2B cold email sequence and pull from proven cold email follow-up templates.
One more tactical win: turning off open-tracking pixels yields roughly 3% higher response rates. Email clients increasingly flag tracked emails, and savvy buyers notice. If you're optimizing for replies over opens (and you should be), kill the pixel. (More detail: email tracking pixels.)
Open rates sit around 27.7%, but with Apple Mail Privacy Protection and pixel-blocking becoming standard, open rate is increasingly unreliable. Response rate is the engagement number you can trust.
Cold Calling
Cold calling success rates have dropped hard - 2.3% average as of late 2025, down from 4.82% the year prior. But here's the nuance that raw success rates miss: once you actually get someone on the phone, the conversation success rate is 65.6%. The problem isn't the pitch. It's reaching people.
It takes an average of 8 dial attempts to reach a prospect. Best timing is Tuesdays, with peak windows at 10-11am and 2-3pm. Despite the declining success rates, 49% of buyers still prefer to be contacted via cold call - that number jumps to 57% for C-level and VP buyers. If your team needs a repeatable motion, build a cold calling system.
The cost difference is stark: cold email runs $30-50 per lead, while cold calling runs $300-500. That's a 10x gap in unit economics.
Multi-Channel Lift
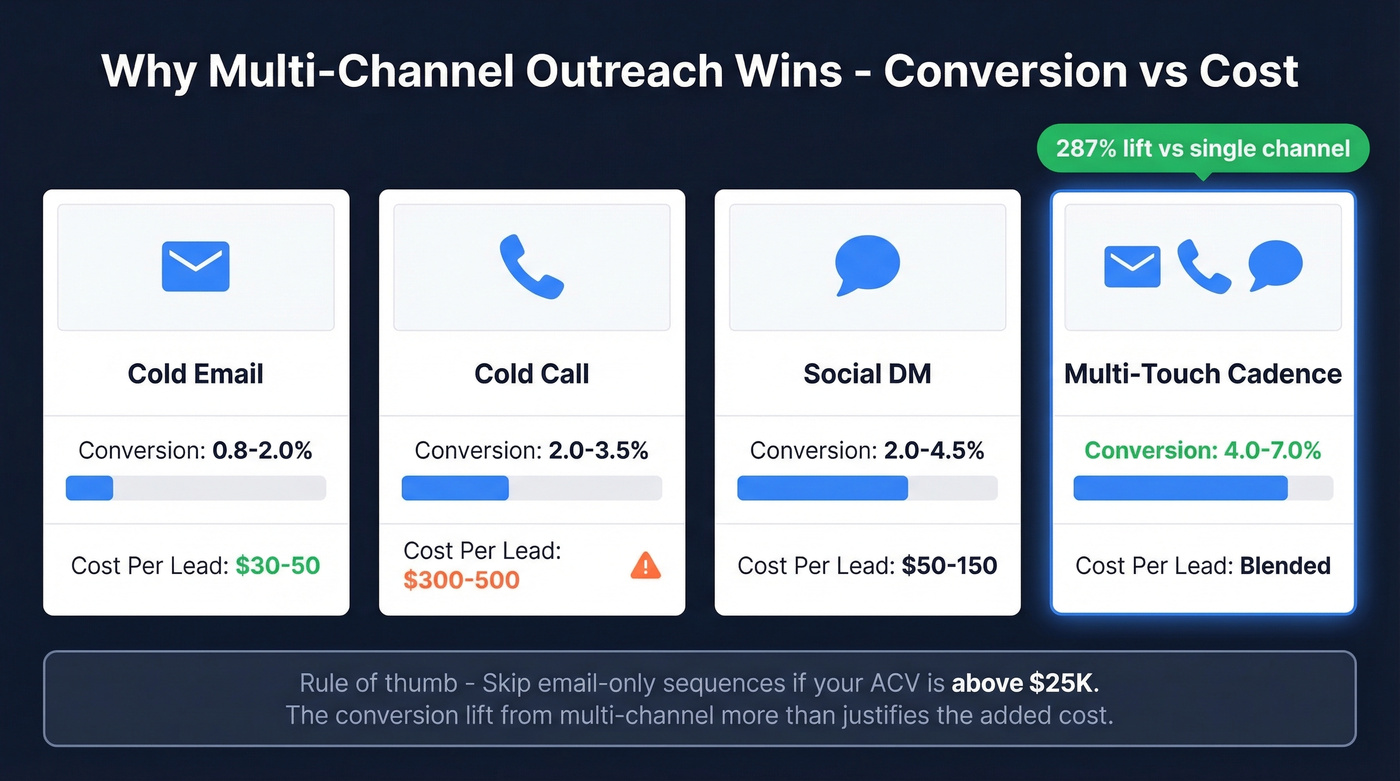
Single-channel outreach is leaving meetings on the table. Multi-touch cadences convert at 4.0-7.0% - 2-3x higher than any single channel alone. The combined effect of email, phone, and social touches lifts response rates by 287% versus single-channel approaches.
| Channel | Avg Conversion | Cost Per Lead |
|---|---|---|
| Cold email | 0.8-2.0% | $30-50 |
| Cold call | 2.0-3.5% | $300-500 |
| Social DM | 2.0-4.5% | ~$50-150 |
| Multi-touch cadence | 4.0-7.0% | Blended |
Skip email-only sequences if your ACV is above $25K. At that deal size, the conversion lift from multi-channel outreach more than justifies the added cost per lead.
Conversion Metrics: Meeting to Pipeline
Engagement gets you meetings. Conversion metrics tell you whether those meetings are worth anything.
Meeting Show Rate
Target an 80% show rate. We've seen teams celebrate hitting meeting targets while pipeline stays flat - the culprit is no-shows that nobody's tracking.
Meeting show rate = (meetings attended / meetings booked) x 100
Keep no-shows under 15% with same-day confirmation emails, calendar reminders, and a quick "looking forward to our call" message 30 minutes before. Simple stuff, but it works.
Meetings Per Month by Tier
| Performance Tier | Meetings/Month |
|---|---|
| Elite (top 10%) | 18+ |
| Top quartile | 12-15 |
| Median | 8-10 |
| Bottom quartile | 4-6 |
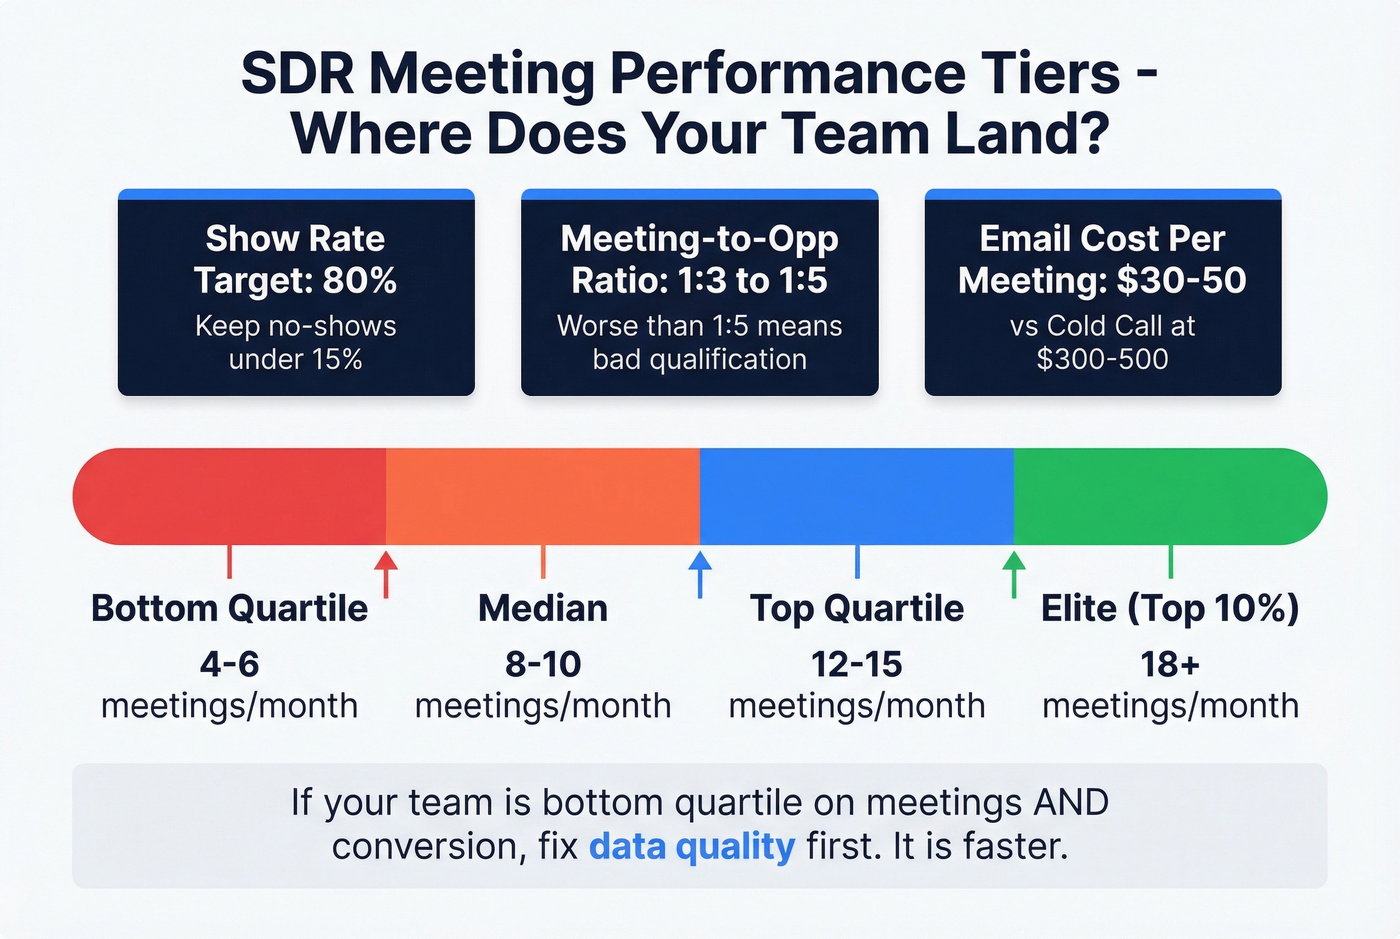
The meeting-to-opportunity ratio should run between 1:3 and 1:5 - meaning one qualified opportunity for every 3-5 meetings. If you want a more formal qualification lens, use MEDDIC sales qualification.
Meeting-to-opportunity ratio = qualified opportunities / total meetings held
Worse than 1:5? Your SDRs are booking meetings with the wrong people. That's a qualification problem, not a volume problem.
Cost Per Meeting by Channel
Cold email's $30-50 cost per lead versus cold calling's $300-500 should drive resource allocation.
Cost per meeting = total channel spend / meetings booked from that channel
If your team is dialing 200 calls a day to book 4 meetings at $400 each, and a parallel email campaign books 3 meetings at $40 each, the email channel is delivering 10x better unit economics. This doesn't mean you drop calling - it means you use calling strategically for high-value accounts, warm follow-ups, and the 57% of C-suite buyers who prefer phone. Let email handle the volume plays.
Pipeline & Revenue Metrics
Everything above feeds into the metrics your CFO actually cares about.
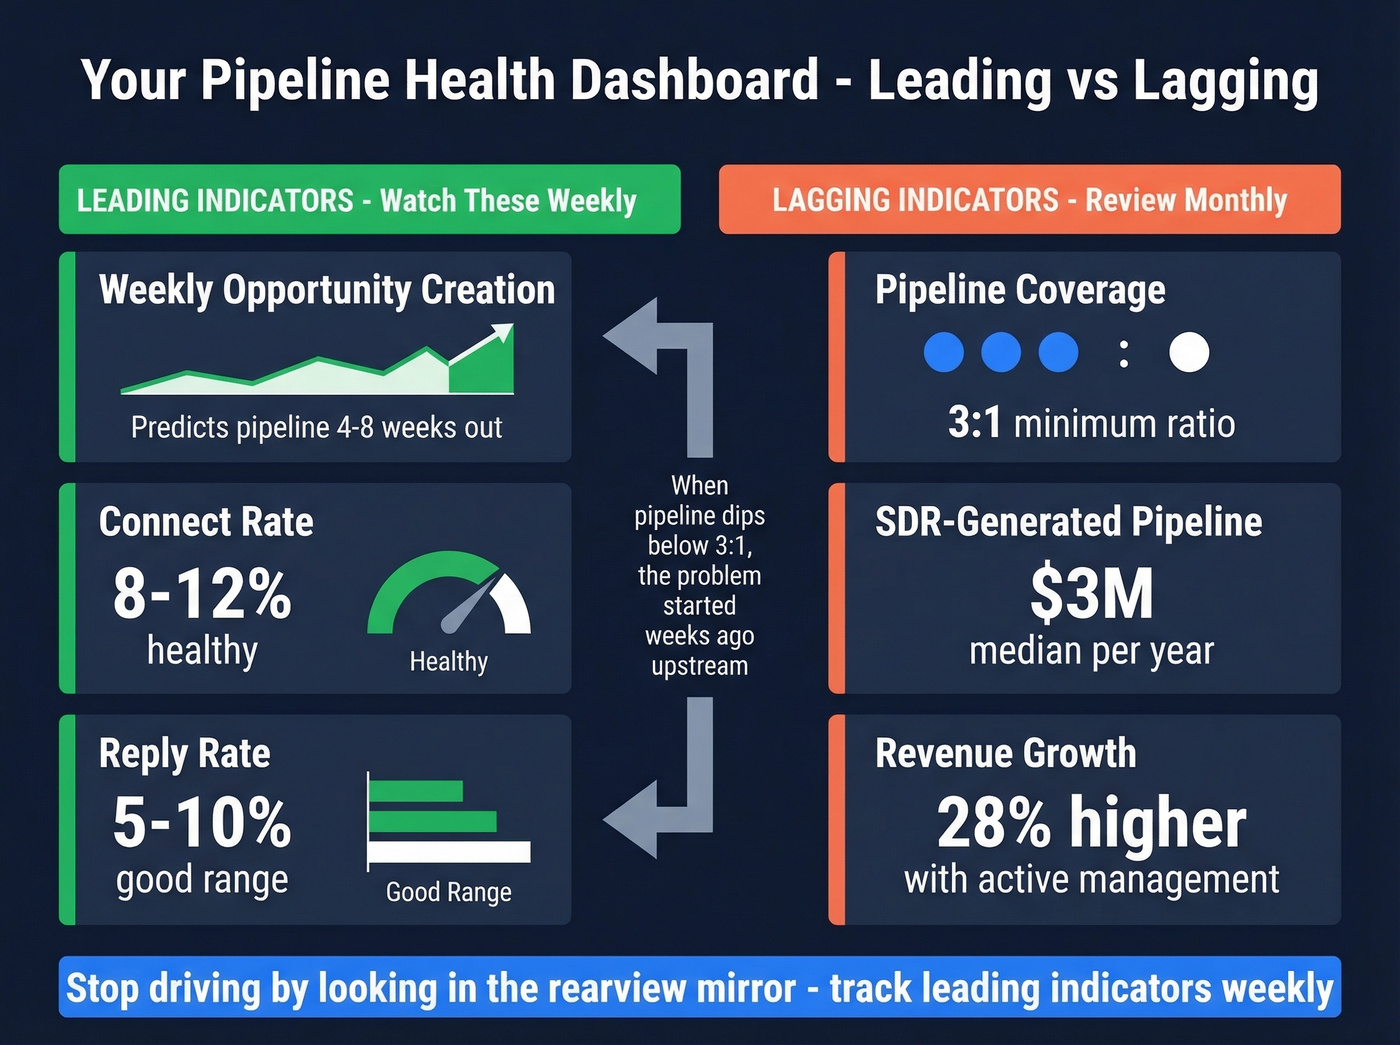
Pipeline coverage should run at a minimum 3:1 ratio - three dollars in pipeline for every dollar of quota. Teams with actively managed pipelines see 28% more revenue growth year-over-year. The median SDR-generated pipeline sits around $3M per year, which gives you a baseline for headcount planning. If you want a tighter set of revenue predictors, track pipeline health alongside sales pipeline benchmarks.
But remember the framework: pipeline is lagging. By the time pipeline coverage dips below 3:1, the problem started weeks ago in your activity and engagement metrics. The leading indicator is weekly opportunity creation. Two consecutive weeks of decline? Something upstream is broken - diagnose it before it shows up in the pipeline number.
The single number that captures funnel speed:
Pipeline velocity = (Number of opportunities x average deal value x win rate) / average sales cycle length
Track it monthly and you'll spot slowdowns before they hit quota attainment.
Let's be honest: if your average deal size is under $10K, you probably don't need a 40-metric dashboard or an enterprise data platform. You need clean contact data, a tight 3-channel cadence, and five metrics reviewed weekly. Overcomplicating your measurement stack is just another way to avoid the hard work of actually prospecting well. Reps spend only 28% of their time actually selling - the rest goes to admin, CRM updates, and internal meetings. Sometimes the fix isn't better prospecting. It's giving reps their time back.
Reverse-Engineering Your Prospecting Goals
Let's work backward from a revenue target to daily activity, because connect rate is the highest-leverage variable in your entire model.
Say you need $10M in new business this year. At a 5% connect rate, that requires roughly 500,000 dials annually. At 15% connect rate, it's 167,000. Same revenue target, one-third the dials.
| Connect Rate | Annual Dials | Meetings Booked |
|---|---|---|
| 5% | 500,000 | ~1,375 |
| 10% | 250,000 | ~2,400 |
| 15% | 167,000 | ~3,600 |
Look at that table. At 15% connect rate, you book nearly 3x the meetings from one-third the dials. Connect rate isn't just a metric - it's the constraint that determines whether your revenue plan is achievable with your current headcount. The fastest way to improve it isn't more training. It's better data. When reps aren't burning dials on dead numbers or bouncing emails off abandoned inboxes, the math changes completely.
New reps won't hit these numbers on day one. Expect a ramp timeline of 20-30% of quota in month one, 40-60% in month two, and 70-90% by month three, with full productivity by month four. Build your capacity model with ramp baked in, or you'll over-hire and under-deliver. (If you need a ramp template, use a 30-60-90 day plan for sales reps.)
Bottom-quartile activity with bottom-quartile conversion means your reps are burning hours on dead data. Prospeo gives you 300M+ verified profiles with 30+ filters - buyer intent, job changes, headcount growth - so every dial and every send hits a real person.
Stop measuring activity. Start measuring accuracy at $0.01 per email.
Building Your Dashboard
You don't need 40 metrics on a dashboard. You need the right sales prospecting metrics at the right cadence - and the right person looking at each one.
Weekly review (SDR managers): Activity volume, engagement rates (reply rate, connect rate), and data quality (bounce rate, invalid number rate). These are your early warning system. If connect rate drops below 5% or bounce rate spikes above 2%, stop and fix the data before the problem compounds.
Monthly review (directors, RevOps): Conversion rates (conversation-to-meeting, meeting-to-opportunity), pipeline contribution per rep, and meetings booked versus show rate. Compare reps against each other and against the quartile benchmarks above. A rep booking 12 meetings but showing a 1:7 meeting-to-opportunity ratio needs qualification coaching, not more activity.
Quarterly review (VP Sales, CRO): Unit economics - cost per meeting by channel, customer acquisition cost, and pipeline velocity. This is where you make channel mix and headcount decisions. (Related: cost to acquire customer.)
The diagnostic decision tree is simple: if pipeline is soft, check conversion rates. If conversion rates are fine, check engagement. If engagement is fine, check activity. If activity is fine, check data quality. Every prospecting problem traces back to one of these five stages. Track them in your CRM - Salesforce, HubSpot, or whatever you're running - and pipe engagement data from Outreach or Salesloft for the full picture.
FAQ
What are prospecting metrics vs. general sales metrics?
Sales metrics span the full funnel - win rate, lifetime value, churn, average deal size. Prospecting metrics focus specifically on top-of-funnel activity: dials, emails, replies, meetings, and conversions between first touch and qualified opportunity. They're a subset, not a synonym.
How often should I review these numbers?
Review activity and engagement metrics weekly - they're your leading indicators. Evaluate conversion rates and pipeline contribution monthly. Assess unit economics like cost-per-meeting and CAC quarterly, when you have enough volume to make the numbers statistically meaningful.
What's a good connect rate for cold calling in 2026?
8-12% is healthy for most B2B teams. Below 5% signals a data quality problem - bad phone numbers or outdated records - not a coaching issue. Rates of 15-20% are achievable with data that's verified and refreshed on a weekly cycle, not pulled from a months-old export.
How many meetings should an SDR book per month?
Median is 8-10 meetings per month. Top quartile hits 12-15, and elite performers in the top 10% book 18+. If your team is below median, diagnose whether the bottleneck is activity volume, engagement quality, or upstream data accuracy before defaulting to "make more calls."
Is pipeline coverage a leading or lagging indicator?
Lagging. It reflects work already completed weeks ago. The real leading indicators are weekly opportunity creation rate and qualified meeting volume. These predict where your pipeline will be 4-8 weeks out and give you time to course-correct before quota is at risk.