Answer Rate Explained: Definitions, Benchmarks, and Fixes (2026)
$15k/month in outbound spend and your answer rate is 9%... but reps swear nobody's picking up. Then you look closer and realize half those "answers" are voicemail, Live Voicemail, or 6-second hangups.
Answer rate is one of those metrics that sounds obvious until you try to run it across a dialer, a carrier report, and a CRM without everyone quietly using their own definition.
Here's the thing: if you don't lock the definition, you'll "improve" the number and still miss pipeline.
What answer rate means (and why it's misleading)
Answer rate is a vanity metric until you define what "answered" means.
Most teams treat it like a single number that tells you whether calling works. It doesn't. It tells you whether your measurement system is consistent.
Inbound and outbound also mean totally different things:
- Inbound answer rate is about coverage and customer experience. If you're staffed, "eventual answer" should be close to 100% during open hours. The real operational levers are service level, ASA, AHT, and abandonment.
- Outbound answer rate is about reachability and trust. It's heavily influenced by list quality, caller ID reputation, timing, and whether you're dialing direct dials or main lines.
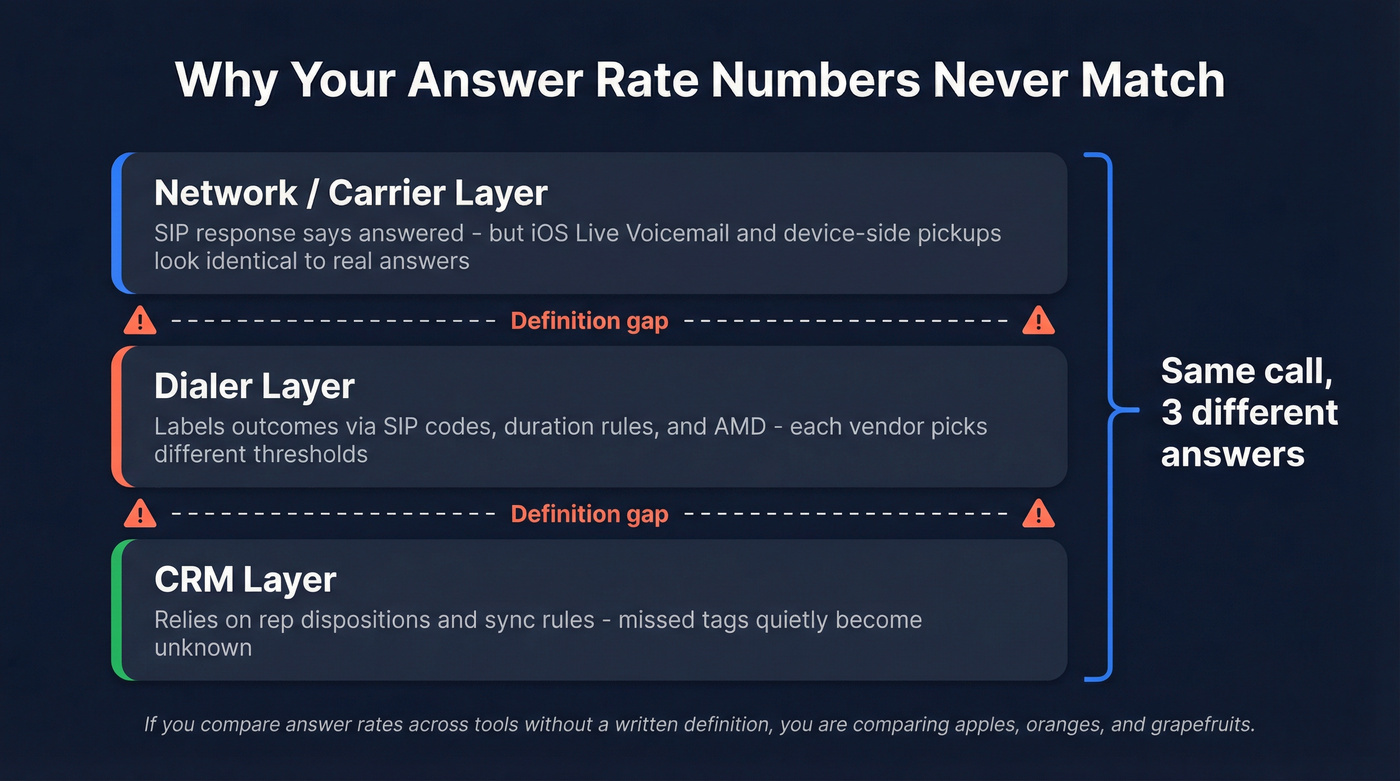
The real problem is that "answered" gets defined at three different layers, and they rarely match:
- Network/reporting layer: some "answered" events get triggered by device-side behavior (like iOS Live Voicemail) that looks identical to a human pickup in reporting.
- Dialer layer: your dialer labels outcomes based on SIP responses, dispositions, and duration rules.
- CRM layer: your CRM relies on rep dispositions, tags, or sync rules. Miss a disposition, and your "answered" calls quietly become "unknown."
That's why vendors don't agree. Some count voicemail as answered. Some count anything over a duration threshold. Some count Live Voicemail as a human answer because, in reporting, it can look like an answer event.
If you're comparing answer rate across teams, tools, or quarters without a written definition, you're comparing apples, oranges, and a few grapefruits.
What you need (quick version)
- Define "answered" in writing. Decide whether it means:
- live human picked up
- voicemail (carrier or device) counts
- a minimum duration threshold (ex: >15s, >30s)
- Pick your denominator. "Pickups ÷ total dials" is common for outbound. In inbound, "answered ÷ total inbound/offered" often includes missed, abandoned, short abandoned, and voicemail depending on the platform.
- Use benchmarks correctly. Gong's benchmark across 300M+ calls: 5.4% average connect rate and 13.3% top quartile. That's connect rate (answered by a prospect) ÷ total dials, not "meetings booked ÷ dials."
- Fix measurement distortions first. iOS Live Voicemail can look like a human answer in reporting. Also, different tools sneak different outcomes into "total calls."
- Improve with the right levers.
- Outbound: data quality + caller trust + cadence/timing.
- Inbound: staffing + service level/ASA + abandonment control (and callback options).
Answer rate formulas (inbound vs outbound)
You can't improve what you can't measure, and you can't measure what you can't define.
Here are the formulas you'll actually use, including the standard version most teams start with.
Outbound (basic): Answer Rate (%) = (Answered Calls ÷ Total Dials) × 100
Inbound (basic): Answer Rate (%) = (Answered by Agent ÷ Total Inbound/Offered) × 100
Two notes that save you from bad dashboards:
- Inbound "total inbound" vs "offered" isn't universal. Some platforms treat voicemail, abandons, and missed calls differently. If you don't know what's inside the denominator, the metric's fiction.
- Outbound "answered" isn't the same as "connected to a prospect." Reception, IVR, wrong numbers, and Live Voicemail can all inflate "answered" unless you separate them.
You just read that answer rate swings hard with list quality and caller trust. That's exactly why top teams use Prospeo's 125M+ verified mobile numbers - 30% pickup rate vs 11-12% from Apollo and ZoomInfo. Stop dialing switchboards and start reaching decision-makers directly.
Fix your answer rate at the source: dial numbers that actually connect.
Choose-your-definition matrix + the voicemail rule
Look, if you can't explain your numerator and denominator in one sentence, your metric's meaningless.
Choose-your-definition matrix (inbound + outbound)
| Use case | Numerator (answered) | Denominator | Best for | Watch-outs |
|---|---|---|---|---|
| Outbound: human answer | Live human only | Total dials | SDR reachability | Excludes VM/busy/no answer |
| Outbound: connect | Prospect answered | Total dials | Gong-style comps | Live Voicemail inflates |
| Outbound: talked | Calls > X sec | Total dials | Filters junk | X must be fixed |
| Inbound: eventual answer | Answered by agent | Total inbound | Coverage | Hides long waits |
| Inbound: service level | Answered <= X sec | Total inbound | CX + staffing | Don't exclude abandons |
| Inbound: handled rate | Answered by agent | Offered calls | Ops tracking | "Offered" varies |

Inbound answer rate (eventual) vs service level answer rate (within X seconds)
Inbound has two different questions:
- Did we eventually answer? (coverage)
- Did we answer fast enough? (experience)
"Eventual answer rate" should be high during staffed hours. But it's blunt. A center can answer 98% of calls and still deliver a miserable experience if half the calls wait four minutes.
That's why contact centers run service level: the percent of calls answered within a threshold (like 20 seconds). It's closer to what customers feel.
Outbound answer rate vs connect rate vs contact rate (terminology mapping)
Outbound terminology's a mess, so here's the practical mapping:
- Answer rate (common SDR usage): "Did anyone pick up?"
- Connect rate (Gong): answered by a prospect ÷ total dials.
- Contact rate (Balto-style): connected to a live person (not voicemail/busy/no answer) ÷ total calls.
- Conversation rate (Squaretalk framing): meaningful live interaction (often duration-based or disposition-based).
- Conversion rate (Balto framing): desired outcome ÷ connected calls (not ÷ total dials).
Hot take: if your deal size is small, you probably don't need to obsess over answer rate at all. You need a tighter ICP and better list hygiene.
It becomes a serious lever when each conversation is worth real money.
Does voicemail count? Decide once, then report both views
Voicemail is where teams get stuck because it's both an outcome and a definitional landmine.
A Call Centre Helper poll on whether voicemails count as abandoned calls shows the same split you see in "answered" debates: 54% say voicemail doesn't count, 37% say it does, and 9% say it depends.
The practical fix is boring, and it works: build two views and stop arguing.
- Human answer rate: live human only
- Network-answered rate: anything your reporting marks as answered (includes Live Voicemail/device voicemail behavior)
Benchmarks: what's a good answer rate in 2026 (inbound vs outbound)
Outbound benchmarks are the ones everyone wants, because they're painful, and because cold call answer rate swings hard with list quality and caller trust.
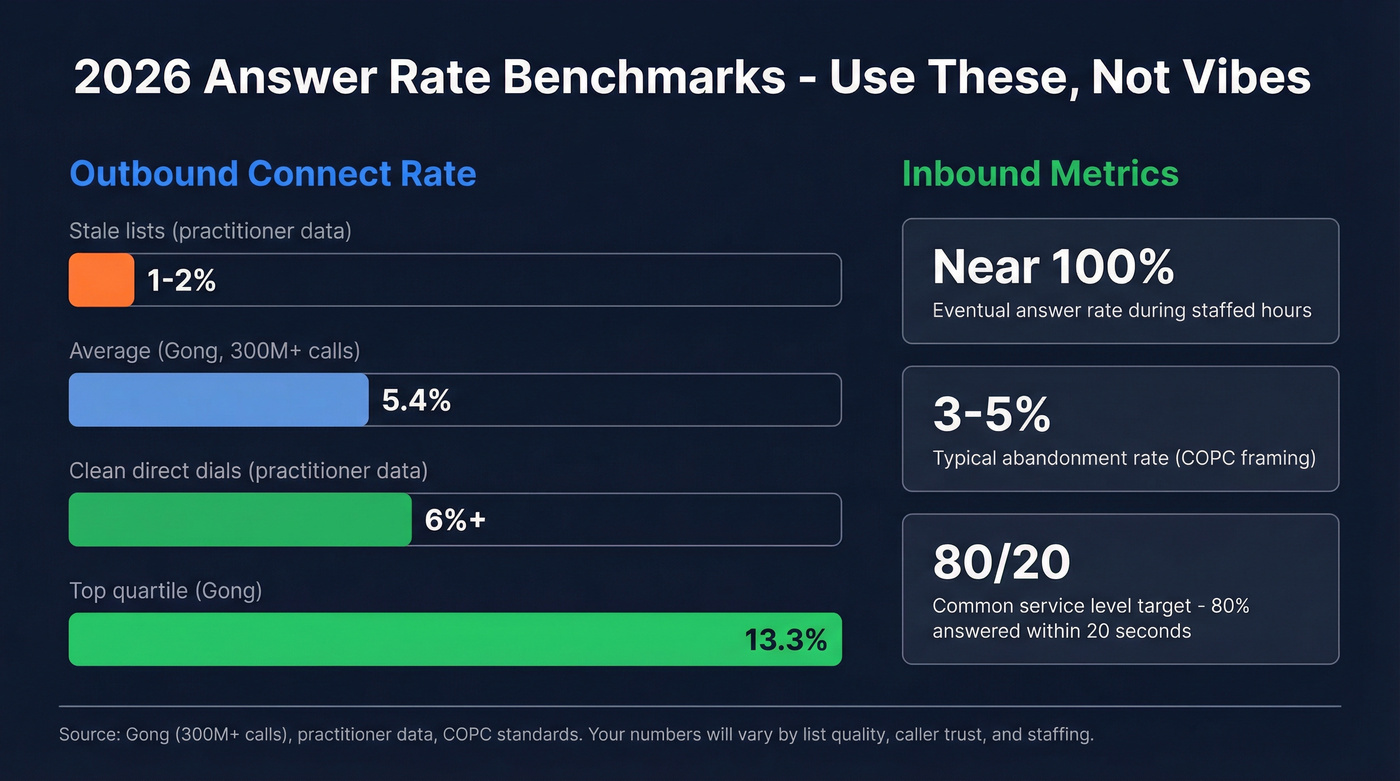
Gong's dataset (300M+ calls) is a solid anchor for modern outbound: 5.4% average connect rate and 13.3% top quartile. Gong also shows why "connect" isn't the finish line: top performers convert conversations to meetings far better - 16.7% set rate vs 4.6% average - which is the difference between "busy reps" and pipeline.
Practitioner reality is even wider. We've tested campaigns where one list sat at 1-2% connect all week, then jumped to 6%+ after we removed recycled numbers, switched to direct dials, and stopped hammering the same time window every day.
Inbound is different. During staffed hours, eventual answer should be near-100% for most customer service environments. If it isn't, you don't have an "answer rate problem," you have a staffing, routing, or forecasting problem.
Inbound performance is managed via:
- Service level (answer within X seconds)
- Abandonment (keep it low)
- ASA (average speed of answer)
- AHT (average handle time: talk + hold + after-call work)
2026 benchmark box (use this, not vibes) Outbound connect rate: 5.4% average, 13.3% top quartile (Gong) Outbound "in the wild": ~1-2% on stale lists; ~6%+ with clean direct dials (practitioner/Reddit) Inbound eventual answer: near-100% during staffed hours (most support queues) Inbound abandonment: 3-5% is typical in many environments (COPC framing)
Mini-scenarios (so you don't benchmark wrong)
- Outbound SDR team: 4% connect rate might be fine if you're calling cold, but it's a red flag if you're calling warm inbound leads within five minutes.
- Inbound support line: 92% "answered" can still be a disaster if 8% abandon during peak hours and your service level's collapsing.
Inbound: answer rate vs service level vs ASA vs abandonment (how to run it correctly)
Inbound reporting goes off the rails when teams obsess over "answer rate" and ignore the KPI chain that actually drives customer experience.
The inbound KPI chain (ASA -> abandonment -> SL) in plain English
- ASA (Average Speed of Answer): how long callers wait before reaching an agent.
- Abandonment: callers who end the call before any conversation occurs. Abandonment can happen in IVR, queue, ringing, or voicemail stages.
- Service level (SL): percent of calls answered within a threshold (like 20 seconds).

AHT is the hidden driver. Average Handle Time is talk time + hold time + after-call work, and when it creeps up even a little (new product issue, messy process, longer notes), your queue backs up fast, ASA spikes, abandonment follows, and service level falls off a cliff.
So if your inbound "answer rate" dips, don't start with coaching. Start with: "What happened to AHT and ASA in the 10:00-11:00 interval?"
Do's and don'ts (the stuff that breaks inbound metrics)
Do:
- Measure service level on total offered calls, not just handled calls.
- Track abandonment separately for very short abandons vs meaningful abandons.
- Report by interval (15/30/60 minutes), then roll up.
Don't:
- Don't compute service level only on handled calls.
- Don't exclude abandons under X seconds just to make the dashboard look better.
- Don't treat 80/20 as universal across every queue.
I've seen teams "hit 80/20" on paper while customers still abandon like crazy, because the report quietly excluded short abandons and only counted handled calls.
That drives me nuts.
Interval reporting: the fix for "daily average lies"
Daily averages hide pain.
If you average ASA across a day, you can miss the fact that 11:30-12:30 was a dumpster fire (lunch coverage, shift change, whatever) and that's when your highest-value callers came in.
Track ASA and abandonment by time interval, then investigate spikes. You'll find patterns fast: staffing gaps, routing issues, broken IVR paths, or a marketing campaign that drove calls without warning the contact center.
Outbound: stop optimizing "pickups" and use a KPI ladder
Outbound answer rate is useful, but only as the first rung on a ladder - especially if you're tracking outbound sales call answer rate across multiple lists and personas.
If you optimize for pickups alone, you'll get more pickups and not necessarily more pipeline.
Here's a KPI ladder that works:
- Pickup / connect (someone answered)
- Conversation / engagement (it wasn't junk)
- Conversion (meeting, next step, qualified opp)
Duration thresholds make this portable across tools:
- Engagement: calls lasting >= 1 minute
- Success: calls lasting >= 2 minutes (configurable)
Those thresholds aren't magic, but the concept is. It's how you filter out "hello? ... wrong number" from real conversations.
Cognism/WHAM's cold calling dataset gives you another sanity check: average cold call duration is ~93 seconds. So if you define "conversation" as >10 seconds, you're counting a lot of noise.
Also, stop calling the same lead 12 times. Diminishing returns are real: by call 3, teams get 93% of total conversations; by call 5, 98.6%. Past that, you're mostly burning brand and rep morale.
If you want the deeper playbook, see our B2B cold calling guide.
What practitioners report (the reality check)
In our experience, the "mystery" behind low answer rates is usually boring: stale numbers, too many main lines, and outbound numbers that got burned by volume spikes.
And yes, Reddit threads line up with what we see in the field:
- 1-2% connect is common when data's stale and numbers are wrong.
- ~6% connect is achievable with clean direct dials plus strong caller trust signals.
- Cold call answer rates vary a lot by industry, region, and whether you're dialing mobiles vs main lines.
Why your tools disagree (numerator/denominator audit + measurement spec)
If your dialer says 11%, your CRM says 6%, and your carrier analytics says 14%, you don't have three realities.
You have three definitions.
Audit checklist (do this before you "fix performance")
- Step 1: Pull raw outcomes. Export a week of calls with outcomes: answered, voicemail, busy, no answer, abandoned, short abandoned, missed.
- Step 2: Identify the denominator each tool uses. Inbound totals often include abandoned, short abandoned, missed, and voicemails. Outbound totals split connected/not connected/voicemail differently too.
- Step 3: Check if voicemail is treated as answered. Many systems do this implicitly.
- Step 4: Add a duration lens. Re-cut the week using duration filters like >30s or >60s, then compare to total calls.
- Step 5: Log outcomes intentionally. Use dispositions/custom activities or tags (e.g., #answered, #voicemail, #gatekeeper) so you're not guessing from duration alone.
- Step 6: Decide your unit. Measure per-call vs per-unique number vs per-lead, and document it. If you don't, one rep's "persistence" will inflate the denominator and make them look worse than they are.
If you're building this into dashboards, it helps to align on revenue dashboards rules and definitions early.
Where the mismatch usually lives (mini table)
| System | What it's good at | Common mismatch |
|---|---|---|
| Dialer | call outcomes | counts Live Voicemail as answer |
| Carrier | network events | can't see "human" |
| CRM | activity reporting | dedupe + tagging gaps |
Measurement spec template (copy/paste)
Treat this like a contract between RevOps, Sales, and Support:
- Answered (outbound): live human only OR network-answered (includes Live Voicemail)
- Busy: counted as not answered
- No answer: rings out / no connect
- Voicemail: carrier voicemail vs device voicemail (if available)
- Short abandon (inbound): under X seconds (define X)
- Missed (inbound): rang but never connected (define stage)
- Conversation threshold: >=30s / >=60s / >=1 min (pick one)
- Conversion event: meeting set / qualified next step (define it)
- Unit of analysis: per dial vs per unique number vs per lead
- Predictive dialer abandoned calls: report separately (agent not available at connect)
If you’re standardizing ops, you’ll also want a lightweight data quality scorecard so bad inputs don’t keep re-breaking the metric.
How to improve answer rate (inbound + outbound levers that actually move it)
This metric moves when you pull the right levers.
Not when you yell at reps to "smile and dial."
Here's the split playbook: one side is operations, the other is reachability.
The split playbook (inbound vs outbound)
| Inbound levers (coverage + CX) | Outbound levers (reachability + trust) |
|---|---|
| Staff to intervals, not daily averages | Build time-of-day views by persona/region |
| Use ASA as the early warning signal | Stop after diminishing returns (shift channels after call 3-5) |
| Fix routing/IVR before hiring | Prioritize direct dials/mobiles; suppress bad numbers |
| Offer callback to cut abandonment | Test local presence where it helps (don't assume) |
| Push simple intents to self-service | Improve caller ID reputation/number health (monitor, rotate, suppress flagged) |
The outbound "trust stack" (do these, in this order)
Caller trust is now a first-class variable. If you ignore it, you'll keep rewriting scripts while your numbers get labeled as spam.
Do this:
- Register CNAM (and keep it consistent).
- Use branded caller ID where your carriers/apps support it.
- Keep a stable set of outbound numbers (random churn looks shady).
- Avoid high-volume bursts that trigger labeling.
- Run number health checks and suppress numbers that get flagged.
- Verify your attestation path (A/B/C) with your carrier chain.
- Use local presence deliberately: test by persona/region and keep what wins.
In the latest published SHAKEN stats, only 44.4% of calls were signed at termination. Attestation mix: A 30.1%, B 3.3%, C 8.3%. Translation: a lot of calls still arrive downstream without strong trust signals, and labeling behavior varies by carrier and device.
If you want to go deeper on dialing tools and setup, see our guide to outbound calling software.
iOS Live Voicemail: the metric distortion you can't "coach away"
Live Voicemail can look identical to a human answer in reporting, and there's no network-level way to reliably distinguish it. That inflates answer rate, talk time, contact rate, and anything downstream that depends on "answered."
Mitigation that works:
- Maintain two views: with Live Voicemail and without Live Voicemail (when your tooling supports it).
- Use duration thresholds to separate real conversations from device-intercepted voicemail behavior.
Fix bad data first (and skip this if your list is already clean)
If you're already dialing verified direct dials and your wrong-number rate is low, skip the "data" rabbit hole and focus on trust + timing.
If you're not, fix the list before you touch scripts.
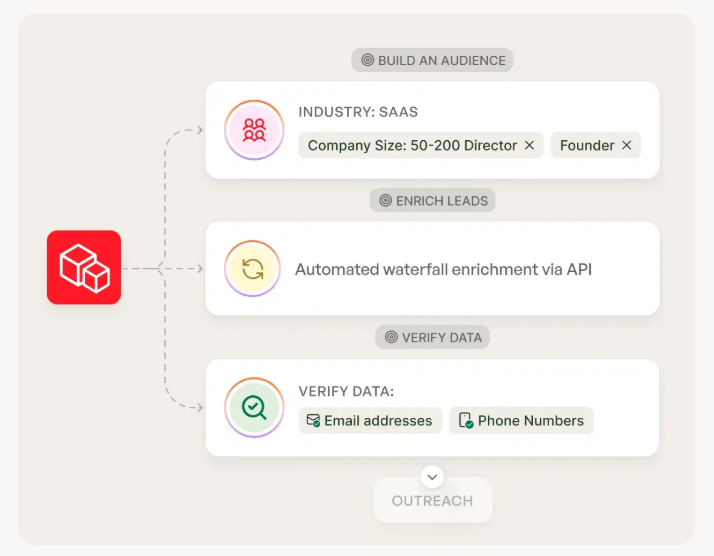
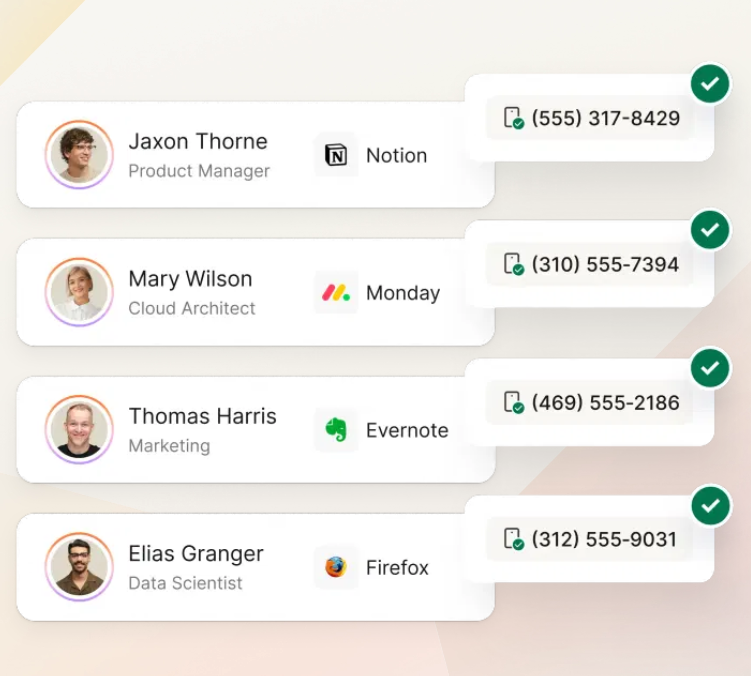
Bad numbers crush reachability and waste rep hours. Prospeo, "The B2B data platform built for accuracy", is one of the fastest ways we've found to clean up outbound inputs: 300M+ professional profiles, 143M+ verified emails (98% accuracy), and 125M+ verified mobile numbers, refreshed every 7 days (the industry average is about 6 weeks). If you need mobiles specifically, the Mobile Finder is the straight-line solution: verify, suppress junk, and stop paying reps to dial dead ends.
If you’re diagnosing why numbers go stale so fast, start with B2B contact data decay and then tighten your BDR contact data refresh workflow.
Three things to fix first (in order):
- Define the metric + audit denominators
- Remove bad numbers (and stop re-dialing them)
- Improve caller trust + tighten timing/cadence
FAQ: Answer rate questions teams ask
What's a good outbound answer/connect rate in 2026?
A good outbound connect rate in 2026 is typically 5-13% depending on list quality, persona, and dialing strategy: Gong's benchmark is 5.4% average and 13.3% top quartile. Practitioner ranges often cluster around 1-2% on cold lists and ~6%+ with clean direct dials and strong trust.
Should voicemail count as "answered"?
Voicemail should only count as "answered" when you're measuring network-level reachability, not live conversations. The clean approach is to report two views: human-answered (live pickup) and network-answered (which can include voicemail/Live Voicemail behavior), so your team stops arguing and starts improving.
Why does my dialer answer rate differ from my CRM report?
They differ because tools use different numerators/denominators and grouping logic, so the same week of calls can produce 6% vs 11% vs 14% depending on what's counted. Dialers often treat voicemail as answered, while CRMs depend on dispositions/tags and can dedupe multiple calls per lead.
How do I adjust for iOS Live Voicemail inflating "answered" calls?
Separate reporting views and apply duration thresholds: treat calls under 30-60 seconds as non-conversations unless dispositioned otherwise. Live Voicemail can look like a human pickup in reporting, so keep a "with Live Voicemail" view and a "without Live Voicemail" view when your tooling supports it.
What's the fastest way to raise answer rate without dialing more?
Stop wasting dials on wrong or stale numbers and shift volume to verified direct lines. Suppress bad numbers, prioritize mobiles/direct dials, and then fix caller trust (CNAM, branded caller ID, number health) so your calls stop getting filtered or labeled.
Next steps (do this this week)
Write your definition of "answered" (human vs network), lock the denominator, and publish a one-page measurement spec.
Then run a 7-day audit: raw outcomes, duration buckets, and interval reporting for inbound (ASA/AHT/abandonment). Finally, fix the boring stuff that moves the needle: suppress bad numbers, stabilize outbound numbers, and track number health like it's a pipeline metric, because it is.
Your answer rate will stop being a debate and start being a lever once it's defined, audited, and tied to the right KPI ladder.
Gong says top quartile teams hit 13.3% connect rate. The difference isn't script or timing - it's data. Prospeo delivers 98% accurate emails and verified direct dials refreshed every 7 days, so your reps call real numbers for real buyers, not recycled lists full of wrong numbers and main lines.
Better data means more human answers and fewer voicemail graveyards.